. 2022 Feb 28;12(6):2502-2518.
doi: 10.7150/thno.63824. eCollection 2022.

Hepatic PRMT1 ameliorates diet-induced hepatic steatosis via induction of PGC1α

Affiliations

Hepatic PRMT1 ameliorates diet-induced hepatic steatosis via induction of PGC1α

Lu Xu et al. Theranostics. .

Abstract

Rationale: Over-nutrition will lead to overexpression of PRMT1 but protein hypomethylation is observed in the liver of obese subjects. The dynamic alteration of the expression and methyltransferase activity of PRMT1 in the progression of fatty liver diseases remains elusive. Methods: We used recombinant adeno-associated virus-mediated gene delivery system to manipulate the hepatic PRMT1 expression level in diet-induced obese mice to investigate the role of PRMT1 in hepatic steatosis. We further utilized a cohort of obese humans with biopsy-proven nonalcoholic fatty liver disease to support our observations in mouse model. Results: We demonstrated that knockdown of PRMT1 promoted steatosis development in liver of high-fat diet (HFD) fed mice. Over-expression of wild-type PRMT1, but not methyltransferase-defective mutant PRMT1G80R, could alleviate diet-induced hepatic steatosis. The observation is conserved in the specimens of obese humans with biopsy-proven nonalcoholic fatty liver disease. Mechanistically, methyltransferase activity of PRMT1 was required to induce PGC-1α mRNA expression via recruitment of HNF-4α to the promoter of PGC-1α, and hence attenuated HFD-induced hepatic steatosis by enhancing PGC-1α-mediated fatty acid oxidation. Conclusions: Our results identify that activation of the PRMT1/HNF-4α/PGC-1α signaling is a potential therapeutic strategy for combating non-alcoholic fatty liver disease of obese subjects.

Keywords: Diet-induced hepatic steatosis; HNF-4α; Non-alcoholic fatty liver disease (NAFLD); PGC-1α; PRMT1.


Conflict of interest statement

Competing Interests: The authors have declared that no competing interest exists.

Figures

Figure 1
Figure 1
Long-term HFD feeding markedly induces the expression level of PRMT1 in hepatocytes. Eight-week-old male C57BL/6N mice were fed with either STC or HFD for 2 months. A. Hepatic mRNA expression levels of PRMT1 as determined by qPCR analysis. B. Hepatic protein expression level of PRMT1 as determined by Western blotting (left). Each lane is a sample from a different individual. Quantification of hepatic protein expression levels of PRMT1 (right). C. Hepatic protein expression level of PRMT1 as determined by Immunohistochemistry (IHC). Representative images of immunohistochemical staining of PRMT1 in liver sections. (200X). D. Left panel, Protein expression levels (left panel) of PRMT1, Albumin and CD11b as determined by Western blotting analysis in fractions of hepatocytes or non-parenchymal cell (NPC) isolated from livers of mice fed with either STC or HFD. Right panel, quantification of protein expression levels of PRMT1 (left), Albumin (middle) and CD11b (right). Protein expression levels were normalized to the expression of β-actin. The fraction of Hepatocytes in STC group was set as 1 for fold-change calculation unless mentioned otherwise. Data represent as mean ± SEM; n = 3 per group. E. Protein arginine methylation levels in the livers as determined by Western blotting. Each lane is a sample from a different individual. F. S-Adenosylmethionine (SAM) concentration in the livers of mice as determined by mass spectrometry. STC group was set as 1 for fold-change calculation unless mentioned otherwise. Data represent as mean ± SEM; n = 4-5 per group; repeated with three independent experiments; *P < 0.05, **P < 0.01, ***P < 0.001.
Figure 2
Figure 2
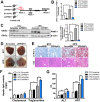
Knockdown of hepatic PRMT1 exaggerates liver steatosis in mice fed with HFD. Eight-week-old male C57BL/6N mice were infected with 3×10¹¹ copies of AAV encoding U6-PRMT1 shRNA (shPRMT1) or scrambled control (Scramble) shRNA for 9 weeks upon either STC or HFD feeding, respectively. A. Schematic illustration of viral treatments. B. Hepatic mRNA expression levels of PRMT1 as determined by qPCR analysis. C. Hepatic protein expression level of PRMT1 as determined by Western blotting (left). Each lane is a sample from a different individual. Quantification of hepatic protein expression levels of PRMT1 (right). D. Representative gross pictures of liver tissue. E. Representative images of Oil Red O (upper panel) and H&E (lower panel) staining of liver sections. (200X) F. Hepatic cholesterol and triglycerides levels were normalized by total protein contents of liver tissues used for lipid extraction. G. Serum levels of alanine transaminase (ALT) and aspartate transaminase (AST). mRNA expression levels of the target genes were normalized to the expression of mouse β-actin. STC-Scramble group was set as 1 for fold-change calculation unless mentioned otherwise. Data represent as mean ± SEM; n = 5-8 per group; repeated with three independent experiments; *P < 0.05, **P < 0.01, ***P < 0.001.
Figure 3
Figure 3
Down-regulation of hepatic fatty acid β-oxidation (FAO) rates is observed in mice with PRMT1 knockdown after long-term HFD feeding. Eight-week-old male C57BL/6N mice were infected with 3×10¹¹ copies of AAV encoding U6-PRMT1 shRNA (shPRMT1) or scrambled control (Scramble) shRNA for 9 weeks upon HFD feeding, respectively. A. Hepatic mRNA expression of genes related to lipogenesis (acetyl-CoA carboxylase-1 [ACC-1], stearoyl-CoA desaturase 1 [SCD1] and peroxisome proliferator-activated receptor γ [PPARγ] and sterol regulatory element-binding protein 1 [SREBP-1c]) as determined by qPCR analysis. B. Hepatic mRNA expression of genes related to VLDL secretion (Carboxylesterase 3/triacylglycerol hydrolase [TGH], monoacylglycerol acyltransferase 1 [MGAT1], cell death-inducing DFF45-like effector b, [Cideb]) as determined by qPCR analysis. C. Hepatic mRNA expression of genes related to FAO (carnitine-dependent transport-1α [CPT1α], acyl‐CoA oxidase 1 [ACOX1], enoyl-CoA hydratase and 3-hydroxyaryl CoA dehydrogenase [Ehhadh], enoyl-CoA hydratase and 3-hydroxyacyl CoA dehydrogenase [Acaa1b], short-chain acyl-CoA dehydrogenases [SCAD], long-chain acyl-CoA dehydrogenases [LCAD] and very long-chain acyl-CoA dehydrogenases [VLCAD]) as determined by qPCR analysis. D. Hepatic FAO rates in HFD-Scramble and HFD-shPRMT1 mice were determined by ex vivo incubation of freshly harvested mice liver tissues with 1-14C-palmitic acid, respectively. Upon incubation, 14C-palmitate that does not get oxidized to fatty acyl-CoAs shorter than ∼6 carbons in length will precipitate out of solution upon addition of 1M perchloric acid and left the rest part as incompletely oxidized acid-soluble metabolites (ASMs). In addion, 14C-labeled acetyl-CoA will also further enter the tricarboxylic acid (TCA) cycle and be oxidized to 14CO2. By trapping 14CO2 using 1M NaOH soaked paper disc. To calculate total FAO rates, we counted the radioactive activity of both ASMs and 14CO2 with scintillation counter. The average counts per minute of each sample was combined ASMs and 14CO2 proportion and normalized by total protein contents of liver tissues used in this analysis. E. Hepatic mRNA expression levels of PGC-1α as determined by qPCR analysis. mRNA expression levels of the target genes were normalized to the expression of mouse β-actin. HFD-Scramble group was set as 1 for fold-change calculation. F. Western blot analysis of Hepatic protein expression of PGC-1α as determined by Western blotting (left). Each lane is a sample from a different individual. Quantification of hepatic protein expression levels of PGC-1α (right). Data represent as mean ± SEM; n = 5-8 per group; repeated with three independent experiments; *P < 0.05, **P < 0.01, NS, not significant.
Figure 4
Figure 4
Methyltransferase inactivation of PRMT1 abolishes its protective role against diet-induced hepatic steatosis. Eight-week-old male C57BL/6N mice were infected with 3×10¹¹ copies of AAV encoding wild-type PRMT1 (PRMT1 WT), methyltransferase activity-deficient PRMT1G80R (PRMT1 Mut) or Luciferase (Luc), for 12 weeks upon HFD feeding. A. Hepatic mRNA expression levels of PRMT1 (left) and PGC-1α (right) as determined by qPCR analysis. B. Protein expression of PRMT1 and PGC-1α in the liver tissue of these mice as determined by Western blotting (left). Each lane is a sample from a different individual. Quantification of hepatic protein expression levels of PRMT1 (middle) and PGC-1α (right). C. Representative images of Oil Red O (upper panel) and H&E (lower panel) staining of liver sections. (200X) D. Hepatic cholesterol and triglycerides levels were normalized by total protein contents of liver tissues used for lipid extraction. E. Serum ALT and AST levels. F. Hepatic FAO rates were determined by in vitro incubation of freshly harvested mice liver tissues with 1-14C-palmitic acid as shown in Figure 3B. The average counts per minute of each sample was combined ASMs and 14CO2 proportion and normalized by total protein contents of liver tissues used in this analysis. mRNA expression levels of the target genes were normalized to the expression of mouse β-actin. STC-Luc group was set as 1 for fold-change calculation. Data represent as mean ± SEM; n = 5-8 per group; repeated with three independent experiments; *P < 0.05, **P < 0.01, ***P < 0.001.
Figure 5
Figure 5
PGC-1α is required for PRMT1-mediated alleviation of diet-induced hepatic steatosis. Eight-week-old male C57BL/6N mice were infected with 3×10¹¹ copies of AAV encoding ApoE-PRMT1 (PRMT1) for over-expression of PRMT1 or ApoE-Luciferase control (Luc) for 7 weeks upon HFD feeding. Adenovirus encoding PGC-1α shRNA (shPGC-1α) or scrambled control (Scramble) were subsequently given by tail vein injection (2×10⁹ p.f.u./mouse) at 7 weeks post AAV injection and mice were sacrificed 2 weeks post-adenoviral infection. A. Schematic illustration of viral treatments. B. Hepatic protein expression of PGC-1α and PRMT1 as determined by Western blotting. Each lane is a sample from a different individual. C. Quantification of hepatic protein expression of PGC-1α and PRMT1. D. Serum levels of ALT and AST. E. Representative images of Oil Red O (upper panel) and H&E (lower panel) staining of liver sections. (200X) F. Hepatic cholesterol and triglycerides levels were normalized by total protein contents of liver tissues used for lipid extraction. G. qPCR analysis of mRNA expression levels of hepatic FAO related genes. H. Hepatic FAO rates were determined by ex vivo incubation of freshly harvested mice liver tissues with 1-14C-palmitic acid as shown in Figure 3B. The average counts per minute of each sample was combined ASMs and 14CO2 proportion and normalized by total protein contents of liver tissues used in this analysis. mRNA expression levels of the target genes were normalized to the expression of mouse β-actin. HFD-Luc-Scramble group was set as 1 for fold-change calculation. Data represent as mean ± SEM; n = 5-8 per group; repeated with three independent experiments; *P < 0.05, **P < 0.01, ***P < 0.001.
Figure 6
Figure 6
The methyltransferase activity of PRMT1 regulates the transcriptional activity of PGC-1α through HNF-4α. A. DNA motif sequence logo of mouse HNF-4α was generated by JASPAR (2018). The dissimilarity, random expectation (RE) equally and query between query sequence of PGC-1α and predicted transcription factor binding site sequence of HNF-4α were calculated using PROMO (ver. 8.3). B. Luciferase reporter assay on PGC-1α promoter in response to over-expression of WT or Mutant PRMT1 by truncation analysis. Hepa1-6 cells were co-transfected with pAM2AA-ApoE-PRMT1 WT or Mutant (Mut) plasmids with different lengths or mutant (deletion of -146 to -137 region) of pGL3-PGC-1α promoter-Luciferase plasmids for 48 hours. Cell lysates were used for luciferase assay. Total protein content of each sample was used for normalization. Treatment with co-transfection with PRMT1 Mut and promoter region -1000/+1 of PGC-1α was set as 1 for fold-change calculation. C. Fold enrichment of occupancy of HNF-4α on the promoter region of PGC-1α in response to co-expression of HNF-4α with GFP/PRMT1 WT/PRMT1 Mut in Hepa1-6 cells as detected by ChIP assay with rabbit anti-HNF-4α polyclonal antibody or non-immune rabbit IgG as control. The precipitated chromatin was analysed by qPCR using primers (shown in Table S2) spanning to the PGC-1α proximal promoters. D. Luciferase reporter assay on PGC-1α promoter in response to over-expression of WT or non-methylatable Mutant (Mut) HNF-4α plasmids. Hepa1-6 cells were co-transfected with pAM2AA-ApoE-PRMT1 WT/GFP with either pAM2AA-ApoE-HNF-4α WT or Mut plasmids with pGL3-PGC-1α promoter (-300 to +1)-Luciferase plasmids for 48 hours. Cell lysates were used for luciferase assay. Total protein content of each sample was used for normalization. Treatment with co-transfection with HNF-4α WT, GFP and promoter region -300/+1 of PGC-1α was set as 1 for fold-change calculation. mRNA expression levels of the target genes were normalized to the expression of mouse β-actin. Treatment with co-transfection with GFP and HNF-4α was set as 1 for fold-change calculation. mRNA expression levels of the target genes were normalized to the expression of mouse β-actin. Data represent as mean ± SEM; n = 5-8 per group; repeated with three independent experiments; *P < 0.05, **P < 0.01, ***P < 0.001. E. Methylation levels of HNF-4α in liver lysates harvested from STC-Luc, HFD-Luc, HFD-PRMT1 WT and HFD-PRMT1 Mut mice were analysed, and F. Methylation levels of HNF-4α in liver lysates harvested from STC-Luc, HFD-Luc, HFD-shPRMT1 mice were analysed by immunoblotting using anti-dimethyl arginine antibody. Relative amounts of methylated HNF-4α over total HNF-4α was determined by densitometry and indicated below the blots. HNF-4α is required for PRMT1-mediated induction of PGC-1α expression on Hepa1-6 cells. Hepa1-6 was transfected with either GFP or PRMT1 over-expressing plasmids for 24 hours, followed by transfection with shScramble (Scramble) or shHNF-4α-1 or shHNF-4α-2 plasmids for another 72 hours. G. mRNA expression levels of PRMT1, HNF4α and PGC-1α as determined by qPCR analysis. H. Protein expression of PRMT1, HNF-4α and PGC-1α as determined by Western blotting (left). Quantification of protein expression levels of PRMT1, HNF4α and PGC-1α (from left to right). mRNA expression levels of the target genes were normalized to the expression of mouse β-actin. Control group was set as 1 for fold-change calculation. Data represent as mean ± SEM; n = 4 per group; repeated with three independent experiments; *P < 0.05, **P < 0.01, ***P < 0.001, NS, not significant.
Figure 7
Figure 7
Hepatic expression of PRMT1 is downregulated in obese patients with hepatic steatosis when compared to those with normal liver morphology, and is positively associated with hepatic PGC-1α expression level. A. Hepatic IHC staining of PRMT1 in liver sections of these study subjects. (200X) B. Quantification of PRMT1 protein expression levels in liver sections of these study subjects based on IHC staining results by using ImageJ. C. mRNA expression levels of PRMT1 and D. mRNA expression levels of PGC-1α in liver of these study subjects as determined by qPCR analysis. E. Correlation between PRMT1 and PGC-1α levels in liver of these study subjects. mRNA expression levels of the target genes were normalized to the expression of human β-actin. Obese subjects with healthy liver were set as 1 for fold-change calculation. Data represent as mean ± SEM; n = 4-8 per group. Correlation was assessed by non-parametric Spearman's test. *P < 0.05, **P < 0.01, ***P < 0.001.

Similar articles

Cited by

References

    1. Sanyal AJ. Past, present and future perspectives in nonalcoholic fatty liver disease. Nat Rev Gastroenterol Hepatol. 2019;16:377–86. - PubMed
    1. Kanwal F, Kramer JR, Mapakshi S, Natarajan Y, Chayanupatkul M, Richardson PA. et al. Risk of Hepatocellular Cancer in Patients With Non-Alcoholic Fatty Liver Disease. Gastroenterology. 2018;155:1828–37. e2. - PMC - PubMed
    1. Arab JP, Arrese M, Trauner M. Recent Insights into the Pathogenesis of Nonalcoholic Fatty Liver Disease. Annu Rev Pathol. 2018;13:321–50. - PubMed
    1. Pacana T, Cazanave S, Verdianelli A, Patel V, Min HK, Mirshahi F. et al. Dysregulated Hepatic Methionine Metabolism Drives Homocysteine Elevation in Diet-Induced Nonalcoholic Fatty Liver Disease. PloS one. 2015;10:e0136822. - PMC - PubMed
    1. Obeid R. The metabolic burden of methyl donor deficiency with focus on the betaine homocysteine methyltransferase pathway. Nutrients. 2013;5:3481–95. - PMC - PubMed

Publication types

MeSH terms

Substances