Review
. 2022 Mar 14;12(6):2860-2893.
doi: 10.7150/thno.70721. eCollection 2022.

Recent progress of carbon dots in targeted bioimaging and cancer therapy

Affiliations
Review

Recent progress of carbon dots in targeted bioimaging and cancer therapy

Cheng-Long Shen et al. Theranostics. .

Abstract

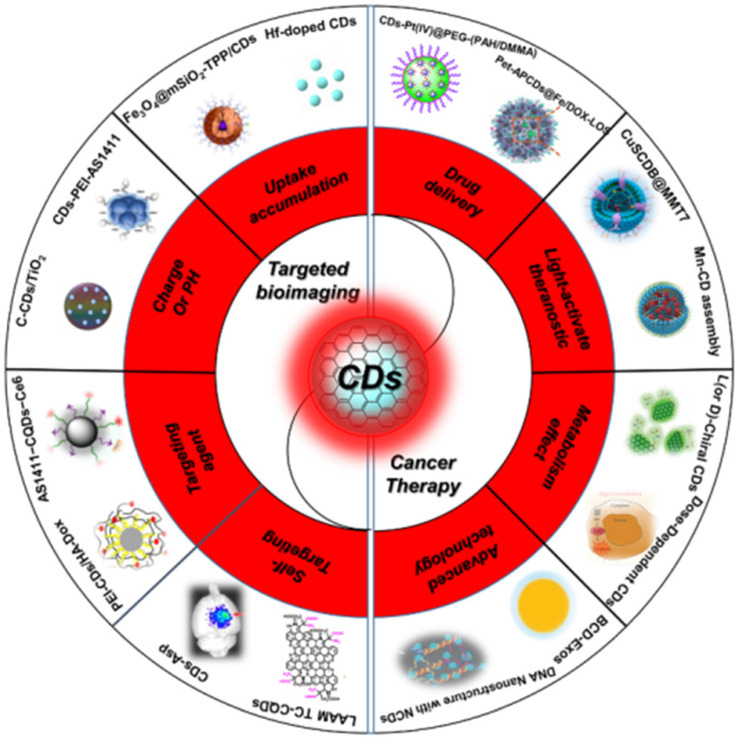
Carbon dots (CDs), as one new class of carbon nanomaterials with various structure and extraordinary physicochemical properties, have attracted tremendous interest for their potential applications in tumor theranostics, especially in targeted bioimaging and therapy. In these areas, CDs and its derivatives have been employed as highly efficient imaging agent for photoluminescence bioimaging of tumors cells. With unique structure, optical and/or dose attention properties, CDs have been harnessed in various nanotheranostic strategies for diverse tumors through integrating with other functional nanoparticles or utilizing their inherent physical properties. Up to now, CDs have been approved as novel biomaterials by their excellent performances in precise targeted bioimaging and therapy for tumors. Herein, the latest progress in the development of CDs in targeted bioimaging and tumor therapy are reviewed. Meanwhile, the challenges and future prospects of the application of CDs in promising nanotheranostic strategies are discussed and proposed.

Keywords: Carbon dots; cancer therapy; nanotheranostic; targeted bioimaging.


Conflict of interest statement

Competing Interests: The authors have declared that no competing interest exists.

Figures

Figure 1
Figure 1
Schematic of the carbon dots in tumor for targeted bioimaging and cancer therapy.
Figure 2
Figure 2
Schematic illustration of the synthetic strategies of CDs. (A) The CDs synthesized by arc-discharge. Adapted with permission from , copyright 2004, American Chemical Society. (B) The CDs synthesized by electrochemical oxidation. Adapted with permission from , copyright 2007, WILEY‐VCH Verlag GmbH & Co. KGaA, Weinheim. (C) The CDs synthesized by laser ablation. Adapted with permission from , copyright 2006, American Chemical Society. (D) The CDs synthesized with templet method. Adapted with permission from , copyright 2009 WILEY‐VCH Verlag GmbH & Co. KGaA, Weinheim. (E) The CDs synthesized by microwave-assisted pyrolysis. Adapted with permission from , copyright 2012 WILEY‐VCH Verlag GmbH & Co. KGaA, Weinheim. (F) The CDs synthesized with solvothermal method. Adapted with permission from , copyright 2013 WILEY‐VCH Verlag GmbH & Co. KGaA, Weinheim.
Figure 3
Figure 3
Schematic illustration of the classification of CDs and their different kinds of luminescence models for bioimaging. (A) The classification of CQDs, GQDs, CNDs and CPDs for different CDs. Adapted with permission from , copyright 2019 WILEY‐VCH Verlag GmbH & Co. KGaA, Weinheim. (B) Schematic illustration of the PL bioimaging. Adapted with permission from , copyright 2009, American Chemical Society. (C) Schematic illustration of the bioimaging via superresolution PL. Adapted with permission from , copyright 2018, American Chemical Society. (D) Schematic illustration of the bioimaging by phosphorescence and TADF. Adapted with permission from , copyright 2020 Elsevier Ltd. (E) Schematic illustration of the bioimaging with CL. Adapted with permission from , copyright 2019 WILEY‐VCH Verlag GmbH & Co. KGaA, Weinheim.
Figure 4
Figure 4
CDs-based targeted bioimaging through uptake accumulation. (A) CT value of Hf-CDs/iohexol aqueous solution at different concentrations. (B) CT values of major organs collected at different times after intravenous injection of Hf-CDs. (C) Ex vivo bright field, FI and CT images of major organs collected at different intervals post tail vein injection of Hf-CDs. (D) Quantitative analysis of the CT values. (E) Quantitative analysis of the FI intensity. Adapted with permission from , copyright 2020 Elsevier Ltd. (F) Schematic route of the synthesis of Fe3O4@mSiO2-TPP/CDs nanoplatform. (G) Illustration of the cells exposed to the Fe3O4@mSiO2-TPP NPs while positioned or not in a static magnetic field. (H)-(J) CLSM images of the A549 (I), HFF (J), and HeLa (K) cell lines treated with the Fe3O4@mSiO2-TPP NPs for different time under Mag+ or Mag-. Adapted with permission from , copyright 2015 American Chemical Society.
Figure 5
Figure 5
CDs-based targeted bioimaging through charge or pH interaction. (A) Scheme of the synthesis of CDs and its bio-imaging in oral cancer cell lines. (B) Mechanism underlying uptake of zwitterionic CDs. Adapted with permission from , copyright 2018 American Chemical Society. (C) Predicted mechanism of the different cellular uptake behaviour of CDs-PEI-AS1411 with the nucleolin-positive MCF-7 cancer cells and nucleolin-negative L929 fibroblast cells. Adapted with permission from , copyright 2019 John Wiley & Sons Ltd. (D) Scheme of the design and application of pH-responsive C-CD/TiO2 for targeted bioimaging via cellular membrane-nucleus translocation in response to visible-light irradiation. Adapted with permission from , copyright 2020 American Chemical Society.
Figure 6
Figure 6
CDs-based targeted bioimaging through targeting biomarker sensor. (A-B) Schematic diagram of the engineering of nucleolin-targeted ratiometric fluorescent nanoprobe AS1411-CQDs-Ce6 for endogenous CTSB imaging with a remarkably large emission wavelength shift in living cancer cells. Adapted with permission from , copyright 2020 American Chemical Society. (C) Fluorescence emission spectra of AA-CDs upon gradual addition of FA. Adapted with permission from , copyright 2018 Elsevier B.V. (D) Schematic of the glutathione triggered Fluorescence “Turn On” of ACD. Reproduced with permission , copyright 2016 American Chemical Society. (E) Fluorescence spectrum of CDs in the presence of various concentrations of GSH. (F) UV-vis spectrum of CDs in the presence of various concentrations of GSH. Adapted with permission from , copyright 2020 American Chemical Society.
Figure 7
Figure 7
CDs-based targeted bioimaging through selective recognition. (A) Schematic illustration of the formation of PEI-CDs/HA-Dox, and the nanoprobe used for targeted cancer cell imaging and drug delivery. Adapted with permission from , copyright 2017 Elsevier B.V. (B) Schematic of molecularly imprinted polymer coated CDs for cancer cell targeting bioimaging, (C) Confocal microscope images of fixed HaCaT and HeLa cells treated with CDs, CD-NIP, and CD-MIPGlcA. (D) Confocal micrographs showing labeling of GlcA on a single HeLa cell by CD-MIPGlcA (green) and nuclear staining with PI (red). (E) Analysis of labeled cells with CD-MIPGlcA, CDNIP, and CD as obtained from Image J by measuring the normalized fluorescence of each single cell area from five different images. Adapted with permission from , copyright 2018 American Chemical Society.
Figure 8
Figure 8
CDs-based targeted bioimaging by self-targeting. (A) In vivo and ex vivo imaging of glioma-bearing mice after tail intravenous injection of CD-Asp. (B) In vivo imaging of glioma-bearing mice at different time points after injection with CD-Asp, CD-G, CD-A, and CD-Glu. (C) Ex vivo imaging of glioma-bearing brain of brain and glioma. (D) Ex vivo imaging after the injection of CD-Asp, CD-G, CD-A, and CD-Glu of heart, liver, spleen, lung, and kidney. Adapted with permission from , copyright 2015 American Chemical Society.
Figure 9
Figure 9
CDs-based targeted bioimaging by self-targeting. (A) Schematic and hypothetical steps of LAAM TC-CQD synthesis. (B) Fluorescence emission spectrum with an excitation wavelength of 600 nm. (C) LCSM images of HeLa cells that were pretreated with Leu, Phe, Gly or BCH. (D)-(F) Downregulation of LAT1 expression by CRISPR-Cas9 in HeLa cells reduced the cellular uptake of LAAM TC-CQDs (F). The red arrows in b indicate the sgRNA-targeting sequences. Successful targeting of LAT1 was confirmed using Sanger sequencing (D) and western-blot analysis (E). Adapted with permission from , copyright 2020 Springer Nature.
Figure 10
Figure 10
CDs-based cancer therapy via drug delivery. (A) Schematic illustration for the preparation of charge-convertible CDs-based drug nanocarrier CDs-Pt(IV)@PEG-(PAH/DMMA). (B) Schematic illustration for the drug delivery process of CDs-Pt(IV)@PEG-(PAH/DMMA). Adapted with permission1 from , copyright 2016, American Chemical Society. (C) Schematic illustration for the preparation of CD-based drug nanocarrier CDs-RGD-Pt(IV)-PEG with tumor-triggered targeting property. (D) Schematic illustration of the drug delivery process using CDs-RGD-Pt(IV)-PEG. Adapted with permission from , copyright 2016 American Chemical Society.
Figure 11
Figure 11
CDs-based cancer therapy via drug delivery. (A) Schematic illustration for the preparation of drugs-loaded nanoassemblies of Pep-APCDs@Fe/DOX-LOS. (B) The transformation and enhanced antitumor immunity mechanism of Pep-APCDs@Fe/DOX-LOS. Adapted with permission from , copyright 2020 Wiley-VCH GmbH.
Figure 12
Figure 12
CDs-based cancer therapy via drug delivery. (A) Design and mechanism of MitoCAT-g to amplify oxidative stress in mitochondria and cause apoptotic cell death. (B) Schematic illustration of the synthesis process of CAT-g. (C) Schematic illustration of the establishment of the orthotopic PDX tumour model in NOD-SCID mice. (D) Scheme of the treatment schedule. (E) Effect of the different formulations on animal body weight. Adapted with permission from , copyright 2019 Springer Nature.
Figure 13
Figure 13
CDs-based cancer therapy by PTT. (A) Synthetic route of PPA. (B) Synthetic route of CDs. (C) The absorption of water-dispersible CDs. (D) Temperature elevation of pure water and the aqueous dispersion of CDs with different concentrations under laser irradiation. (E) Plot of temperature change over a period of 600 s versus the aqueous dispersion of CDs with different concentrations. Adapted with permission from , copyright 2015 WILEY-VCH Verlag GmbH & Co. KGaA, Weinheim. (F) Schematic illustration of the generation of proteasome inhibitor-encapsulated CuS/carbon dots nanocomposites (CuSCDB@MMT7). (G) Schematic illustration of the application of CuSCDB@MMT7 for enhanced PTT via heat-stabilization of various substrates in the ubiquitin-dependent proteasomal degradation pathway. Adapted with permission from , copyright 2020, American Chemical Society.
Figure 14
Figure 14
CDs-based cancer therapy by PDT. (A) Schematics of synthetic procedure of CDs and corresponding nucleolus-targeted photodynamic anticancer therapy. Adapted with permission from , copyright 2020 WILEY-VCH Verlag GmbH & Co. KGaA, Weinheim. (B) Schematic illustration of the Mn-CD assembly as an acidic H2O2-driven oxygenerator to enhance the anticancer efficiency of PDT in a solid tumor. Adapted with permission from , copyright 2018 American Chemical Society.
Figure 15
Figure 15
Structure of PCCN and schematic diagram of 630 nm light-driven water splitting enhanced PDT. Adapted with permission from , copyright 2016 American Chemical Society.
Figure 16
Figure 16
CDs-based cancer therapy by PDT with two-photon irradiation or CL. (A) Schematic illustration for the photo-triggered release of ALA from CD-ALA-TPP and the subsequent proapoptotic action on a cancer cell. Adapted with permission from , copyright 2015 WILEY-VCH Verlag GmbH & Co. KGaA, Weinheim. (B) Synthesis process of y-CDs and y-CDs-Ce6 conjugate. (C) Enhancement of therapeutic effect by optimization of CRET step to the PS in CL-induced y-CDs-Ce6 system. (D) Illustration of the PDT system in vivo. Adapted with permission from , copyright 2019 American Chemical Society.
Figure 17
Figure 17
CDs-based cancer therapy by simultaneous PTT and PDT. (A) Synthetic route of PBA and CDs WITH simultaneous PTT and PDT capability by polymerization to carbonization. Adapted with permission from , copyright 2015 WILEY-VCH Verlag GmbH & Co. KGaA, Weinheim. (B) Schematic illustration of starving and phototherapy mediated by γ-PGA@GOx@Mn,Cu-CDs NPs. Adapted with permission from , copyright 2020 Elsevier Ltd. (C) Illustration of the synthesis process of Cu/CC nanoassemblies. (H) Illustration of the features for enhancing tumor accumulation, TME stimuli-responses and synergistic therapy. Adapted with permission from , copyright 2020 Wiley-VCH GmbH.
Figure 18
Figure 18
CDs-based cancer therapy by NO-based phototherapeutic. (A) The schematic diagram of microenvironment-independent NO-based phototherapeutic nanoplatform. (B) NO generation in hypoxia and normoxia; (C) ESR spectra of g-C3N4 (with O2) and ArgCCN (with or without O2) under irradiation. (D) NO generation in the presence of various scavengers. (E) CLSM images of intracellular NO generation. (F) Fluorescence images of intracellular O2 content probe in MCF-7 cells treated with PBS only or CCN+laser, poly-L-arginine+laser, ArgCCN and ArgCCN+laser. Adapted with permission from , copyright 2020 Wiley-VCH GmbH.
Figure 19
Figure 19
CDs-based cancer therapy by cell metabolism effect. (A) Synthesis of chiral CDs by hydrothermal treatment of chiral cysteines. (B) PL excitation and emission spectrum of the L-CDs. (C) Circular dichroism spectra of the L-and D-CDs. (D) Basal Glycolysis from the extracellular acidification rate curves. (E) glycolytic capacity. Adapted with permission from , copyright 2018Wiley-VCH Verlag GmbH &Co. KGaA, Weinheim. (F) Schematic of the opposing CDs-concentration-dependent effects on tumor cell progression and metastasis. (g) Heatmap depicting changes in metabolite concentration between control and 50 µg mL-1 CDs-treated Mum2B cells (p < 0.05). Adapted with permission from , copyright 2021 Wiley-VCH GmbH.
Figure 20
Figure 20
CDs-based cancer therapy by boron neutron capture therapy. (A) The preparation of BCD-Exos. (B) The ability of BCDs for bioimaging in the normal mice model. (C) The in vivo bioimaging of U87-Luc transplanted mice model treated with saline as the control, BPA, and BCD-Exos after BNCT. (D) Survival curves after BNCT. (E) Gross images of mice brains and microscopic images of H&E-stained tumor sections in each group. Adapted with permission from , copyright 2021 Wiley-VCH GmbH.
Figure 21
Figure 21
CDs-based cancer therapy by DNA nanostructure. (A) The chemical route to synthesize NCDs. (B) NCDs-assisted DNA NP self-assembly. (C) Cellular uptake evaluation of NPNCD on KRAS-mutated NSCLC cell lines and CLSM imaging of NPNCD internalized by A549 and H23. (D) The formation of NPNCD showed by PAGE. (E) Self-assembly of NPNCD at various NCDs concentration. (F) NCDs-induced isothermal DNA NP self-assembly and corresponding formation of DNA NP at different temperature. (G) PAGE analysis of NPNCD formation under different pH values. (H) PAGE electrophoresis showing the serum stability of NPNCD and magnesium-assembled NP (NPMg). (I) PAGE analysis of the formation of CDs/NP conjugating with KRAS siRNA. Adapted with permission from , copyright 2020 WILEY-VCH Verlag GmbH & Co. KGaA, Weinheim.

Similar articles

Cited by

References

    1. Tricoli JV, Blair DG, Anders CK, Bleyer WA, Boardman LA, Khan J. et al. Biologic and clinical characteristics of adolescent and young adult cancers: Acute lymphoblastic leukemia, colorectal cancer, breast cancer, melanoma, and sarcoma. Cancer. 2016;122:1017–28. - PMC - PubMed
    1. Bray F, Ferlay J, Soerjomataram I, Siegel RL, Torre LA, Jemal A. Global cancer statistics 2018: GLOBOCAN estimates of incidence and mortality worldwide for 36 cancers in 185 countries. CA: a cancer journal for clinicians. 2018;68:394–424. - PubMed
    1. Hanahan D, Weinberg RA. Hallmarks of cancer: the next generation. Cell. 2011;144:646–74. - PubMed
    1. Ferrara N, Adamis AP. Ten years of anti-vascular endothelial growth factor therapy. Nat Rev Drug Discov. 2016;15:385–403. - PubMed
    1. De Palma M, Biziato D, Petrova TV. Microenvironmental regulation of tumour angiogenesis. Nat Rev Cancer. 2017;17:457–74. - PubMed

Publication types