Review
. 2022 Mar 21;12(6):2963-2986.
doi: 10.7150/thno.71064. eCollection 2022.

Emerging early diagnostic methods for acute kidney injury

Affiliations
Review

Emerging early diagnostic methods for acute kidney injury

Zuoxiu Xiao et al. Theranostics. .

Abstract

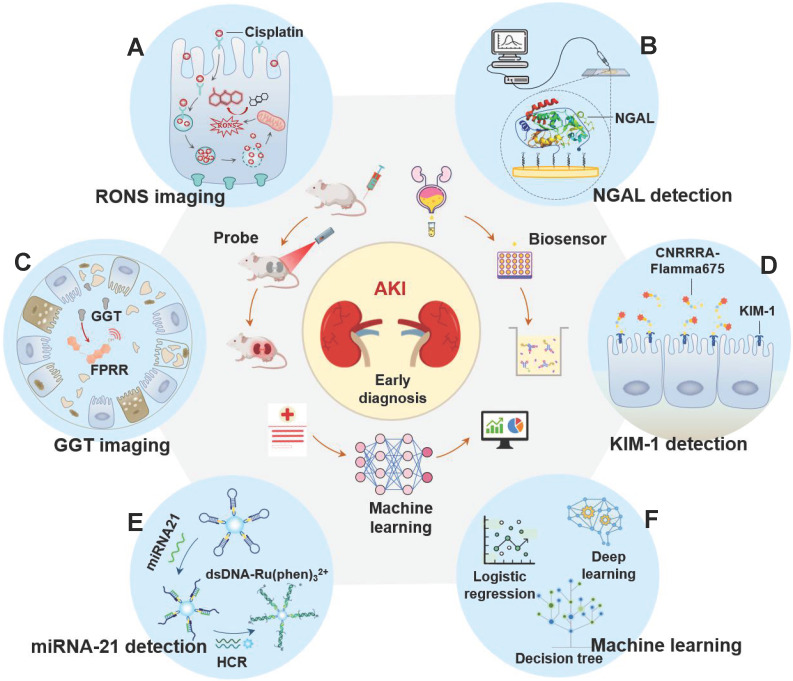
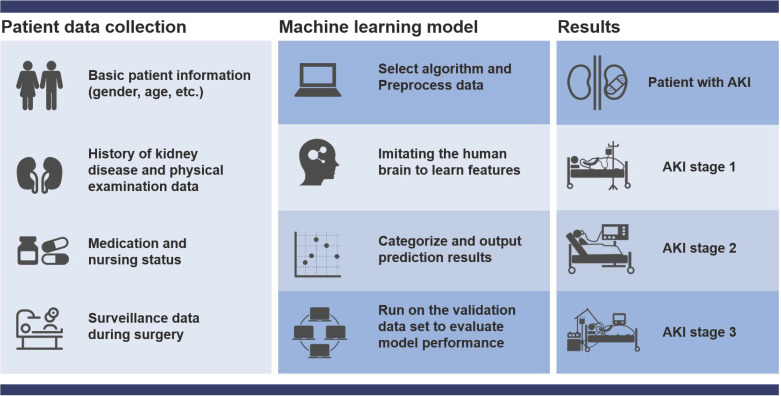
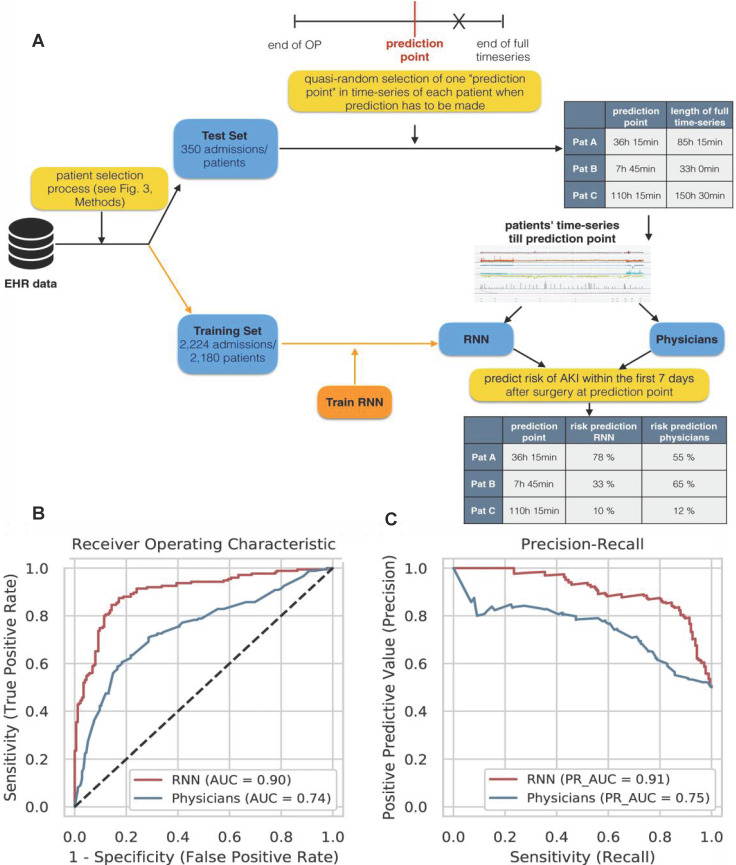
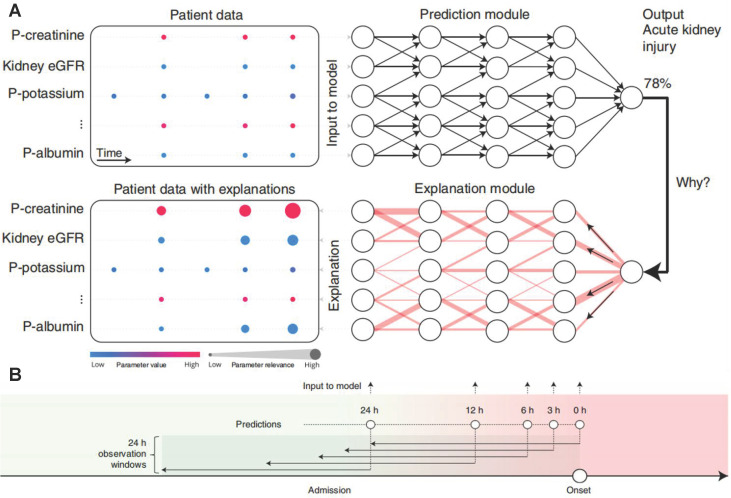
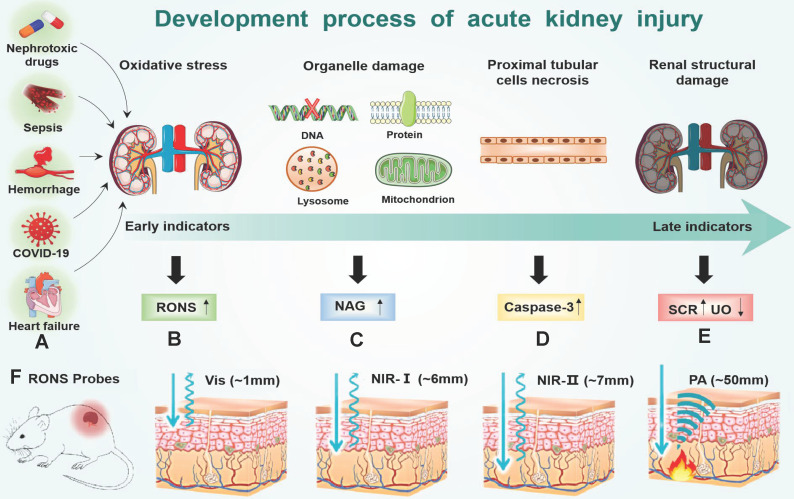
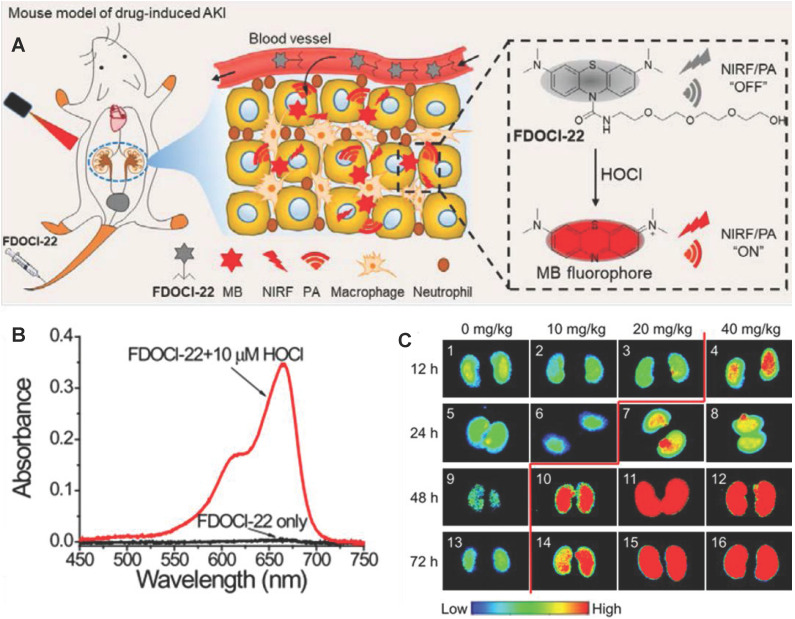
Many factors such as trauma and COVID-19 cause acute kidney injury (AKI). Late AKI have a very high incidence and mortality rate. Early diagnosis of AKI provides a critical therapeutic time window for AKI treatment to prevent progression to chronic renal failure. However, the current clinical detection based on creatinine and urine output isn't effective in diagnosing early AKI. In recent years, the early diagnosis of AKI has made great progress with the advancement of information technology, nanotechnology, and biomedicine. These emerging methods are mainly divided into two aspects: First, predicting AKI through models construct by machine learning; Second, early diagnosis of AKI through detection of newly-discovered early biomarkers. Currently, these methods have shown great potential and become an attractive tool for the early diagnosis of AKI. Therefore, it is very important to discuss and summarize these methods for the early diagnosis of AKI. In this review, we first systematically summarize the application of machine learning in AKI prediction algorithms and specific scenarios. In addition, we introduce the key role of early biomarkers in the progress of AKI, and then comprehensively summarize the application of emerging detection technologies for early AKI. Finally, we discuss current challenges and prospects of machine learning and biomarker detection. The review is expected to provide new insights for early diagnosis of AKI, and provided important inspiration for the design of early diagnosis of other major diseases.

Keywords: Acute kidney injury; Early diagnosis.; Machine learning; Neutrophil gelatinase-associated lipocalin; Reactive oxygen species and nitrogen species; kidney injury molecule-1; miRNA-21; γ-glutamyl transpeptidase.


Conflict of interest statement

Competing Interests: The authors have declared that no competing interest exists.

Figures

Figure 1
Figure 1
The latest applications of early diagnosis of AKI fall into three categories: optical probes imaging, biosensors and machine learning prediction models. The detected biomarkers involved are (A) RONS, (B) NGAL, (C) GGT, (D) KIM-1, and (E) miRNA21. (F) The algorithms involved in machine learning are logistic regression, deep learning, decision tree and so on.
Figure 2
Figure 2
Flow chart of machine learning to predict AKI. First collect basic data, then organize the data and select the most suitable algorithm for modeling, and then continue to test and verify the model until the output is reasonable. The prediction results include the probability of patients with various grades of AKI (stage 1-3).
Figure 3
Figure 3
(A) Preoperative hemodynamic parameters≦30 days after heart transplantation and their relationship with postoperative right heart failure and AKI. (B) ROC curves of the clinical model (green) and clinical model + PAPI (blue) in predicting stage 3 AKI. (C) ROC curves of the clinical model (green) and clinical model + RAP (red) in predicting stage 3 AKI. Adapted with permission from , copyright 2018
Figure 4
Figure 4
(A) AUC when using preoperative data, intraoperative data, and combined data. Adapted with permission from , copyright 2021 (B) Comparison of prediction performance of machine learning models. (C) Time period series feature acquisition. Adapted with permission from , copyright 2020
Figure 5
Figure 5
(A) Experimental design for comparing RNN model and doctor's prediction performance. (B) The ROC curve of the RNN model and the doctors. (C) RNN model and doctor's precision recall curve for predicting AKI. Adapted with permission from , copyright 2020
Figure 6
Figure 6
(A) Overview of XAI-EWS system. (B) The model was trained and evaluated at 0, 3, 6, 12 and 24 hours before the onset of AKI. Each model has a 24-hour retrospective observation window. The color gradation from green to red indicates continued deterioration to AKI. Adapted with permission from , copyright 2020
Figure 7
Figure 7
(A) Many factors (hemorrhage, heart failure, nephrotoxic drugs, sepsis and COVID-19) accumulate RONS burst in the early of AKI stage (B). RONS damages the lysosomal membranes of the proximal tubular cells, leading to an increase in the concentration of (C) NAG in the kidney. After the organelles are destroyed by RONS, the proximal tubular cells are necrotic, which leads to an increase in the concentration of (D) caspase-3 in the kidney and ultimately leads to the destruction of the metabolic function of the kidney, and changes of (E) SCR and UO. (F) Imaging depth of different RONS probes: visible light (~1mm) NIR-Ⅰ (~6mm) NIR-Ⅱ (~7mm) PA (~50mm).
Figure 8
Figure 8
(A) Structure of FDOCl-22 and its detection mechanism. (B) Absorption spectra of FDOCl-22 before and after adding HOCl (10 μM). (C) Fluorescent images of the kidney of a series of mice intraperitoneally injected with cisplatin of varying concentrations for different time periods and then intravenously injected with FDOCl-22 (200 μL × 0.5 mM) and average fluorescence intensity output of the groups (2.5 μM) to ONOO-(0-20 μM). Adapted with permission from , copyright 2020.
Figure 9
Figure 9
(A) A schematic illustration of the electrochemical sensor showing the principles of peptide sensors. Adapted with permission from , copyright 2019 (B) The EAB sensor uses aptamers combined with NGAL to induce folding to generate easily measurable, fast and reversible electrochemical signals, without the need for external reagents or washing steps, so as to achieve continuous and real-time molecular monitoring. (C) Monitor the NGAL concentration within 3 hours with a resolution of 3 minutes. Adapted with permission from , copyright 2020
Figure 10
Figure 10
(A) Schematic illustration of the steps involved in the organosilica-based biopreservation of bioconjugates to realize refreshable biosensors. (B) Extinction spectra corresponding to each step involved in the polymer encapsulation strategy of AuNRT-NGAL antibody bioconjugates. The inset shows zoomed-in spectra highlighting the shifts in the LSPR wavelength. (C) LSPR shift upon exposure of polymer-encapsulated AuNRT-NGAL antibody bioconjugates to different concentrations of NGAL before and after SDS treatment. (D) Retained biorecognition capability of biosensors with and without polymer encapsulation over multiple capture/release cycles of NGAL. Adapted with permission from , copyright 2020
Figure 11
Figure 11
(A) Timeline for development of cisplatin-induced AKI and bimodal imaging. (B) Representative NIRF images of living mice 60 min after intravenous injection. (C) Representative PA images of mice transverse section at 120 min after i.v. injection of FPRR in different treatment groups (700 nm). Adapted with permission from , copyright 2020 (D) Fluorescence spectra of MURs cocktail in the absence or presence of all three biomarkers GGT, AAP, and NAG. (E) Multiplex fluorescence images of human primary dermalfibroblasts (NDF) and kidney proximal tubule epithelial cells (HK-2) after incubation with MUR1-3. Adapted with permission from , copyright 2020
Figure 12
Figure 12
(A) Peptide-displaying phage clones selected through biopanning bind selectively to the recombinant KIM-1 protein. The binding efficiencies of the peptide-displaying phage clones (selected through biopanning) with KIM-1 recombinant protein were determined using ELISA. (B) In vivo imaging for the detection of drug-induced kidney damage using the labeled CNRRRA peptide. Adapted with permission from , copyright 2021 (C) Schematic illustration showing KIM-1 NF-assisted nephrotoxicity assessment. (D) Representative images showing aristolochic acid-treated, cisplatin-treated, and vehicle-treated tubuloids. Adapted with permission from , copyright 2021
Figure 13
Figure 13
Schematic diagram of constitution of MBs-DNA-Inv and mechanism for the detection of miRNA-21 based on PGM and dual signal amplification. Adapted with permission from , copyright 2020

Similar articles

Cited by

References

    1. Milasinovic D, Mladenovic DJ, Jelic D, Zobenica V, Zaharijev S, Vratonjic J. et al. Relative impact of acute heart failure and acute kidney injury on short- and long-term prognosis of patients with STEMI treated with primary PCI. Eur Heart J. 2021;42:1448. - PubMed
    1. Khruleva YY, Alekseeva M, Troitskaya E, Efremovtseva M, Kobalava Z. Acute decompensated heart failure is a risk factor for acute kidney injury and a predictor of disease severity in hospitalized patients with COVID-19. Eur J Heart Fail. 2021;23:193.
    1. Duan ZY, Cai GY, Li JJ, Chen XM. Cisplatin-induced renal toxicity in elderly people. Ther Adv Med Oncol. 2020;12:431428826. - PMC - PubMed
    1. Diao B, Wang CH, Wang RS, Feng ZQ, Zhang J, Yang H. et al. Human kidney is a target for novel severe acute respiratory syndrome coronavirus 2 infection. Nat Commun. 2021;12(1):2506. - PMC - PubMed
    1. Bajaj JS, Garcia-Tsao G, Reddy KR, O'Leary JG, Vargas HE, Lai JC. et al. Admission urinary and serum metabolites predict renal outcomes in hospitalized patients with cirrhosis. Hepatology. 2021;74(5):2699–713. - PMC - PubMed

Publication types