. 2022 Mar 6;12(6):2707-2721.
doi: 10.7150/thno.68437. eCollection 2022.

CD4+FoxP3+CD73+ regulatory T cell promotes cardiac healing post-myocardial infarction

Affiliations

CD4+FoxP3+CD73+ regulatory T cell promotes cardiac healing post-myocardial infarction

Rulin Zhuang et al. Theranostics. .

Abstract

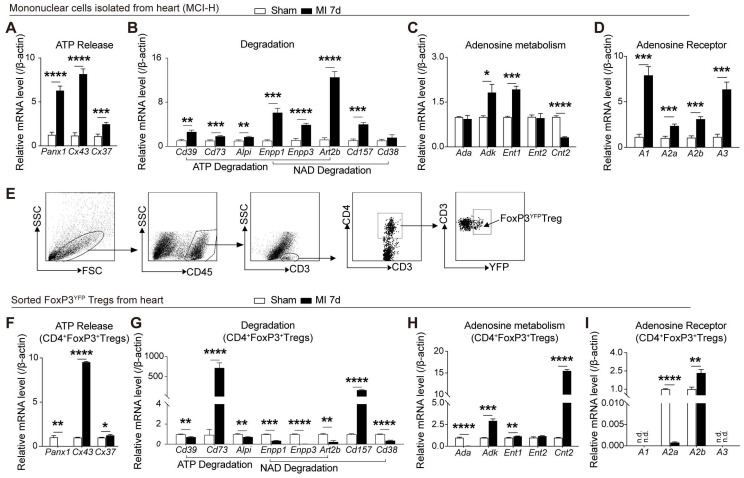
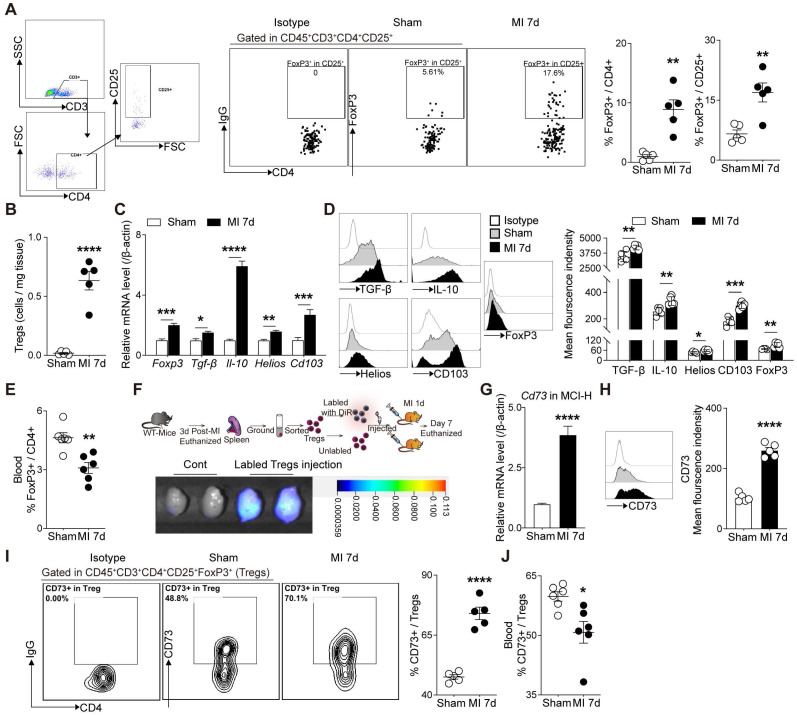
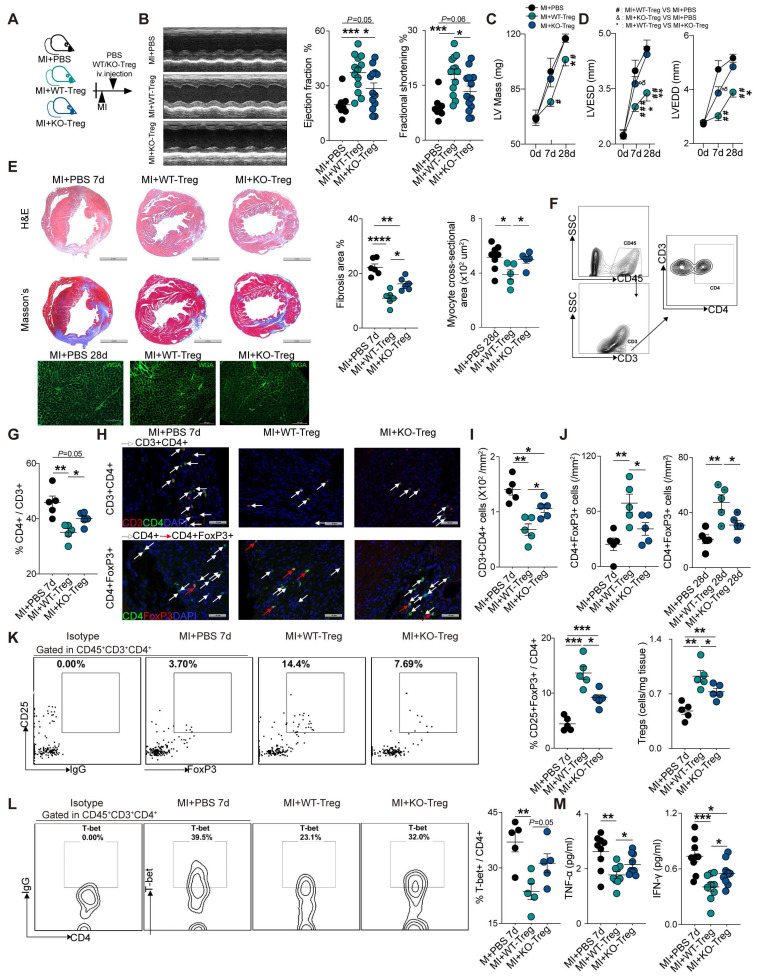
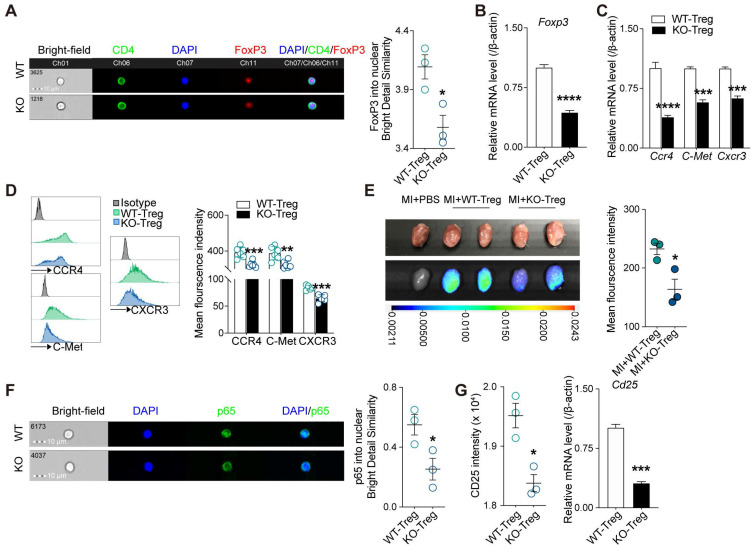
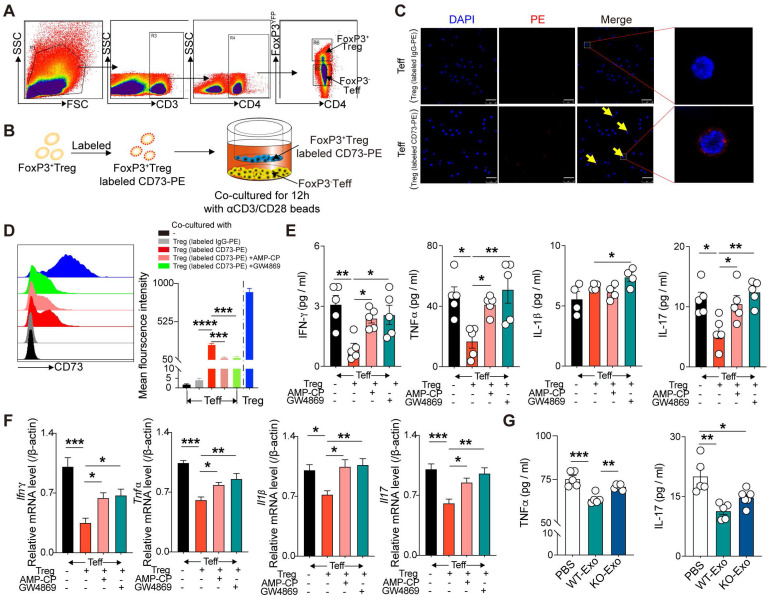
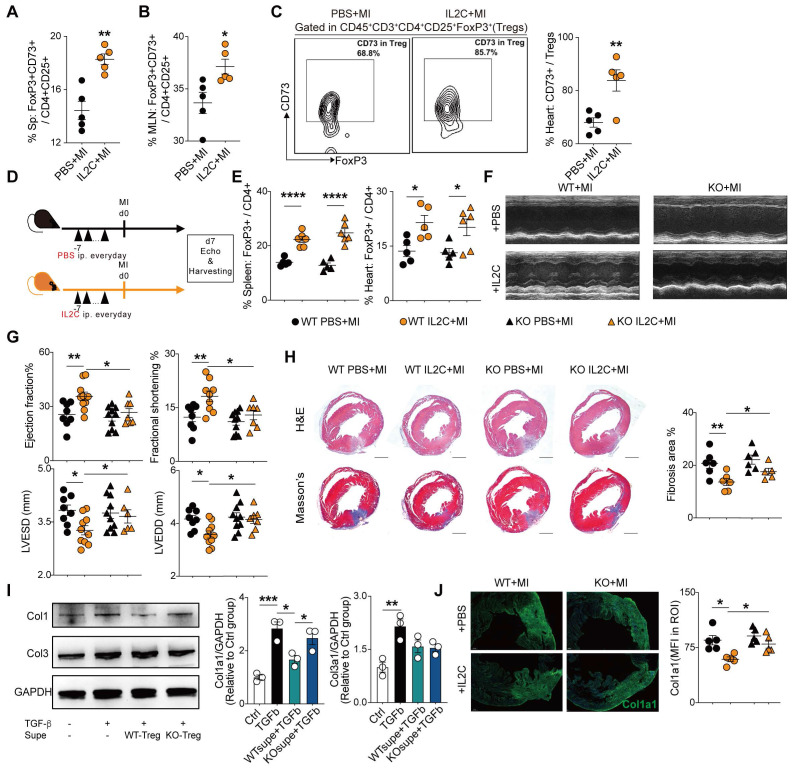
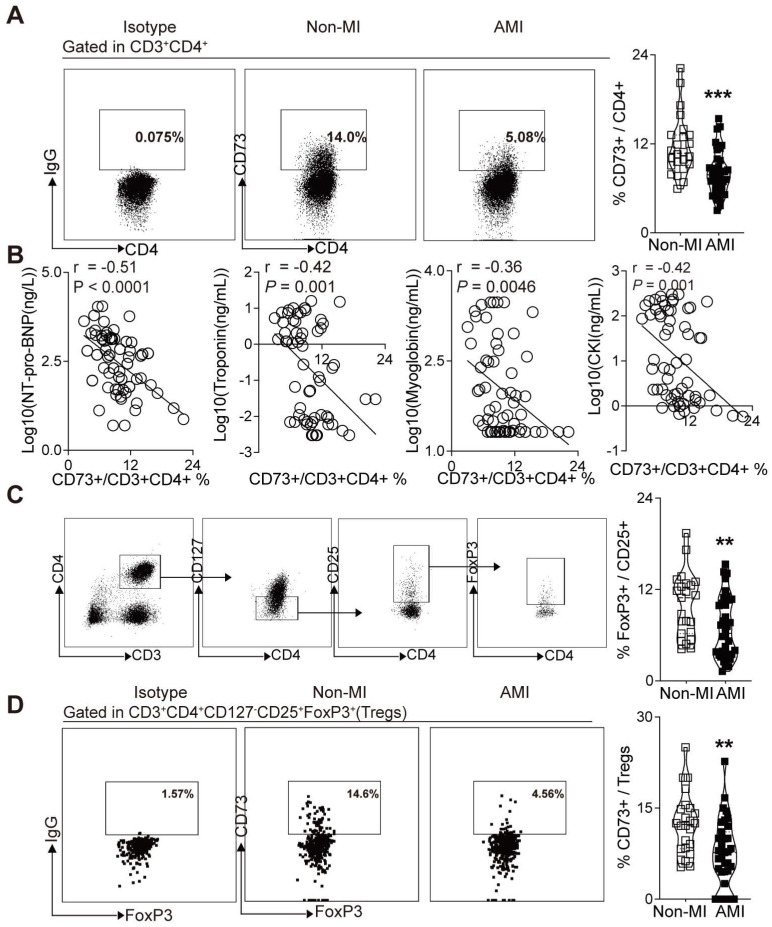
Rationale: Despite recent studies indicating a crucial role of ecto-5'-nucleotidase (CD73) on T cells in cardiac injury after ischemia/reperfusion, the involvement of CD73+ regulatory T cells (Tregs) in cardiac repair post-myocardial infarction (MI) remains unclear. We sought to investigate the contribution of CD73 on Tregs to the resolution of cardiac inflammation and remodeling after MI. Methods: Cardiac function, tissue injury, Tregs percentage in injured hearts, and purinergic signaling changes in cardiac FoxP3+ Tregs were analyzed after permanent descending coronary artery ligation. CD73 knockout Tregs were used to determine the function of CD73 on Tregs. Peripheral blood mononuclear cells (PBMCs) from acute myocardial infarction (AMI) patients and matched non-MI subjects were assessed via flow cytometry. Results: Cardiac Tregs exhibited distinction of purinergic signaling post MI with dramatically high level of CD73 compared to the sham Tregs. CD73 deficiency decreased the tissue tropism, and impaired the immunosuppressive and protective function of Tregs in cardiac healing. Administration of low-dose of IL-2/anti-IL-2 complex resulted in FoxP3+CD73+Tregs expansion in the heart and contributed to the recovery of cardiac function. CD73 derived from FoxP3+Tregs could bind to FoxP3- effector T-cells and inhibit the production of multiple inflammatory cytokines. In AMI patients, CD73 expressions on both CD4+ cells and FoxP3+Tregs decreased in PBMCs. Moreover, CD73 expressions on CD4+ T cells were negatively correlated with the levels of NT pro-BNP and myocardial zymogram in serum. Conclusions: Our findings indicated the importance of FoxP3+CD73+Tregs in inflammation resolution and cardiac healing post-MI.

Keywords: IL-2/anti-IL-2 complex; Regulatory T cells (Tregs); cardiac healing; ecto-5'-nucleotidase (CD73); myocardial infarction (MI).


Conflict of interest statement

Competing Interests: The authors have declared that no competing interest exists.

Figures

Figure 1
Figure 1
MI elicits the activation of the purinergic signaling cascade in cardiac mononuclear cells and Tregs. A-D, Mononuclear cells isolated from hearts (MCI-H) after digestion at 7-day post MI in sham and MI group, and the mRNA expression levels of factors related to ATP release (A), ATP and NAD degradation (B), adenosine metabolism (C) and adenosine receptor (D) in MCI-H, normalized to β-actin. E, Sorting strategy for CD45+CD3+CD4+FoxP3YFP cells (Tregs) in MCI-H from the murine heart. F-I, mRNA levels of factors related to ATP release (F), ATP and NAD degradation (G), adenosine metabolism (H) and adenosine receptor (I) in sorted FoxP3+Tregs from murine heart, normalized to β-actin. Sorted FoxP3+ Tregs and FoxP3- cells were sorted from the heart from 3-4 pooled MI mice and 5-6 pooled sham mice. Data are mean ± SEM. MCI-H indicates mononuclear cells isolated from hearts; ATP, adenosine triphosphate; NAD, nicotinamide adenine dinucleotide; n.d., not detected; Tregs, regulatory T cells. *P < 0.05, **P < 0.01, ***P < 0.001, **** P < 0.0001.
Figure 2
Figure 2
Tregs infiltrate into the injured heart and highly express CD73 post MI. A, Analysis strategy, representative flow cytometry dot plot and percentages of FoxP3+ in CD4+ cells in the heart (n = 5) and the percentages of FoxP3+ gated in CD4+CD25+ cells (n = 5). B, The number of Tregs in the heart (n = 5). C-D, FoxP3, TGF-β, IL-10, Helios and CD103 mRNA levels (C), representative flow cytometry histogram and mean fluorescence intensity in MCI-H post MI compared to the control (D). E, Percentage of FoxP3+ in CD4+ cells in the blood (n = 5). F, Schematic diagram of an in vivo experiment for cell tracing and the heart Imaging results of DiR-labeled CD4+CD25+ Tregs infusion. G-H, CD73 mRNA level (G), representative flow cytometry histogram and mean fluorescence intensity in MCI-H post MI compared to the control(H). I, Representative flow cytometry contour plot and the percentages of CD73 in CD45+CD3+CD4+CD25+FoxP3+ cells (Tregs) in the heart (n = 5). J, The percentage of CD73 in Tregs in the blood (n = 5). Data are mean ± SEM. MCI-H indicates mononuclear cells isolated from hearts; Tregs, regulatory T cells. *P < 0.05, **P < 0.01, ***P < 0.001, **** P < 0.0001.
Figure 3
Figure 3
CD73 deficiency impairs the protective function of Tregs in cardiac healing post-MI. A, Schematic diagram of an in vivo experiment for cell transfer experiments to compare the effect of CD73KO-Tregs with WT-Tregs post-MI. B-D, representative images, ejection fraction and fractional shortening (B), LV Mass (C) and LVESD/LVEDD (D) by echocardiography in MI+PBS, MI+WT-Tregs and MI+CD73KO-Tregs transferred mice (n>5 in each group). E, Representative image of H&E, Masson staining, the percentage of fibrosis area (n = 6, Scale bars: 2 mm), and myocyte cross-sectional area by wheat germ agglutinin (WGA) staining (n≥5, Scale bars: 100 µm). F-G, Analysis strategy and the percentage of CD4+ in CD45+CD3+ cells in MCI-H after administration (n = 5). H-J, Representative Immunofluorescence staining, and the number of CD3+CD4+ T cells and CD4+FoxP3+ Tregs in the peri-infarct areas of heart (n = 5) in each group. Scale bars: 50 µm. White arrows represent CD4+ cells and red arrows represent CD4+FoxP3+ cells. K, Representative flow cytometry dot plot and percentages of CD25+FoxP3+ in CD45+CD3+CD4+ cells in MCI-H after administration (n = 5) in each group, and the number of Tregs in the heart (n = 5). L, Representative flow cytometry contour and percentages of T-bet+ in CD45+CD3+CD4+ cells in MCI-H isolated from each group mice (n = 5). M, The protein levels of TNF-α and IFN-γ in the peri-infarct areas of heart tissue (n = 9). Data are mean ± SEM. LVESD indicates left ventricular end-systolic diameter: LVEDD, left ventricular end-diastolic diameter; Tregs, regulatory T cells. *P < 0.05, **P < 0.01, ***P < 0.001; **** P < 0.0001; C-D, #, MI+WT-Treg group compared with MI+PBS group; *, MI+WT-Treg group compared with MI+KO-Treg group; &, MI+KO-Treg group compared with MI+PBS group.
Figure 4
Figure 4
Deficiency of CD73 in Tregs displays decreased tissue tropism and immunosuppressive function. CD4+CD25+ Tregs were sorted from spleen in WT and CD73 KO mice. A, Representative ImageStream pictures (left) and mean similarity scores (right) for the colocalization of FoxP3 and DAPI in WT/KO CD4+CD25+ Tregs under basal conditions. B, FoxP3 mRNA level in WT/KO CD4+CD25+ Tregs. C-D, CCR4, C-Met, CXCR3 mRNA level (C) and representative flow cytometry histogram and mean fluorescence intensity (D) in WT/KO CD4+CD25+ Tregs. E, Imaging results of labeled CD4+CD25+ Tregs infusion and tracing after perfusing. F, Representative ImageStream pictures (left) and mean similarity scores (right) for the colocalization of P65 and DAPI in WT/KO CD4+CD25+ Tregs under basal conditions. G, the intensity of CD25 and the mRNA level of Cd25 in WT/CD73KO CD4+CD25+ Tregs. Tregs indicates regulatory T cells. Data are mean ± SEM. *P < 0.05, **P < 0.01, ***P < 0.001, ****P < 0.0001. A, E, and F, n = 3 independent experiments.
Figure 5
Figure 5
CD73 derived from CD3+CD4+FoxP3+Treg cells can bind CD4+FoxP3- Teff cells and inhibit the inflammatory response of T effectors. A, sorting strategy for CD3+CD4+CD25+FoxP3YFP cells sorted from splenetic single cell suspension in FoxP3-YFP mice. B, Schematic diagram of an in vitro co-cultured experiment to investigate the interaction between FoxP3+Treg and FoxP3-Teff. C, CD73 banded on the surface of Teffs cells by confocal microscopy. Scale bars: 25μm. D, Representative flow cytometry histogram and mean fluorescence intensity of CD73 in different treated Teffs or Tregs. E-F, Quantification of IL-1β, TNF-α, IFN-γ, and IL-17 secreted protein level (E) and mRNA level (F) of Teffs after co-cultured. G, Quantification of TNF-α and IL-17 secreted protein level of Teffs after treatment with WT/KO-Tregs derived-exosomes. Data are mean ± SEM. GW4689, an inhibitor of exosome biogenesis/release; Tregs, regulatory T cells; Teff, effector T-cell. *P < 0.05, **P < 0.01, ***P < 0.001, ****P < 0.0001.
Figure 6
Figure 6
Administration of low-dose of IL-2/anti-IL-2 complex resulted in FoxP3+CD73+ Tregs expansion in the heart and contributed to the recovery of cardiac function. A-B, Percentages of FoxP3+CD73+ cells in CD4+CD25+ cells in Spleen (A) and in MLN (B) (n = 5). C, Representative flow cytometry contour plot and percentages of CD73+ gated in CD45+CD3+CD4+CD25+FoxP3+ cells (Tregs) in the heart (n = 5). D, Schematic diagram of in vivo experiment. E, The percentage of FoxP3+ cell gated on CD4+ cell in spleen and heart after IL2C treatment(n>5 in each group). F-G, representative images, ejection fraction, fractional shortening, LVESD, and LVEDD at day 7 post-MI by echocardiography in IL2C treated WT/KO mice (n>6 in each group). H, Representative image of H&E, Masson staining, the percentage of fibrosis area (n>5, scale bars: 1mm). I, the protein level of Col1a1, Col3a1 in cardiac fibroblasts with/without WT/KO-Treg Supe treatment. J, Representative Immunofluorescence staining, and mean fluorescence intensity of Col1a1 in the injured areas of heart (n = 5) in each group. Scale bars: 200 µm. IL2C indicates IL-2/anti-IL-2 complex; Sp, Spleen; MLN, mediastinal lymph nodes; mean fluorescence intensity, MFI; ROI: Region of interest; Tregs, regulatory T cells. *P < 0.05, **P < 0.01, ***P < 0.001, ****P < 0.0001.
Figure 7
Figure 7
Decreased expression of CD73 on CD4+ T cells and Tregs in PBMCs is associated with increased percentage of AMI. A, Representative flow cytometry dot plots and percentage of CD73+ gated in CD3+CD4+ T cells in PBMC from AMI and non-MI patients. B, Correlation analysis of the NT pro-BNP, Troponin, Myoglobin, CKI levels and the ratio of CD73+ in CD3+CD4+ cells in PBMC from AMI and non-MI patients. Line represents linear regression of data. Sites with coefficients, and P values inside plots. C-D, Analysis strategy, representative flow cytometry dot plots and percentage of positive cells in PBMC from AMI and non-MI patients, for FoxP3+ in CD3+CD4+CD127-CD25+ cells subsets (C) and for CD73+ on CD3+CD4+CD127-CD25+FoxP3+ cells (Tregs) (D). Data are mean ± SEM. AMI indicates acute myocardial infarction; PBMC, peripheral blood mononuclear cell; NT pro-BNP, N-terminal pro-brain natriuretic peptide; CKI, creatine kinase isoenzyme; Tregs, regulatory T cells; OR odds ratio. **P < 0.01; ***P < 0.001.

Similar articles

Cited by

References

    1. Swirski FK, Nahrendorf M. Leukocyte behavior in atherosclerosis, myocardial infarction, and heart failure. Science. 2013;339:161–6. - PMC - PubMed
    1. Kallikourdis M, Martini E, Carullo P, Sardi C, Roselli G, Greco CM. et al. T cell costimulation blockade blunts pressure overload-induced heart failure. Nat Commun. 2017;8:14680. - PMC - PubMed
    1. Nevers T, Salvador AM, Grodecki-Pena A, Knapp A, Velázquez F, Aronovitz M. et al. Left Ventricular T-Cell Recruitment Contributes to the Pathogenesis of Heart Failure. Circ Heart Fail. 2015;8:776–87. - PMC - PubMed
    1. Li J, Liang C, Yang KY, Huang X, Han MY, Li X. et al. Specific ablation of CD4(+) T-cells promotes heart regeneration in juvenile mice. Theranostics. 2020;10:8018–35. - PMC - PubMed
    1. Bansal SS, Ismahil MA, Goel M, Patel B, Hamid T, Rokosh G. et al. Activated T Lymphocytes are Essential Drivers of Pathological Remodeling in Ischemic Heart Failure. Circ Heart Fail. 2017;10:e003688. - PMC - PubMed

Publication types

MeSH terms