. 2022 Jan 27;15(2):175-191.
doi: 10.1007/s12195-021-00715-7. eCollection 2022 Apr.

Effects of Pregnancy-Specific Glycoproteins on Trophoblast Motility in Three-Dimensional Gelatin Hydrogels

Affiliations

Effects of Pregnancy-Specific Glycoproteins on Trophoblast Motility in Three-Dimensional Gelatin Hydrogels

Samantha G Zambuto et al. Cell Mol Bioeng. .

Abstract

Introduction: Trophoblast invasion is a complex biological process necessary for establishment of pregnancy; however, much remains unknown regarding what signaling factors coordinate the extent of invasion. Pregnancy-specific glycoproteins (PSGs) are some of the most abundant circulating trophoblastic proteins in maternal blood during human pregnancy, with maternal serum concentrations rising to as high as 200-400 μg/mL at term.

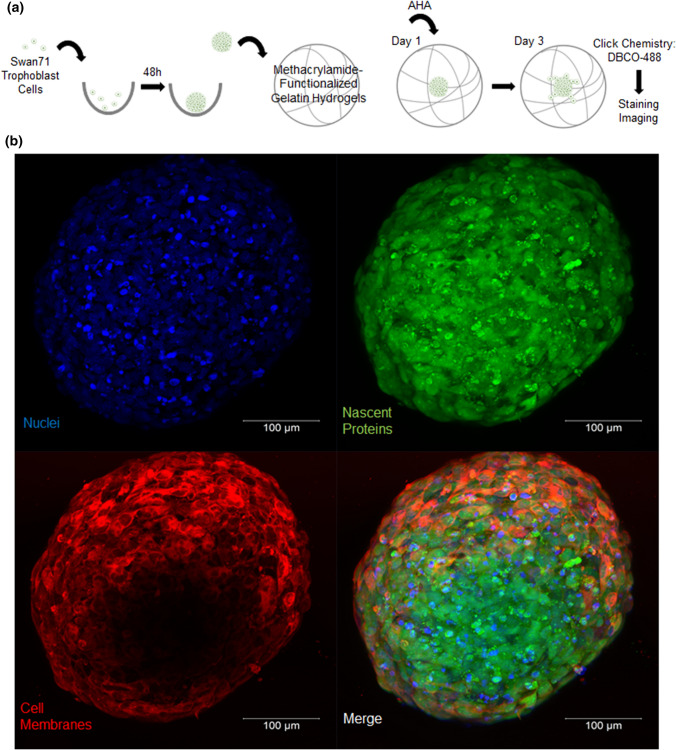
Methods: Here, we employ three-dimensional (3D) trophoblast motility assays consisting of trophoblast spheroids encapsulated in 3D gelatin hydrogels to quantify trophoblast outgrowth area, viability, and cytotoxicity in the presence of PSG1 and PSG9 as well as epidermal growth factor and Nodal.

Results: We show PSG9 reduces trophoblast motility whereas PSG1 increases motility. Further, we assess bulk nascent protein production by encapsulated spheroids to highlight the potential of this approach to assess trophoblast response (motility, remodeling) to soluble factors and extracellular matrix cues.

Conclusions: Such models provide an important platform to develop a deeper understanding of early pregnancy.

Keywords: Biomaterials; Pregnancy; Proteins; Tissue engineering.


Figures

Figure 1
Figure 1
Three-Dimensional Swan71 Trophoblast Spheroid Assays. (a) Representative bright field images of Swan71 spheroids (2000, 4000, and 6000 cells/spheroid). Scale bar, 200 μm. (b) Average spheroid diameter in round bottom plates. Data are displayed as individual data points. Bar represents mean ± standard deviation. One-way ANOVA with Tukey post hoc analysis, ****p < 0.0001 (n = 5 technical replicates per group). (c) Average spheroid area in round bottom plates. Data are displayed as individual data points. Bar represents mean ± standard deviation. One-way ANOVA with Tukey post hoc analysis, **p < 0.01, ****p < 0.0001 (n = 5 technical replicates per group). (d) Schematic of experimental procedure. (e) Representative maximum intensity projection of encapsulated Swan71 spheroid on day 1 of culture. Scale bar, 100 μm. (f) Representative maximum intensity projection of encapsulated Swan71 spheroid on day 3 of culture. Scale bar, 100 μm.
Figure 2
Figure 2
Matrix Remodeling by Encapsulated Swan71 Spheroids. (a) Schematic of experimental procedure. The methionine analog azidohomoalanine (AHA) was added to spheroids on day 1 of culture and replaced daily. On day 3, a click chemistry reaction was performed using DBCO-488, a fluorophore-conjugated cyclooctyne, to visualize nascent proteins. Staining was performed after the click chemistry reaction to visualize cells. (b) Representative maximum intensity projection of encapsulated Swan71 spheroid on day 3 of culture stained for bulk nascent protein production.
Figure 3
Figure 3
Invasion Pattern Analysis After the Addition of Exogenous Growth Factors Epidermal Growth Factor (EGF) and Nodal to Spheroids Encapsulated in Methacrylamide-Functionalized Gelatin (GelMA) Hydrogels. (a) Representative bright field images of 4000 cell spheroids encapsulated in GelMA hydrogels from day 0 (seeding) to day 3 for control and after addition of 5 ng/mL EGF or 250 ng/mL Nodal. Scale bar, 200 μm. (b) Average spheroid outgrowth area in GelMA hydrogels over 3 days. Data are displayed as individual data points. Bar represents mean ± standard deviation. Data were analyzed on each day between groups (Control n = 7 technical replicates, EGF n = 6 technical replicates, Nodal n = 7 technical replicates). Day 0: One-way ANOVA with Tukey post hoc analysis, ***p < 0.001, ****p < 0.0001. Day 1: One-way ANOVA with Tukey post hoc analysis. Day 2: Kruskal-Wallis with Dunn’s post hoc analysis, *p < 0.05, **p < 0.01. Day 3: One-way ANOVA, ****p < 0.0001. (c) Spheroid outgrowth area fold change compared to initial area (day 0) over 3 days. Data are displayed as individual data points. Bar represents mean ± standard deviation. Data were analyzed on each day between groups (Control n = 7 technical replicates, EGF n = 6 technical replicates, Nodal n = 7 technical replicates). Day 1: One-way ANOVA with Tukey post hoc analysis, *p < 0.05. Day 2: Welch’s heteroscedastic F Test with Trimmed Means and Winsorized Variances with Games-Howell post hoc analysis, **p < 0.01. Day 3: One-way ANOVA with Tukey post hoc analysis, ****p < 0.0001. (d) Relative viability of encapsulated spheroids at day 3 from CellTiter-Glo® 3D Viability Assay. Data are presented as individual data points overlaying box plots with the median denoted by a line, mean denoted by a square, and whiskers represent the mean ± standard deviation. Welch’s ANOVA with Games-Howell post hoc analysis, *p < 0.05, Control n = 7 technical replicates, EGF n = 6 technical replicates, Nodal n = 7 technical replicates. (e) Relative cytotoxicity of encapsulated spheroids at day 3 from measured from lactate dehydrogenase release via LDH-Glo® Cytotoxicity Assay. Data are presented as individual data points overlaying box plots with the median denoted by a line, mean denoted by a square, and whiskers represent the mean ± standard deviation. One-way ANOVA with Tukey post hoc analysis, Control n = 7 technical replicates, EGF n = 5 technical replicates, Nodal n = 7 technical replicates.
Figure 4
Figure 4
PSG9-Fc Inhibits Swan71 Spheroid Invasion in Methacrylamide-Functionalized Gelatin (GelMA) Hydrogels. (a) Representative bright field images of 4000 cell spheroids encapsulated in GelMA hydrogels from day 0 (seeding) to day 3 for Control samples, Fc-Control samples (60 μg/mL), and PSG9-Fc samples (60 μg/mL). Scale bar, 200 μm. (b) Average spheroid outgrowth area in GelMA hydrogels over 3 days. Data are displayed as individual data points. Bar represents mean ± standard deviation. Data were analyzed on each day between groups (Control n = 8 technical replicates, Fc-control n = 8 technical replicates, PSG9-Fc n = 8 technical replicates). Day 0: One-way ANOVA. Day 1: Kruskal-Wallis ANOVA. Day 2: One-way ANOVA. Day 3: One-way ANOVA with Tukey post hoc analysis, *p < 0.05, **p < 0.01, ****p < 0.0001. (c) Spheroid outgrowth area fold change compared to initial area (day 0) over 3 days. Data are displayed as individual data points. Bar represents mean ± standard deviation. Data were analyzed on each day between groups (Control n = 8 technical replicates, Fc-control n = 8 technical replicates, PSG9-Fc n = 8 technical replicates). Day 1: Kruskal-Wallis ANOVA with Dunn’s post hoc analysis, *p <0.05. Day 2: Kruskal-Wallis ANOVA. Day 3: One-way ANOVA with Tukey post hoc analysis, **p < 0.01, ****p < 0.0001. (D) Relative viability of encapsulated spheroids at day 3 from CellTiter-Glo® 3D Viability Assay. Data are presented as individual data points overlaying box plots with the median denoted by a line, mean denoted by a square, and whiskers represent the mean ± standard deviation. One-way ANOVA. Control n = 8 technical replicates, Fc-control n = 8 technical replicates, PSG9-Fc n = 8 technical replicates. (e) Relative cytotoxicity of encapsulated spheroids at day 3 measured from lactate dehydrogenase release via LDH-Glo® Cytotoxicity Assay. Data are presented as individual data points overlaying box plots with the median denoted by a line, mean denoted by a square, and whiskers represent the mean ± standard deviation. One-way ANOVA with Tukey post hoc analysis. Control n = 8 technical replicates, Fc-control n = 8 technical replicates, PSG9-Fc n = 8 technical replicates; **p < 0.01.
Figure 5
Figure 5
Invasion Pattern Analysis After the Addition of PSG1-Fc and PSG1-His to Swan71 Spheroids Encapsulated in Methacrylamide-Functionalized Gelatin (GelMA) Hydrogels. (a) Representative bright field images of 4000 cell spheroids encapsulated in GelMA hydrogels from day 1 to day 3 for Control samples, Fc-Control samples (60 μg/mL), PSG1-His samples (60 μg/ml), and PSG1-Fc samples (60 μg/mL). Scale bar, 200 μm. (b) Average spheroid outgrowth area in GelMA hydrogels over 3 days. Data are displayed as individual data points. Bar represents mean ± standard deviation. Data were analyzed on each day between groups (Control n = 6 technical replicates, Fc-Control (Fc) n = 5 technical replicates, PSG1-His (1-His) n = 5 technical replicates, and PSG1-Fc (1-Fc) n = 6 technical replicates). Day 0, 1: One-way ANOVA. Day 2: One-way ANOVA with Tukey post hoc analysis, *p < 0.05, ***p < 0.001. Day 3: Welch’s ANOVA with Games-Howell post hoc analysis, *p < 0.05. (c) Spheroid outgrowth area fold change compared to initial area (day 0) over 3 days. Data are displayed as individual data points. Bar represents mean ± standard deviation. Data were analyzed on each day between groups (Control n = 6 technical replicates, Fc-Control (Fc) n = 5 technical replicates, PSG1-His (1-His) n = 5 technical replicates, and PSG1-Fc (1-Fc) n = 6 technical replicates). Day 1: Kruskal-Wallis ANOVA. Day 2: One-way ANOVA with Tukey post hoc analysis, **p < 0.01. Day 3: One-way ANOVA. (d) Relative viability of encapsulated spheroids at day 3 from CellTiter-Glo® 3D Viability Assay. Data are presented as individual data points overlaying box plots with the median denoted by a line, mean denoted by a square, and whiskers represent the mean ± standard deviation. One-way ANOVA. Control n = 6 technical replicates, Fc-Control (Fc) n = 5 technical replicates, PSG1-His n = 5 technical replicates, and PSG1-Fc n = 6 technical replicates. (e) Relative cytotoxicity of encapsulated spheroids at day 3 from measured from lactate dehydrogenase release via LDH-Glo® Cytotoxicity Assay. Data are presented as individual data points overlaying box plots with the median denoted by a line, mean denoted by a square, and whiskers represent the mean ± standard deviation. One-way ANOVA with Tukey post hoc analysis. Control n = 6 technical replicates, Fc-Control (Fc) n = 5 technical replicates, PSG1-His n = 5 technical replicates, and PSG1-Fc n = 6 technical replicates, **p < 0.01.

Similar articles

Cited by

References

    1. Aisenbrey EA, Murphy WL. Synthetic alternatives to Matrigel. Nat. Rev. Mater. 2020;5:539–551. - PMC - PubMed
    1. Ballesteros A, Mentink-Kane MM, Warren J, Kaplan GG, Dveksler GS. Induction and activation of latent transforming growth factor-beta1 are carried out by two distinct domains of pregnancy-specific glycoprotein 1 (PSG1) J. Biol. Chem. 2015;290:4422–4431. - PMC - PubMed
    1. Blankley RT, Fisher C, Westwood M, North R, Baker PN, Walker MJ, Williamson A, Whetton AD, Lin W, McCowan L, Roberts CT, Cooper GJ, Unwin RD, Myers JE. A label-free SRM workflow identifies a subset of pregnancy specific glycoproteins as potential predictive markers of early-onset pre-eclampsia. Mol. Cell Proteom. 2013;12:3148–3159. - PMC - PubMed
    1. Blois SM, Sulkowski G, Tirado-Gonzalez I, Warren J, Freitag N, Klapp BF, Rifkin D, Fuss I, Strober W, Dveksler GS. Pregnancy-specific glycoprotein 1 (PSG1) activates TGF-beta and prevents dextran sodium sulfate (DSS)-induced colitis in mice. Mucosal. Immunol. 2014;7:348–358. - PMC - PubMed
    1. Bopp SK, Lettieri T. Comparison of four different colorimetric and fluorometric cytotoxicity assays in a zebrafish liver cell line. BMC Pharmacol. 2008;8:8. - PMC - PubMed

LinkOut - more resources