. 2022 Apr;16(2):283-296.
doi: 10.1007/s11571-021-09708-8. Epub 2021 Sep 8.

Multimodal cortico-cortical associations induced by fear and sensory conditioning in the guinea pig

Affiliations

Multimodal cortico-cortical associations induced by fear and sensory conditioning in the guinea pig

Gennosuke Tasaka et al. Cogn Neurodyn. 2022 Apr.

Abstract

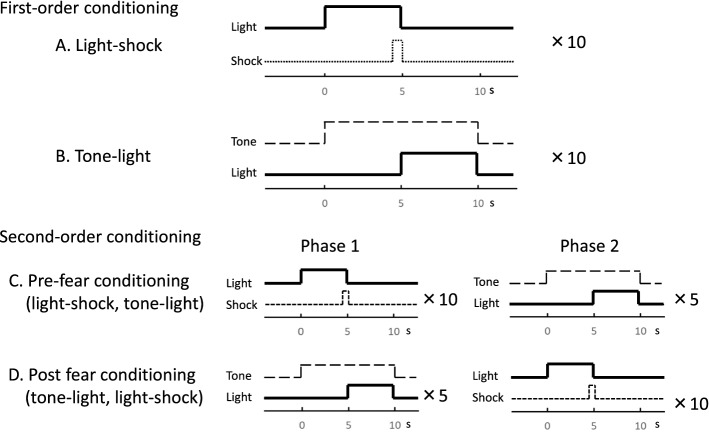
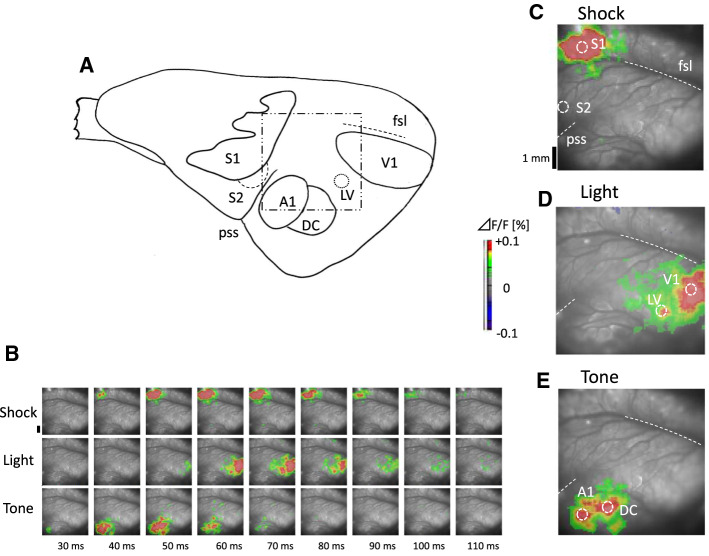
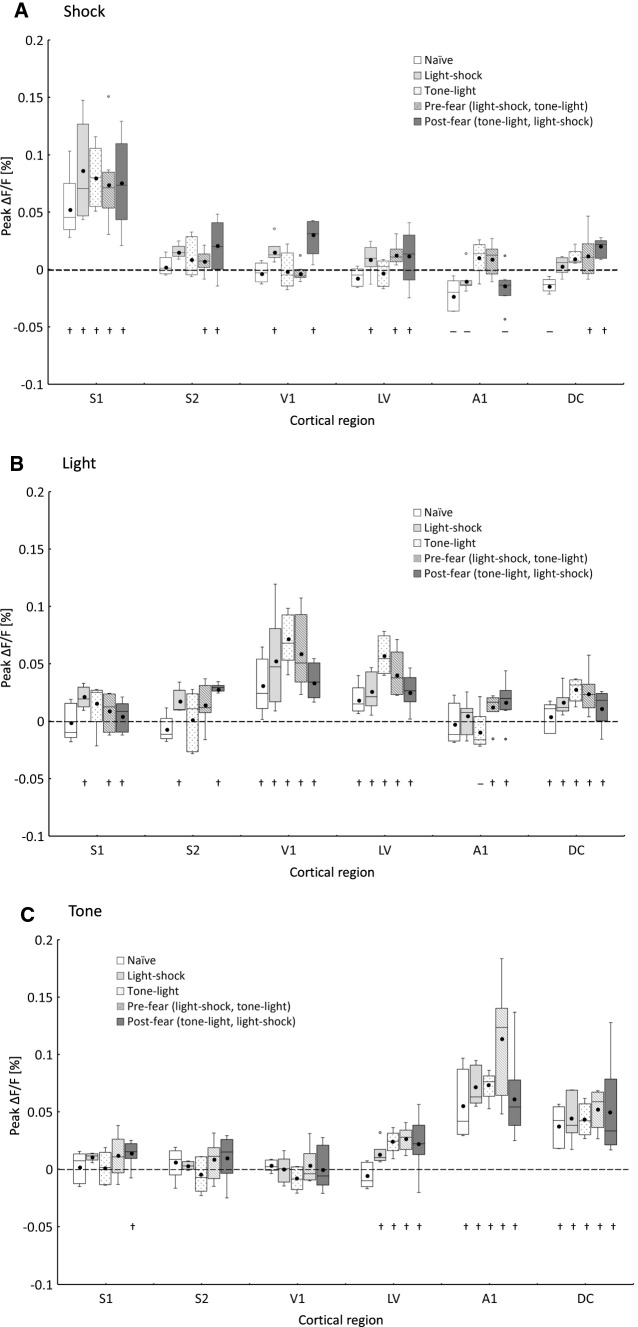
Sensory cortices are defined by responses to physical stimulation in specific modalities. Recently, additional associatively induced responses have been reported for stimuli other than the main specific modality for each cortex in the human and mammalian brain. In this study, to investigate a type of consolidation, associative responses in the guinea pig cortices (auditory, visual, and somatosensory) were simultaneously measured using optical imaging after first- or second-order conditioning comprising foot shock as an aversive stimulus and tone and light as sensory stimuli. Our findings indicated that (1) after the first- and second-order conditioning, associative responses in each cortical area were additionally induced to stimulate the other specific modality; (2) an associative response to sensory conditioning with tone and light was also seen as a change in the response at the neuronal level without behavioral phenomena; and (3) when fear conditioning with light and foot shock was applied before sensory conditioning with tone and light, the associative response to foot shock in the primary visual cortex (V1) was decreased (extinction) compared with the response after the first-order fear conditioning, whereas the associative response was increased (facilitation) for fear conditioning after sensory conditioning. Our results suggest that various types of bottom-up information are consolidated as associative responses induced in the cortices, which are traced repetitively or alternatively by a change in plasticity involving facilitation and extinction in the cortical network. This information-combining process of cortical responses may play a crucial role in the dynamic linking of memory in the brain.

Keywords: Associative response; Guinea pig; Higher-order conditioning; Optical imaging; Sensory cortex.


Figures

Fig. 1
Fig. 1
Protocol of conditioning paradigms using light, tone, and foot shock and of test sessions. A Light-shock: first-order conditioning, pairing of light (white LED, 5 s) and electric foot shock (0.7 mA, 0.5 s). B Tone-light: pairing of tone (8 kHz, 10 s) and light (white LED, 5 s). C Pre-fear conditioning: second-order conditioning comprising Light-shock preceding Tone-light. D Post-fear conditioning: second-order conditioning comprising Light-shock following Tone-Light
Fig. 2
Fig. 2
A schematic diagram of the cortical area and responses in the guinea pig. A A schematic diagram of the cortical area including the somatosensory cortices (S1 and S2), visual cortices (V1 and LV), and auditory cortices (A1 and DC). The square with the dotted and dashed line indicates the recording area for optical imaging (1 × 1 cm). The map shows the location of each cortex, in reference to Wallace et al. (2000). B Cortical activations in response to foot shock (upper), light (middle), and tone (lower) in the naïve guinea pig. The pseudocolor version of each image was superimposed on the cortical surface with the color corresponding to ΔF/F defined by the color bar. C Normal activity in response to foot shock in the primary (S1) and secondary (S2) somatosensory cortices corresponding to 46 ms in the upper figures of A. The scale bar on the left side is 1 mm. fsl, fissura sagittalis lateralis (lateral sulcus); pss, pseudosylvian sulcus. D Normal activity in the primary (V1) and secondary (LV) visual cortices 62 ms from the start of the light stimulus in the middle images of A. E Normal activity in the auditory cortices (A1 and DC) 46 ms from the start of the tone stimulus in the lower images of (A). The responses depicted in C-E are shown with a suitable time delay to discriminate the respective responses in each sensory area
Fig. 3
Fig. 3
Heart rate changes in guinea pigs during conditioning. A Heart rate change in Light-shock conditioning (n = 11) in phase 1 of Pre-fear conditioning. B Heart rate change in Tone-light conditioning in phase 2 of Pre-fear conditioning (n = 8). C Heart rate change in Tone-light conditioning (n = 6) in phase 1 of Post-fear conditionig. D Heart rate change in Light-shock conditioning in phase 2 of Post-fear conditioning (n = 8). The change in the mean R-R interval from the resting state to immediately before stimulation for each trial during the condition compared with that before conditioning was measured. Gray dots with lines represent the mean of the data for each trial from individual guinea pigs. The error bar is SEM. (*) P < 0.05, (**) P < 0.01. P values were obtained using the Bonferroni multiple comparison test
Fig. 4
Fig. 4
Single and Average responses of the ΔF/F to the three stimuli (foot shock, light, tone) after conditioning. Time courses of responses in the ROI induced by each type of conditioning. A Naïve (n = 5). B Light-shock (n = 6). C Tone-light (n = 5). D Pre-fear conditioning (n = 8). E Post-fear conditioning. (n = 8). The gray traces show single response and the black trace shows the population mean. The vertical line marks the onset time of each sensory stimulus. For each type of conditioning, the diagram represents 50 ms as duration of each stimulus and is set at the bottom of the vertical line. The horizontal scale bar represents 100 ms and the vertical scale bar represents 0.1% ΔF/F intensity in the calibration. † and—represent the significant positive and the significant negative response, respectively (P < 0.05; Student’s t-test for difference from baseline level). Those duration times were shown beside of † or -
Fig. 5
Fig. 5
Associative cortico-cortical responses depending on the conditioning. Box plot of peak magnitudes of the associative responses in the ROI of each cortex (S1, S2, V1, V2, A1, and DC) to the three stimuli (A, foot shock; B, light; and C, tone stimulus) after each conditioning are shown based on the results of Fig. 4. Open boxes represent as Naïve (group). Light gray boxes are indicated as Light-shock. Dotted boxes are indicated as Tone-light. Hatched boxes are indicated as Pre-fear. Gray boxes are indicated as Post-fear. Each Box represents the interquartile range between first and third quartiles, whereas the whisker represents the maximum and the minimum values in median ± 1.5 × IQR, with IQR being the difference between the third and first quartiles. The median value and the mean value were represented by the horizontal line and black dot in the box, respectively. The circles represent data which excluded in median ± 1.5 × IQR. † and—represent the positive and the negative significant response, respectively as Fig. 4 (P < 0.05; Student’s t-test for difference from baseline level)

Similar articles

Cited by

References

    1. Acquas E, Wilson C, Fibiger HC. Conditioned and Unconditioned Stimuli Increase Frontal Cortical and Hippocampal Acetylcholine Release: Effects of Novelty, Habituation, and Fear. J Neurosci. 1996;16:3089–3096. doi: 10.1523/JNEUROSCI.16-09-03089.1996. - DOI - PMC - PubMed
    1. Bakin JS, Weinberger NM. Classical conditioning induces CS-specific receptive field plasticity in the auditory cortex of the guinea pig. Brain Res. 1990;536(1–2):271–286. doi: 10.1016/0006-8993(90)90035-A. - DOI - PubMed
    1. Bieszczad KM, Weinberger NM. Extinction reveals that primary sensory cortex predicts reinforcement outcome: Sensory cortical plasticity induced by extinction. Eur J Neurosci. 2012;35:598–613. doi: 10.1111/j.1460-9568.2011.07974.x. - DOI - PMC - PubMed
    1. Bizley JK, King AJ. Visual influences on ferret auditory cortex. Hear Res. 2009;258(1–2):55–63. doi: 10.1016/j.heares.2009.06.017. - DOI - PMC - PubMed
    1. Bouton ME, Westbrook RF, Corcoran KA, Maren S. Contextual and temporal modulation of extinction: behavioral and biological mechanisms. Biol Psychiatry. 2006;60(4):352–360. doi: 10.1016/j.biopsych.2005.12.015. - DOI - PubMed

LinkOut - more resources