

Integrative Analysis of Exosomal miR-452 and miR-4713 Downregulating NPY1R for the Prevention of Childhood Obesity
- PMID: 35401881
- PMCID: PMC8986441
- DOI: 10.1155/2022/2843353
Integrative Analysis of Exosomal miR-452 and miR-4713 Downregulating NPY1R for the Prevention of Childhood Obesity
Abstract
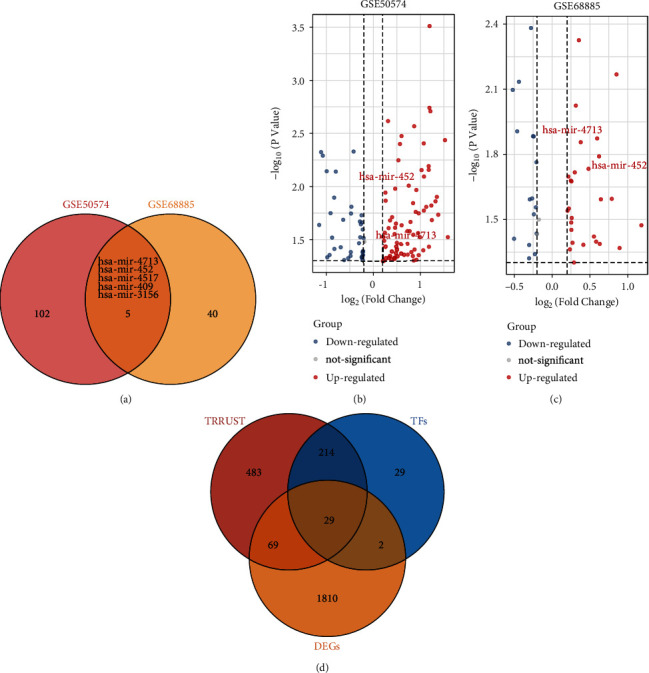
Neuropeptides are associated with childhood obesity and exploring their regulatory mechanisms may reveal new insights for novel treatments. Childhood obesity data were downloaded from the GEO database and were used to screen for differentially expressed neuropeptides in patients with obesity. NPY1R expression was significantly upregulated in children with obesity compared to children without obesity (p < 0.05). The GEO database was used to filter differentially expressed miRNAs in patients with obesity. And hsa-mir-4713 and hsa-mir-452 were found significantly downregulated in adipose tissue. The GEO, TRRUST, and TFacts databases were used to screen all transcription factors for differentially expressed genes (DEGs). The potential regulatory networks between the differentially expressed miRNAs, TFs, and neuropeptides were mapped. In the constructed NPY1R regulatory network, the transcription factors TCF4, HEY1, and GATA3 are significantly associated with NPY1R. TCF4 and HEY1 were positively correlated with NPY1R, while GATA3 was negatively correlated with NPY1R. In the clinical peripheral blood samples, NPY1R, TCF4, and HEY1 were significantly more expressed in the obesity and the obesity with fracture group compared to the control group, while there was no statistically significant difference between the obesity group and the obesity with fracture group in terms of expression. The expression of GATA3, miR-452, and miR-4713 was also significantly lower in the obesity and the obesity with fracture groups when compared to the NC group. Therefore, NPY1R, TCF4, HEY1, GATA3, miR-452, and miR-4713 may be risk factors for fracture in obese children. The potential NPY1R regulatory function was exerted by two pathways: positive regulation caused by TCF4 and HEY1 acting on miR-4713 and negative regulation via GATA3 acting on miR-452. Potential NPY1R-related targets for the treatment of childhood obesity were provided in this study.
Copyright © 2022 Xiaoyan Feng et al.
Conflict of interest statement
We declare that we have no conflict of interest.
Figures


Similar articles
-
Microarray profile analysis identifies ETS1 as potential biomarker regulated by miR-23b and modulates TCF4 in gastric cancer.World J Surg Oncol. 2021 Oct 23;19(1):311. doi: 10.1186/s12957-021-02417-w. World J Surg Oncol. 2021. PMID: 34686186 Free PMC article.
-
Identification of key miRNAs and mRNAs related to coronary artery disease by meta-analysis.BMC Cardiovasc Disord. 2021 Sep 16;21(1):443. doi: 10.1186/s12872-021-02211-2. BMC Cardiovasc Disord. 2021. PMID: 34530741 Free PMC article.
-
[Bioinformatics analysis of microRNA comprehensive regulatory network in B- cell acute lymphoblastic leukemia].Zhonghua Xue Ye Xue Za Zhi. 2016 Jul;37(7):585-90. doi: 10.3760/cma.j.issn.0253-2727.2016.07.009. Zhonghua Xue Ye Xue Za Zhi. 2016. PMID: 27535859 Free PMC article. Chinese.
-
Construction of miRNA-mRNA-TF Regulatory Network for Diagnosis of Gastric Cancer.Biomed Res Int. 2021 Nov 18;2021:9121478. doi: 10.1155/2021/9121478. eCollection 2021. Biomed Res Int. 2021. PMID: 34840985 Free PMC article.
-
MicroRNAs Associated with Overweight and Obesity in Childhood: A Systematic Review.Microrna. 2020;9(4):255-265. doi: 10.2174/2211536609666191209152721. Microrna. 2020. PMID: 31814558
Cited by
-
Study on Potential Differentially Expressed Genes in Idiopathic Pulmonary Fibrosis by Bioinformatics and Next-Generation Sequencing Data Analysis.Biomedicines. 2023 Nov 21;11(12):3109. doi: 10.3390/biomedicines11123109. Biomedicines. 2023. PMID: 38137330 Free PMC article.
-
Exercise improves choroid plexus epithelial cells metabolism to prevent glial cell-associated neurodegeneration.Front Pharmacol. 2022 Sep 16;13:1010785. doi: 10.3389/fphar.2022.1010785. eCollection 2022. Front Pharmacol. 2022. PMID: 36188600 Free PMC article.
-
Alzheimer's disease-associated inflammatory pathways might contribute to osteoporosis through the interaction between PROK2 and CSF3.Front Neurol. 2022 Sep 20;13:990779. doi: 10.3389/fneur.2022.990779. eCollection 2022. Front Neurol. 2022. PMID: 36203970 Free PMC article.
-
The Regulatory Role of MicroRNAs in Obesity and Obesity-Derived Ailments.Genes (Basel). 2023 Nov 13;14(11):2070. doi: 10.3390/genes14112070. Genes (Basel). 2023. PMID: 38003013 Free PMC article. Review.
References
-
- van Vliet M., Gazendam R. P., von Rosenstiel I. A., et al. Differential impact of impaired fasting glucose versus impaired glucose tolerance on cardiometabolic risk factors in multi-ethnic overweight/obese children. European Journal of Pediatrics . 2011;170(5):589–597. doi: 10.1007/s00431-010-1323-3. - DOI - PMC - PubMed
MeSH terms
Substances
LinkOut - more resources
Full Text Sources
Medical
Molecular Biology Databases
