Propofol Upregulates MicroRNA-30b to Inhibit Excessive Autophagy and Apoptosis and Attenuates Ischemia/Reperfusion Injury In Vitro and in Patients
- PMID: 35401922
- PMCID: PMC8986434
- DOI: 10.1155/2022/2109891
Propofol Upregulates MicroRNA-30b to Inhibit Excessive Autophagy and Apoptosis and Attenuates Ischemia/Reperfusion Injury In Vitro and in Patients
Abstract
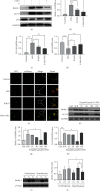
Evidence reveals that propofol protects cells via suppressing excessive autophagy induced by hypoxia/reoxygenation (H/R). Previously, we found in a genome-wide microRNA profile analysis that several autophagy-related microRNAs were significantly altered during the process of H/R in the presence or absence of propofol posthypoxia treatment (P-PostH), but how these microRNAs work in P-PostH is still largely unknown. Here, we found that one of these microRNAs, microRNA-30b (miR-30b), in human umbilical vein endothelial cells (HUVECs) was downregulated by H/R treatment but significantly upregulated by 100 M propofol after H/R treatment. miR-30b showed similar changes in open heart surgery patients. By dual-luciferase assay, we found that Beclin-1 is the direct target of miR-30b. This conclusion was also supported by knockdown or overexpression of miR-30b. Further studies showed that miR-30b inhibited H/R-induced autophagy activation. Overexpression or knockdown of miR-30b regulated autophagy-related protein gene expression in vitro. To clarify the specific role of propofol in the inhibition of autophagy and distinguish the induction of autophagy from the damage of autophagy flux, we used bafilomycin A1. LC3-II levels were decreased in the group treated with propofol combined with bafilomycin A1 compared with the group treated with bafilomycin A1 alone after hypoxia and reoxygenation. Moreover, HUVECs transfected with Ad-mCherry-GFP-LC3b confirmed the inhibitory effect of miR-30b on autophagy flux. Finally, we found that miR-30b is able to increase the cellular viability under the H/R condition, partially mimicking the protective effect of propofol which suppressed autophagy via enhancing miR-30b and targeting Beclin-1. Therefore, we concluded that propofol upregulates miR-30b to repress excessive autophagy via targeting Beclin-1 under H/R condition. Thus, our results revealed a novel mechanism of the protective role of propofol during anesthesia. Clinical Trial Registration Number. This trial is registered with ChiCTR-IPR-14005470. The name of the trial register: Propofol Upregulates MicroRNA-30b to Repress Beclin-1 and Inhibits Excessive Autophagy and Apoptosis.
Copyright © 2022 Zhiqi Lu et al.
Conflict of interest statement
The authors declare that they have no conflict of interests.
Figures


Similar articles
-
Propofol Regulates the Expression of BecliN-1 through miR-30b and Protects against Lung Ischemia-Reperfusion Injury.Cell Mol Biol (Noisy-le-grand). 2022 Feb 4;67(5):348-355. doi: 10.14715/cmb/2021.67.5.47. Cell Mol Biol (Noisy-le-grand). 2022. PMID: 35818233
-
MicroRNA-20b-5p regulates propofol-preconditioning-induced inhibition of autophagy in hypoxia-and-reoxygenation-stimulated endothelial cells.J Biosci. 2020;45:35. J Biosci. 2020. PMID: 32098914
-
Differential microRNA profiling in a cellular hypoxia reoxygenation model upon posthypoxic propofol treatment reveals alterations in autophagy signaling network.Oxid Med Cell Longev. 2013;2013:378484. doi: 10.1155/2013/378484. Epub 2013 Dec 22. Oxid Med Cell Longev. 2013. PMID: 24454982 Free PMC article.
-
MicroRNAs as Potential Pharmaco-targets in Ischemia-Reperfusion Injury Compounded by Diabetes.Cells. 2019 Feb 12;8(2):152. doi: 10.3390/cells8020152. Cells. 2019. PMID: 30759843 Free PMC article. Review.
-
Crucial role of autophagy in propofol-treated neurological diseases: a comprehensive review.Front Cell Neurosci. 2023 Oct 25;17:1274727. doi: 10.3389/fncel.2023.1274727. eCollection 2023. Front Cell Neurosci. 2023. PMID: 37946715 Free PMC article. Review.
Cited by
-
The role and mechanism of action of miR‑92a in endothelial cell autophagy.Mol Med Rep. 2024 Sep;30(3):172. doi: 10.3892/mmr.2024.13296. Epub 2024 Jul 26. Mol Med Rep. 2024. PMID: 39054957 Free PMC article.
-
Exercise Training-Induced MicroRNA Alterations with Protective Effects in Cardiovascular Diseases.Rev Cardiovasc Med. 2023 Sep 6;24(9):251. doi: 10.31083/j.rcm2409251. eCollection 2023 Sep. Rev Cardiovasc Med. 2023. PMID: 39076378 Free PMC article. Review.
-
MiR-223-3p-loaded exosomes from bronchoalveolar lavage fluid promote alveolar macrophage autophagy and reduce acute lung injury by inhibiting the expression of STK39.Hum Cell. 2022 Nov;35(6):1736-1751. doi: 10.1007/s13577-022-00762-w. Epub 2022 Aug 6. Hum Cell. 2022. PMID: 35932362
-
Queen bee acid pretreatment attenuates myocardial ischemia/reperfusion injury by enhancing autophagic flux.Heliyon. 2024 Jun 21;10(12):e33371. doi: 10.1016/j.heliyon.2024.e33371. eCollection 2024 Jun 30. Heliyon. 2024. PMID: 39021954 Free PMC article.
References
-
- Andrews D. T., Royse C., Royse A. G. The mitochondrial permeability transition pore and its role in anaesthesia-triggered cellular protection during ischaemia-reperfusion injury. Anaesthesia and Intensive Care . 2012;40(1):46–70. - PubMed
MeSH terms
Substances
LinkOut - more resources
Full Text Sources

