. 2022 Mar 25:12:780784.
doi: 10.3389/fonc.2022.780784. eCollection 2022.

A Data-Driven Fragmentation Model for Carbon Therapy GPU-Accelerated Monte-Carlo Dose Recalculation

Affiliations

A Data-Driven Fragmentation Model for Carbon Therapy GPU-Accelerated Monte-Carlo Dose Recalculation

Micol De Simoni et al. Front Oncol. .

Abstract

The advent of Graphics Processing Units (GPU) has prompted the development of Monte Carlo (MC) algorithms that can significantly reduce the simulation time with respect to standard MC algorithms based on Central Processing Unit (CPU) hardware. The possibility to evaluate a complete treatment plan within minutes, instead of hours, paves the way for many clinical applications where the time-factor is important. FRED (Fast paRticle thErapy Dose evaluator) is a software that exploits the GPU power to recalculate and optimise ion beam treatment plans. The main goal when developing the FRED physics model was to balance accuracy, calculation time and GPU execution guidelines. Nowadays, FRED is already used as a quality assurance tool in Maastricht and Krakow proton clinical centers and as a research tool in several clinical and research centers across Europe. Lately the core software has been updated including a model of carbon ions interactions with matter. The implementation is phenomenological and based on carbon fragmentation data currently available. The model has been tested against the MC FLUKA software, commonly used in particle therapy, and a good agreement was found. In this paper, the new FRED data-driven model for carbon ion fragmentation will be presented together with the validation tests against the FLUKA MC software. The results will be discussed in the context of FRED clinical applications to 12C ions treatment planning.

Keywords: carbon ion (C12); fast MC; fragmentation; graphics processing unit (GPU); hadrontherapy; quality assurance (QA).


Conflict of interest statement

The authors declare that the research was conducted in the absence of any commercial or financial relationships that could be construed as a potential conflict of interest.

Figures

Figure 1
Figure 1
On the left, cross-sections of a carbon ion beam as a function of the energy per nucleon of the projectile interacting with different targets: calcium (purple cross), carbon (green x), oxygen (blue asterisk), hydrogen (orange square). Each cross-section has been obtained as described by Eq. 6 with the exception of the hydrogen target for which the available ICRU data has been used ( Figure 2 ). Cross section dependence on the energy per nucleon of the projectile is shown. On the right, fragmentation cross-section in carbon-carbon interactions in the energy range of interest for hadron therapy as a function of the total energy of the projectile. In red the fit to data from papers of Takechi (29), Zhang (30) and Kox (31, 32).
Figure 2
Figure 2
Carbon-hydrogen fragmentation cross-section. For energies higher than 250 MeV/u the cross-section can be considered as nearly constant. Red triangles show the ICRU data fit result that is used in the FRED implementation. ICRU data (41) are represented as green squares.
Figure 3
Figure 3
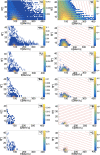
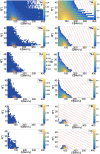
Contour lines (red) of bidimensional fits of energy and angle distribution of different fragments produced by a 95 MeV/u carbon ion beam interacting with a hydrogen target. The color maps represent data taken from the 95 MeV/u Ganil experiment in linear (left) and logarithmic (right) scale.
Figure 4
Figure 4
Contour lines (red) of bidimensional fits of energy and angle distribution of different fragments produced by a 95 MeV/u carbon ion beam interacting with a carbon target. The color maps represent data taken from the 95 MeV/u Ganil experiment in linear (left) and logarithmic (right) scale.
Figure 5
Figure 5
Contour lines (red) of bidimensional fits of energy and angle distribution of different fragments produced by a 95 MeV/u carbon ion beam interacting with an oxygen target. The color maps represent data taken from the 95 MeV/u Ganil experiment in linear (left) and logarithmic (right) scale.
Figure 6
Figure 6
The absorbed dose integrated over the longitudinal axis for carbon ion beams in water at different energies. The absorbed dose per primary particle was obtained simulationg 108 primaries. Comparison between FRED (red continuous line) and FLUKA (blue dotted line) simulations, with the same scoring grid, and the same number of primaries is presented.
Figure 7
Figure 7
Absorbed dose in water for a 200 MeV/u carbon ion beam simulated with FRED (red continuous line) and FLUKA (blue dotted line) with the same scoring grid and the same number of primaries. On the left, it is possible to observe the absorbed dose integrated over the longitudinal axis (top) and central axis profile along beam axis (bottom). On the right, the lateral axis profile at 8.6 cm of depth in linear scale (top right) and logarithmic (bottom right) scale. This position is the one corresponding to the maximum value of the dose (BP) both in the FLUKA and the FRED simulations.
Figure 8
Figure 8
Top: longitudinal (left) and lateral (right) integrated dose distributions for a SOBP in water. FRED (red continuous line) and FLUKA (blue dotted line) simulations are shown using the same scoring grid (voxel size: 0.5 × 0.5 × 0.2 mm3), and the same number of primary particles (108). Bottom: the corresponding γ- index distribution is shown. The γ-index 2mm/3% pass rate is 99.89%. The maximum value of the γ-index is 4.3, while the mean value is 0.21. The γ-index xy slice (left) shows the γ-index distribution at z = 13 cm, which is in the peak region of the SOBP, while the other slices (center and right) are centered in x (0 cm) and y (-1.5 cm).
Figure 9
Figure 9
On the left the dose distribution on the XY slice at z = 12.80 cm is shown. On the center pictures, there is the dose distribution on the YZ slice centered in x. On the right, the longitudinal dose distribution on the ZX slice at z=-1.7cm is shown. The projection of the 2D figures is shown on the bottom figures. Comparison between FRED (figures on the top and blue line) and FLUKA (figures on the bottom and red line) simulations, with the same scoring grid (2 mm), and the same number of primary particles (106) is shown.

References

    1. Paganetti H. Range Uncertainties in Proton Therapy and the Role of Monte Carlo Simulations. Phys Med Bio (2012) 57:r99–117. doi: 10.1088/0031-9155/57/11/R99 - DOI - PMC - PubMed
    1. Parodi K. Clinical CT-Based Calculations of Dose and Positron Emitter Distributions in Proton Therapy Using the Fluka Monte Carlo Code. Phys Med Biol (2007) 52:3369–87. doi: 10.1088/0031-9155/52/12/004 - DOI - PMC - PubMed
    1. Titt U, Bednarz B, Paganetti H. Comparison of Mcnp X And Geant 4 Proton Energy Deposition Predictions for Clinical Use. Phys Med Biol (2012) 57:6381–93. doi: 10.1088/0031-9155/57/20/6381 - DOI - PMC - PubMed
    1. Scaffner B, Pedroni E, Lomax A. Dose Calculation Models for Proton Treatment Planning Using a Dynamic Beam Delivery System: An Attempt to Include Density Heterogeneity Effects in the Analytical Dose Calculation. Phys Med Bio (1999) 44:27–41. doi: 10.1088/0031-9155/44/1/004 - DOI - PubMed
    1. Paganetti H, Jiang H, Parodi K, Slopsema R, Engelsman M. Clinical Implementation of Full Monte Carlo Dose Calculation in Proton Beam Therapy. Phys Med Bio (2008) 53:4825–53. doi: 10.1088/0031-9155/53/17/023 - DOI - PubMed

LinkOut - more resources