. 2022 Mar 25:12:782045.
doi: 10.3389/fcimb.2022.782045. eCollection 2022.

Clonal Diversity and Epidemiological Characteristics of ST239-MRSA Strains

Affiliations

Clonal Diversity and Epidemiological Characteristics of ST239-MRSA Strains

Marwa I Abd El-Hamid et al. Front Cell Infect Microbiol. .

Abstract

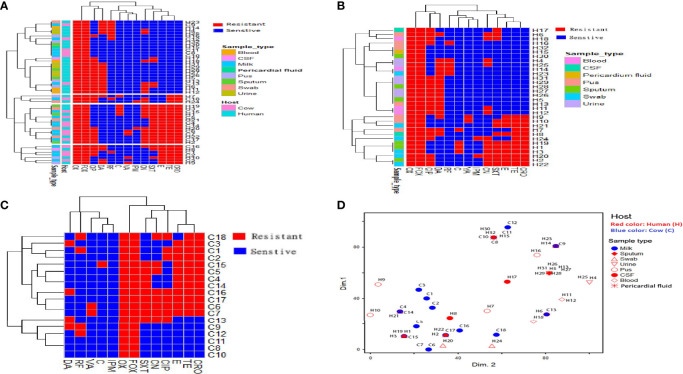
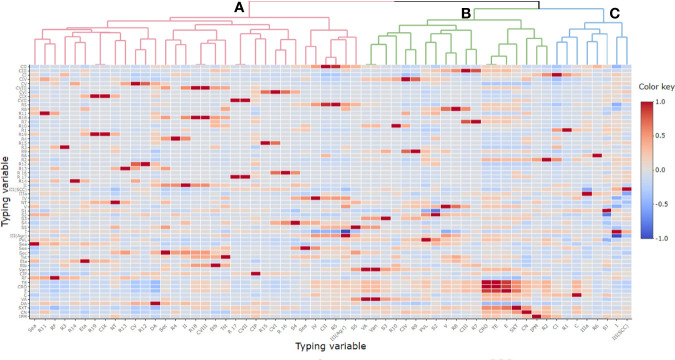
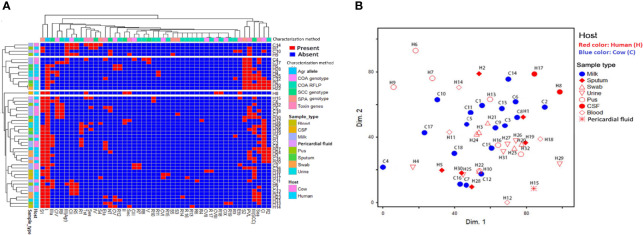
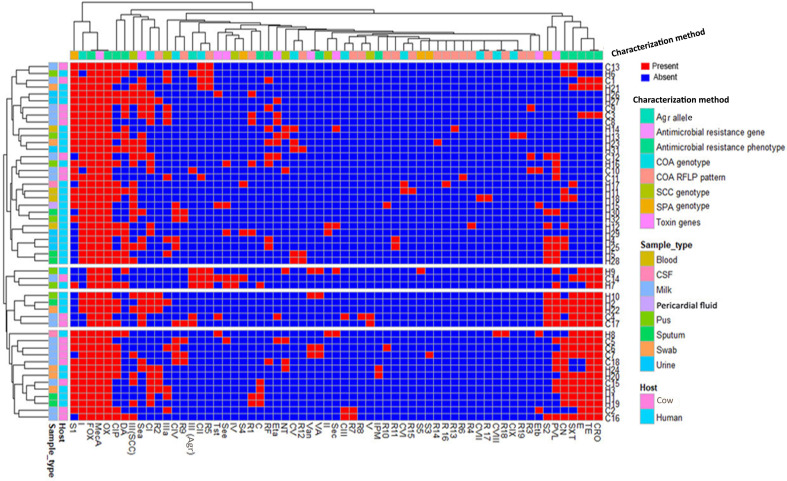
Methicillin-resistant Staphylococcus aureus (MRSA) is a major pathogen associated with severe morbidity and mortality and poses a significant threat to public health worldwide. The genetic diversity based on sequence types of MRSA strains was illustrated in previous studies; meanwhile, the diversity along with the predominant sequence type, especially in Egypt, remains unknown. The purpose of the current study was to determine the diversity of the predominant MRSA clone ST239-MRSA (n = 50) isolated from different hosts and clinical samples and to illustrate the correlation between the resistance patterns, toxin genes, and the genetic background in Port-said and El-Sharkia Governorates, Egypt. The ST239-MRSA clone was analyzed by phenotypic antibiotyping and various genotypic assays comprising SCCmec, agr, spa, coa, and coa-RFLP in addition to toxin gene profiles. Most of the analyzed strains (40/50, 80%) were multidrug resistant (MDR), belonged to SCCmec-III, agr-I, and coa genotype I, and harbored sea and pvl genes. A negative correlation between the toxin gene profiles and antimicrobial resistance was recorded. Meanwhile, the correlation between the toxin gene profiles and the genetic background was not observed in this study. Although ST239-MRSA strains belonged to a single sequence type, they exhibited a high degree of phenotypic and genotypic diversity, indicating weak clonality and adaptability. With such diversity, it is assumed that these strains may have undergone different evolutionary processes during transmission events among and/or within a single host or tissue niche.

Keywords: MDR; MRSA; ST239; evolution; genetic background.


Conflict of interest statement

The authors declare that the research was conducted in the absence of any commercial or financial relationships that could be construed as a potential conflict of interest.

Figures

Figure 1
Figure 1
Distribution and hierarchical clustering of ST239 methicillin-resistant Staphylococcus aureus (MRSA) strains and the antimicrobial resistance variables based on the antimicrobial resistance profiles. (A–C) Heatmap showing the occurrence of antimicrobial resistance in the studied strains; all, human, and animal ST239 MRSA, respectively. Red and blue colors refer to resistance and sensitivity to a particular antimicrobial, respectively. The dendrogram represents the hierarchical clustering of the strains and antimicrobial resistance variables. The vertical lines dropped from the dendrogram branches show the 10 clusters that contained identical isolates. Different categories of hosts and sample types are color-coded on the right of the heatmap. (D) Non-metric multidimensional scaling analysis showing the overlap of ST239-MRSA strains belonging to different hosts and sample types based on antimicrobial resistance profile. CIP, ciprofloxacin; RF, rifamycin SV; TE, tetracycline; CRO, ceftriaxone; E, erythromycin; C, chloramphenicol; VA, vancomycin; DA, clindamycin; SXT, trimethoprim‐sulfamethoxazole; CN, gentamicin; IPM, imipenem; OX, oxacillin; FOX, cefoxitin.
Figure 2
Figure 2
Network depicting the differences among ST239-MRSA strains based on the antimicrobial resistance profile. (A) The average distance among strains from humans and cows. (B) The average distance among strains from various samples.
Figure 3
Figure 3
Pairwise correlation (r) among different variables of typing methods. Red and blue colors indicate positive and negative correlation, respectively. The color key refers to correlation coefficient (r). The darker colors imply stronger positive or negative correlations. Hierarchical clustering of the variables is shown as a dendrogram illustrating different clusters with different colors and letters (e.g., (A–C). Variables that are identical among all strains are excluded and thus not shown in this figure. CIP, ciprofloxacin; RF, rifamycin SV; TE, tetracycline; CRO, ceftriaxone; E, erythromycin; C, chloramphenicol; VA, vancomycin; DA, clindamycin; SXT, trimethoprim‐sulfamethoxazole; CN, gentamicin; IPM, imipenem; CI-CIX, coagulase genotypes; R1–R19, coa-RFLP patterns; SCCmec (II, III, IV, and V), staphylococcal cassette chromosome mec; NT, non-typeable; agr (I and III), accessory gene regulator; S1–S5, spa PCR products; van, vancomycin resistance gene; pvl, Panton–Valentine leucocidin; sea, see, and sec; staphylococcal enterotoxins A, B, and C; tst, toxic shock syndrome toxin; eta and etb, exfoliative toxins A and B.
Figure 4
Figure 4
Distribution and hierarchical clustering of ST239-MRSA strains and the different genotypes based on different molecular typing methods. (A) Heatmap showing the occurrence of particular genotype/toxin gene in the studied ST239-MRSA strains. Red and blue colors refer to presence and absence of a particular feature, respectively. The dendrogram represents the hierarchical clustering of the strains and the genotype variables. Different categories of genotyping methods, sample types, and hosts are color-coded on the right of the heatmap. (B) Non-metric multidimensional scaling analysis indicating the presence of each subject in the 2-dimensional space and thus showing how the subjects could cluster or be separated from each other. CI–CIX, coagulase genotypes; R1–R19, coa-RFLP patterns; SCCmec (II, III, IV, and V), staphylococcal cassette chromosome mec; NT, non-typeable; agr (I and III), accessory gene regulator; S1–S5, spa PCR products; van, vancomycin resistance gene; pvl, Panton–Valentine leucocidin; sea, see, and sec, staphylococcal enterotoxins A, B, and C; tst, toxic shock syndrome toxin; eta and etb, exfoliative toxins A and B.
Figure 5
Figure 5
Network depicting the differences among ST239-MRSA strains based on both genotypes and toxin gene profile. (A) The average distance among strains from humans and cows. (B) The average distance among strains from various samples.
Figure 6
Figure 6
Heatmap showing the hierarchical clustering and overall distribution of ST239-MRSA strains based on their genotypes and antimicrobial resistance and toxin gene profiles. Red and blue colors refer to presence and absence of a particular feature, respectively. The dendrogram represents the hierarchical clustering of the strains and various features. Different categories of characterization methods, sample types, and hosts are color-coded on the right of the heatmap. CIP, ciprofloxacin; RF, rifamycin SV; TE, tetracycline; CRO, ceftriaxone; E, erythromycin; C, chloramphenicol; VA, vancomycin; DA, clindamycin; SXT, trimethoprim‐sulfamethoxazole; CN, gentamicin; IPM, imipenem; CI–CIX, coagulase genotypes; R1–R19, coa-RFLP patterns; SCCmec (II, III, IV, and V), staphylococcal cassette chromosome mec; NT, non-typeable; agr (I and III), accessory gene regulator; S1–S5, spa PCR products; van, vancomycin resistance gene; pvl, Panton–Valentine leucocidin; sea, see, and sec, staphylococcal enterotoxins A, B, and C; tst, toxic shock syndrome toxin; eta and etb, exfoliative toxins A and B.

References

    1. Abd El-Aziz N. K., Abd El-Hamid M. I., Bendary M. M., El-Azazy A. A., Ammar A. M. (2018). Existence of Vancomycin Resistance Among Methicillin Resistant S. aureus Recovered From Animal and Human Sources in Egypt. Slov. Vet. Res. 55, 221–230. doi: 10.26873/SVR-649-2018 - DOI
    1. Abd El-Hamid M. I., Bendary M. (2015). Comparative Phenotypic and Genotypic Discrimination of Methicillin Resistant and Susceptible Staphylococcus aureus in Egypt. Cell. Mol. Biol. 61, 101–112. doi: 10.14715/cmb/2015.61.4.18 - DOI - PubMed
    1. Abd El-Hamid M. I., Bendary M. M., Merwad A. M. A., Elsohaby I., Mohammad Ghaith D., Alshareef W. A. (2019). What Is Behind Phylogenetic Analysis of Hospital-, Community- and Livestock-Associated Methicillin-Resistant Staphylococcus Aureus ? Transbound. Emerg. Dis. 66, 1506–1517. doi: 10.1111/tbed.13170 - DOI - PubMed
    1. Alfouzan W., Al-Haddad A., Udo E., Mathew B., Dhar R. (2013). Frequency and Clinical Association of Panton-Valentine Leukocidin-Positive Staphylococcus aureus Isolates: A Study From Kuwait. Med. Princ. Pract. 22, 245–249. doi: 10.1159/000343906 - DOI - PMC - PubMed
    1. Alfouzan W., Udo E. E., Modhaffer A. (2019). Molecular Characterization of Methicillin-Resistant Staphylococcus aureus in a Tertiary Care Hospital in Kuwait. Sci. Rep. 9, 1–8. doi: 10.1038/s41598-019-54794-8 - DOI - PMC - PubMed

MeSH terms

Substances