. 2022 Mar 24:12:851917.
doi: 10.3389/fcimb.2022.851917. eCollection 2022.

Hepatitis C Virus Infection Cycle-Specific MicroRNA Profiling Reveals Stage-Specific miR-4423-3p Targets RIG-I to Facilitate Infection

Affiliations

Hepatitis C Virus Infection Cycle-Specific MicroRNA Profiling Reveals Stage-Specific miR-4423-3p Targets RIG-I to Facilitate Infection

Xijing Qian et al. Front Cell Infect Microbiol. .

Abstract

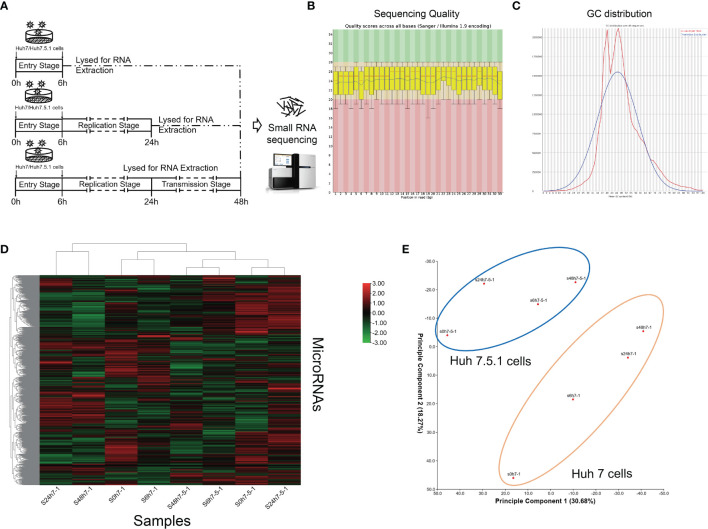
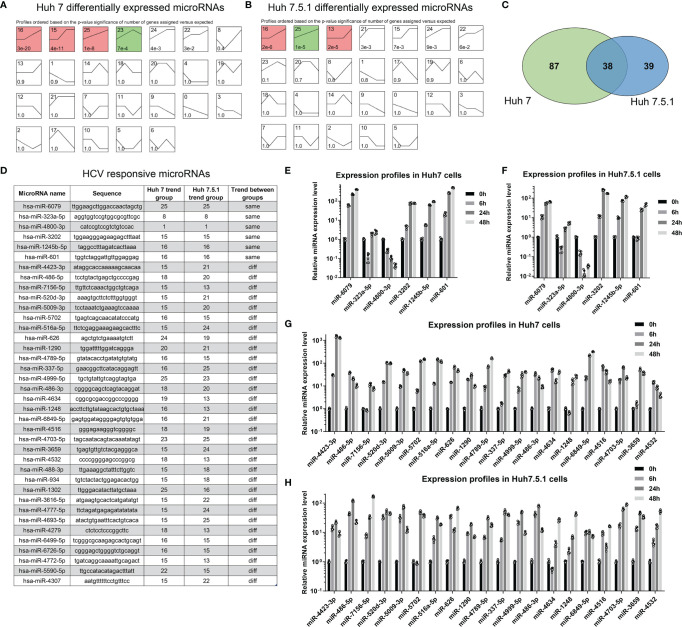
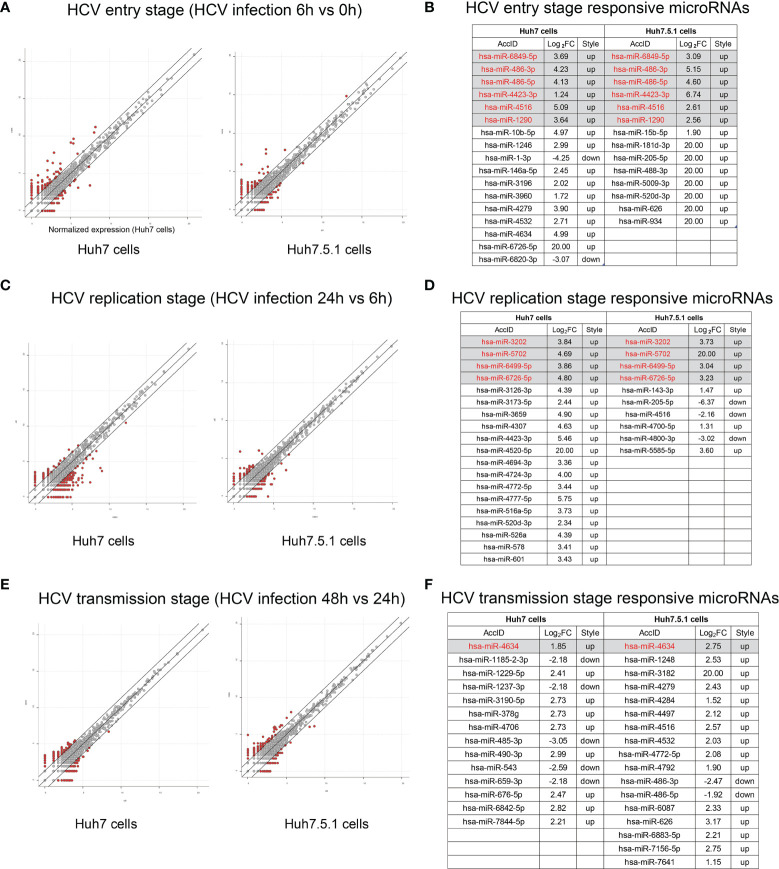
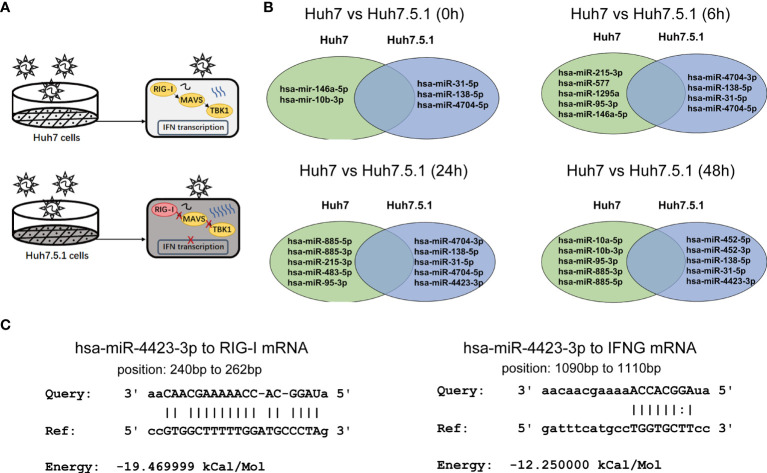
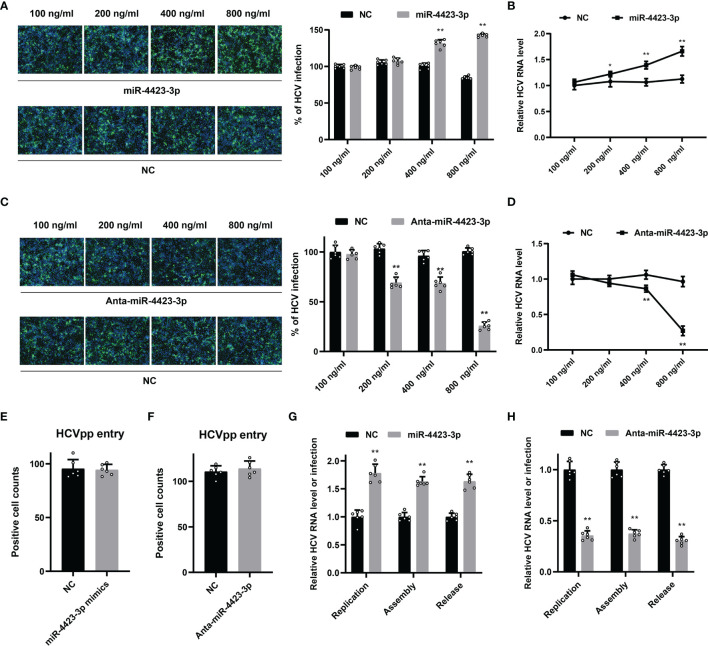
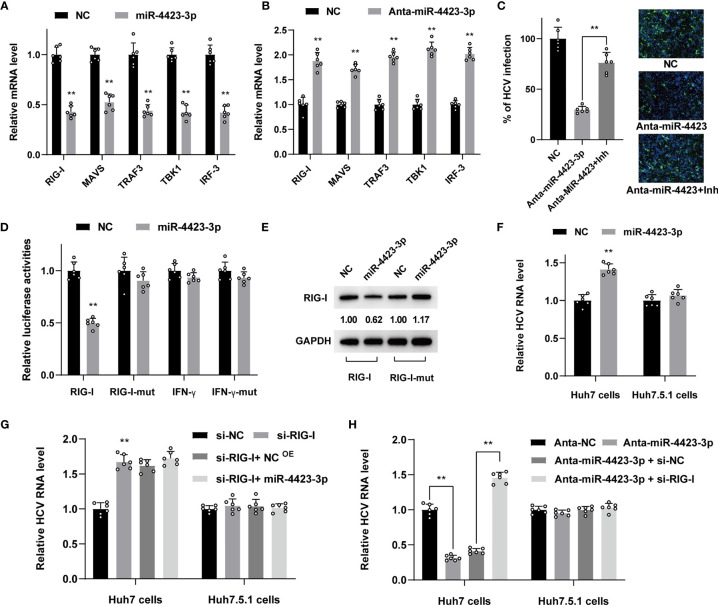
Hepatitis C virus (HCV) infection is one of the main causes of chronic liver diseases, the disorders of which involve multiple pathological processes and elements including host factors such as non-coding small RNAs. Although several genes have been reported to be correlated with HCV infection, the potential regulatory network has not been deciphered clearly. By small RNA sequencing, we clarified the expression profile of microRNAs (miRNAs) in HCV-infected Huh7 and Huh7.5.1 cells and identified 6 dysregulated miRNAs with the same expression trend and 32 dysregulated miRNAs with different expression trends during different stages of HCV life cycle. By looking into each infection stage, we found that 6 miRNAs were entry stage specific, 4 miRNAs were replication stage specific, and 1 miRNA was related to the transmission stage. Moreover, due to the fact that Huh7.5.1 cells have a retinoic acid-inducible gene 1 (RIG-I) mutation which causes reduced production of interferons (IFNs), we here focused on the miRNAs of different trends to decipher the RIG-I/IFN specific miRNAs. Among them, miR-4423-3p showed a significant promotive effect on HCV infection by suppressing RIG-I/IFN pathway through direct binding to RIG-I mRNA. Together, the results displayed novel insights into the miRNA regulatory networks in HCV infection and progression, thus providing a prosperous perspective into the establishment of novel therapeutic and diagnostic targets of the disease.

Keywords: RIG-I; hepatitis C virus; miR-4423-3p; microRNA; small RNA sequencing.


Conflict of interest statement

The authors declare that the research was conducted in the absence of any commercial or financial relationships that could be construed as a potential conflict of interest.

Figures

Figure 1
Figure 1
miRNA expression profiles of high-throughput sequencing analysis during HCV infection. (A) Schematic graph of small RNA sequencing. (B) Representative images of sequencing quality scores of the samples. (C) GC distribution of the sequencing data. (D) Hierarchical clustering of the sequenced samples. Note that samples of the same cell line were clustered together, and the time point was chosen according to miRNA deviation degree during HCV infection. The red color represented upregulated miRNAs, and green color represented downregulated miRNAs. (E) Principal component analysis showing the distribution of samples. Note that the samples of same cell line were circled together.
Figure 2
Figure 2
miRNA signatures were different between Huh7 and Huh7.5.1 cells. (A, B) miRNA expression changes were categorized using series cluster method, and was classified into 26 different expression pattern groups in Huh7 and Huh7.5.1 cells. (C) Venn plot showing the differentially expressed miRNAs in both cell lines. (D) The sequences of HCV responsive miRNAs in Huh7 or Huh7.5.1 cells were illustrated, and their change profiles were identified to check whether they are in the same or different trend groups. The expression of the 6 miRNAs in the same group was evaluated in HCV infected Huh7 (E) and Huh7.5.1 cells (F). The expression of the 20 miRNAs in the different group was also checked in HCV infected Huh7 (G) and Huh7.5.1 cells (H).
Figure 3
Figure 3
Responsive miRNA expressions during different stages of HCV infection. (A) The scatter plot showed the differentially expressed miRNAs during entry stage, and miRNAs with more than 2 folds of expression fold change (FC) above were listed with the overlapped 6 miRNAs indicated under the gray background (B). Similarly, scatter plot indicating HCV replication stage was shown (C) and relevant responsive miRNAs were listed as well (D). MiRNAs altered during HCV transmission were scatter plotted (E) and illustrated (F).
Figure 4
Figure 4
Candidate miRNA concerning IFN production pathway was selected from the differentially expressed miRNAs. (A) Diagram depicted the different responses between Huh7 and Huh7.5.1 cells after HCV infection. (B) MiRNAs with different change trends in the two cell lines, and the differentially expressed miRNAs were shown at respective infected periods (0, 6, 24, and 48 h). (C) Potential targets of miR-4423-3p were predicted and their interactions were illustrated. Results were shown as relative mRNA expression level.
Figure 5
Figure 5
Function of miR-4423-3p on HCV infection. (A, B) Huh7 cells were transfected with indicated concentrations of miR-4423-3p mimics or scramble control and infected with HCVcc (MOI = 0.1) for 6h. Approximately 48 h after infection, HCV infection was analyzed by IF (A) and RT-qPCR (B). (C, D) Huh7 cells were treated with various concentrations of miR-4423-3p inhibitors or scramble control, followed by infection of HCVcc (MOI = 0.1). Viral infection was also detected by IF (C) and RT-qPCR (D). Results were shown as % of HCV infection or relative HCV RNA level. **p < 0.01 compared with negative control. (E, F) Huh7 cells were transfected with miR-4423-3p mimics (E) or inhibitors (F) and incubated with HCVpp for 6h. HCV entry efficiency was analyzed by counting the positive cells in respective wells. (G, H) Huh7 cells were treated with miR-4423-3p mimics (G) or inhibitors (H) for 24 h, and then transfected with HCV RNA. Aapproximately 24 h after transfection, parts of the cells were lysed to test intracellular HCV RNA level to evaluate viral replication. Parts of the cells were subjected to three cycles of freeze and thaw to test the intracellular viral infectivity to evaluate viral assembly. Cellular supernatant was collected to determine viral release. Results were shown as relative HCV RNA level or infection. *p < 0.05, **p < 0.01 compared with the negative control group.
Figure 6
Figure 6
MiR-4423-3p affected viral infection through regulating the expression of RIG-I in Huh7 cells. (A, B) Huh7 cells were transfected with 800 ng/ml miR-4423-3p mimics (A) or inhibitors (B) together with scramble control and infected with HCVcc (MOI = 0.1). Cells were lysed to test the mRNA level of factor in RIG-I pathway 24 h after infection by RT-qPCR. (C) Huh7 cells were transfected with miR-4423-3p inhibitor (800 ng/ml) or scramble control and infected with HCVcc (MOI = 0.1). Parts of the cells were treated with TBK1 inhibitor of amlexanox. Viral infection was evaluated by IF. **p < 0.01 compared with the group without amlexanox treatment. (D) Dual luciferase reporter assay evaluating the firefly luciferase activities of the plasmids after miR-4423-3p overexpression in Huh7 cells. (E) The protein expression of RIG-I or IFN-γ was also tested by western-blot. The images were normalized by GAPDH and quantified. (F) Huh7 or Huh7.5.1 cells were transfected with 800 ng/ml miR-4423-3p mimics or scramble control, followed by HCV infection (MOI = 0.1), and viral infection was determined by RT-qPCR. (G) RIG-I expression was interfered by relevant siRNA in Huh7 or Huh7.5.1 cells. MiR-4423-3p mimics (800 ng/ml) or scramble control were transfected into the cells subsequently to analyze their effect on HCV infection (MOI = 0.1). (H) Huh7 or Huh7.5.1 cells were treated with MiR-4423-3p inhibitor (800 ng/ml) or scramble control and treated with RIG-I siRNA before the cells were infected by HCVcc (MOI = 0.1). Viral infection was detected by RT-qPCR. Results were shown as relative mRNA or HCV RNA level. **p < 0.01 compared with negative control.

Similar articles

Cited by

References

    1. Bandyopadhyay S., Friedman R. C., Marquez R. T., Keck K., Kong B., Icardi M. S., et al. . (2011). Hepatitis C Virus Infection and Hepatic Stellate Cell Activation Downregulate miR-29: miR-29 Overexpression Reduces Hepatitis C Viral Abundance in Culture. J. Infect. Dis. 203 (12), 1753–1762. doi: 10.1093/infdis/jir186 - DOI - PMC - PubMed
    1. Bartosch B., Dubuisson J., Cosset F. L. (2003). Infectious Hepatitis C Virus Pseudo-Particles Containing Functional E1-E2 Envelope Protein Complexes. J. Exp. Med. 197 (5), 633–642. doi: 10.1084/jem.20021756 - DOI - PMC - PubMed
    1. Benfey P. N. (2003). Molecular Biology: microRNA Is Here to Stay. Nature 425 (6955), 244–245. doi: 10.1038/425244a - DOI - PubMed
    1. Chigbu D. I., Loonawat R., Sehgal M., Patel D., Jain P. (2019). Hepatitis C Virus Infection: Host(-)Virus Interaction and Mechanisms of Viral Persistence. Cells 8 (4), 376. doi: 10.3390/cells8040376 - DOI - PMC - PubMed
    1. Dore G. J., Bajis S. (2021). Hepatitis C Virus Elimination: Laying the Foundation for Achieving 2030 Targets. Nat. Rev. Gastroenterol. Hepatol. 18 (2), 91–92. doi: 10.1038/s41575-020-00392-3 - DOI - PMC - PubMed

Publication types