. 2022 Mar 23:9:839917.
doi: 10.3389/fmolb.2022.839917. eCollection 2022.

Extracellular Vesicles Contribute to the Metabolism of Transthyretin Amyloid in Hereditary Transthyretin Amyloidosis

Affiliations

Extracellular Vesicles Contribute to the Metabolism of Transthyretin Amyloid in Hereditary Transthyretin Amyloidosis

Hiroki Yamaguchi et al. Front Mol Biosci. .

Abstract

Hereditary (variant) transthyretin amyloidosis (ATTRv amyloidosis), which is caused by variants in the transthyretin (TTR) gene, leads to TTR amyloid deposits in multiple organs and various symptoms such as limb ataxia, muscle weakness, and cardiac failure. Interaction between amyloid proteins and extracellular vesicles (EVs), which are secreted by various cells, is known to promote the clearance of the proteins, but it is unclear whether EVs are involved in the formation and deposition of TTR amyloid in ATTRv amyloidosis. To clarify the relationship between ATTRv amyloidosis and EVs, serum-derived EVs were analyzed. In this study, we showed that cell-derived EVs are involved in the formation of TTR amyloid deposits on the membrane of small EVs, as well as the deposition of TTR amyloid in cells. Human serum-derived small EVs also altered the degree of aggregation and deposition of TTR. Furthermore, the amount of TTR aggregates in serum-derived small EVs in patients with ATTRv amyloidosis was lower than that in healthy controls. These results indicate that EVs contribute to the metabolism of TTR amyloid, and suggest that TTR in serum-derived small EVs is a potential target for future ATTRv amyloidosis diagnosis and therapy.

Keywords: ATTRv amyloidosis; amyloidosis; atomic force microscope; extracellular vesicle; transthyretin.


Conflict of interest statement

The authors declare that the research was conducted in the absence of any commercial or financial relationships that could be construed as a potential conflict of interest.

Figures

FIGURE 1
FIGURE 1
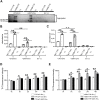
HepG2-derived EVs contain TTR whereas HEK293T-derived EVs or NIH3T3-derived EVs do not. (A) TTR monomer was detected in western blotting analysis of the culture supernatant of HepG2 and HepG2-derived EVs. (B) TTR was not detected in western blotting analysis of the cell lysate and cell line-derived EVs in HEK293T and NIH3T3. 3T3 (NIH3T3), 293T (HEK293T). (C) Analysis of three cell line-derived EVs [HepG2 (black), HEK293T (red), and NIH3T3 (green)] by NanoSight (Raw mode). The diameter and distribution of cell line-derived EVs were similar among the cell lines. All EVs were 40 ng/ml before measurement and were diluted 30-fold with PBS immediately before analysis. Particle concentrations were as follows: HepG2 cell-derived (2.52 × 10¹⁰ ± 1.19 × 10⁹), HEK293T-derived (2.96 × 10¹⁰ ± 1.01 × 10⁹), and NIH3T3-derived EVs (2.23× 10¹⁰ ± 1.28 × 10⁹).
FIGURE 2
FIGURE 2
EVs are easily combined with purified V30M-TTR. (A) Mixture of NIH3T3-derived EVs, HEK293T-derived EVs or non-EVs, and purified TTR in non-shaking conditions for 48 h used for western blotting analysis. Ladder bands suggestive of aggregates were confirmed above the top of the running gel on V30-TTR and both EVs. (B) Remaining samples were diluted and used for EV ELISA. Binding of cell line-derived EVs to TTR was indicated by the increased absorbance in EV ELISA. NIH3T3-derived EVs were more likely to bind to TTR than HEK293T-derived EVs. N = 3, mean ± S.E.; **, p < 0.005; n.s., not significant, ANOVA with Tukey’s post hoc test. (C) The same samples as the previous experiment were shaken at 500 rpm and used for EV ELISA. TTR-V30M with cell line-derived EVs showed higher absorbance than TTR-WT. N = 3, mean ± S.E.; **, p < 0.005; n.s., not significant, ANOVA with Tukey’s post hoc test. (D) Increase of Thioflavin T (ThT) fluorescence intensity (FI) in a mixture of EVs and purified WT-TTR with acidic buffer observed by ThT assay. FI value decreased in the following order: TTR with NIH3T3-derived EVs, HEK293T-derived EVs, and elution buffer in both WT-TTR and V30M-TTR. N = 4, mean ± S.E.; *, p < 0.05; **, p < 0.005; ANOVA with Tukey’s post hoc test. (E) Same experiment with V30M-TTR. FI value decreased in the same order as for WT-TTR. FI value of V30M-TTR was generally higher than that of WT-TTR. N = 4, mean ± S.E.; *, p < 0.05; **, p < 0.005; ANOVA with Tukey’s post hoc test.
FIGURE 3
FIGURE 3
EVs derived from human serum contain TTR, and purified TTR binds to the serum EVs. (A) Analysis of EVs derived from serum (S-EVs) by NanoSight (Raw mode). The particle concentration was 4.15 × 10¹⁰ ± 3.30 × 10⁹. (B) Multiple molecular weight TTR and TTR aggregates were detected in western blotting analysis of serum and S-EVs. (C) Mixture of S-EVs or Elution Buffer and purified TTR in static conditions for 48 h used for western blotting analysis. V30M-TTR with or without S-EVs exhibited ladder bands. (D) Remaining samples were used for EV ELISA. S-EVs with V30M-TTR showed the highest absorbance. S-EVs with WT-TTR also exhibited an increase in absorbance, whereas TTR without EVs showed little increase in absorbance. N = 3, mean ± S.E.; **, p < 0.005; n.s., not significant, ANOVA with Tukey’s post hoc test. (E) S-EVs in PBS were imaged with HS-AFM. EV particles were observed fixed to the substrate. Particles were mainly smaller than those confirmed by Nanosight. (F) Change in S-EV particle height over time under five conditions. Height of serum EVs increased in a time-dependent and TTR-concentration-dependent manner. Acid buffer (Acid). All AFM movies were taken at 250 ms/frame. Scanning area was 100 × 100 nm2 with 80 × 80 pixels. (G) Time course of 2D correlation coefficients of the surface of EVs under the above five conditions. The 2D correlation coefficient calculation has been described in the Materials and Methods “Analysis of HS-AFM Images” section in detail. The addition of TTR and an increase in TTR concentration reduced amplitude of the EV surface.
FIGURE 4
FIGURE 4
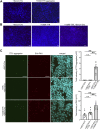
EVs promote the cell deposition of V30M-TTR, and S-EVs change the degree of TTR aggregation and deposition of TTR aggregates on cell lines. (A) TTR aggregates spread on HEK293T. Deposited TTR aggregates were detected by the biotinylated TTR aggregate antibody as red fluorescence in immunocytochemistry. Bars: 100 μm. (B) Purified V30M-TTR monomer, V30M-TTR monomer with S-EVs, and S-EVs spread on HEK293T. HEK293T showed red fluorescence in only V30M-TTR with S-EVs in appearance. Bars: 100 μm. (C) Purified TTR monomer with 293T-EVs, V30M-TTR monomer with 293T-EVs, and 293T-EVs spread on HEK293T. PKH26-labeled 293T-EVs and purified TTR protein (WT or V30M) were mixed and incubated with 293T cells at 37°C for 24 h. The uptake efficiency of EVs was quantified by PKH (right panel), and TTR aggregates were quantified using anti-aggregated TTR antibody (right panel). TTR aggregates were observed only in the presence of V30M-TTR and EVs under this condition. HEK293T showed green fluorescence in only V30M-TTR with 293T-EVs in appearance. Red fluorescence is indicated PKH-labeled EVs that is purified by ultracentrifugation and Magcapture followed by Exosome Spin Columns. Bars: 40 μm. N = 10, mean ± S.E.; **, p < 0.001; n.s., not significant, ANOVA with Tukey’s post hoc test.
FIGURE 5
FIGURE 5
TTR in Serum-derived EVs is reduced in patients with ATTRv amyloidosis. (A) Western blotting analysis of S-EVs derived from patients and controls. TTR ladder bands were more obvious in the controls than in the patients. (B) EV ELISA using serum of controls and patients. Absorbance of TTR aggregates was significantly higher in the healthy controls than in the patients with ATTRv amyloidosis, whereas absorbance of CD63 was significantly higher in the patients than in the healthy controls. N = 6, mean ± S.E.; *, p < 0.05; **, p < 0.005, Mann–Whitney U test. (C) A model of EV-mediated V30M-TTR cell deposition. TTR is mainly produced by the liver and secreted into the bloodstream, but the majority of patients with ATTRv amyloidosis produce TTR with the V30M mutation, which promotes aggregation of V30M-TTR on the membranes of Serum-derived EVs and facilitates deposition on cells and other surfaces, resulting in reduced TTR in Serum-derived EVs for patients with ATTRv amyloidosis. Increasing the amount of EVs in patients with ATTRv amyloidosis could further promote this deposition.

Similar articles

Cited by

References

    1. Agostinho P., A. Cunha R., Oliveira C. (2010). Neuroinflammation, Oxidative Stress and the Pathogenesis of Alzheimers Disease. Cpd 16, 2766–2778. 10.2174/138161210793176572 - DOI - PubMed
    1. Ando T., Uchihashi T., Kodera N. (2013). High-speed AFM and Applications to Biomolecular Systems. Annu. Rev. Biophys. 42, 393–414. 10.1146/annurev-biophys-083012-130324 - DOI - PubMed
    1. Ando Y., Suhr O., el-Salhy M. (1998). Oxidative Stress and Amyloidosis. Histol. Histopathol 13, 845–850. 10.14670/HH-13.845 - DOI - PubMed
    1. Bachurski D., Schuldner M., Nguyen P.-H., Malz A., Reiners K. S., Grenzi P. C., et al. (2019). Extracellular Vesicle Measurements with Nanoparticle Tracking Analysis - an Accuracy and Repeatability Comparison between NanoSight NS300 and ZetaView. J. Extracellular Vesicles 8, 1596016. 10.1080/20013078.2019.1596016 - DOI - PMC - PubMed
    1. Bezerra F., Saraiva M. J., Almeida M. R. (2020). Modulation of the Mechanisms Driving Transthyretin Amyloidosis. Front. Mol. Neurosci. 13, 592644. 10.3389/fnmol.2020.592644 - DOI - PMC - PubMed