

Cgmquantify: Python and R Software Packages for Comprehensive Analysis of Interstitial Glucose and Glycemic Variability from Continuous Glucose Monitor Data
- PMID: 35402978
- PMCID: PMC8901031
- DOI: 10.1109/OJEMB.2021.3105816
Cgmquantify: Python and R Software Packages for Comprehensive Analysis of Interstitial Glucose and Glycemic Variability from Continuous Glucose Monitor Data
Abstract
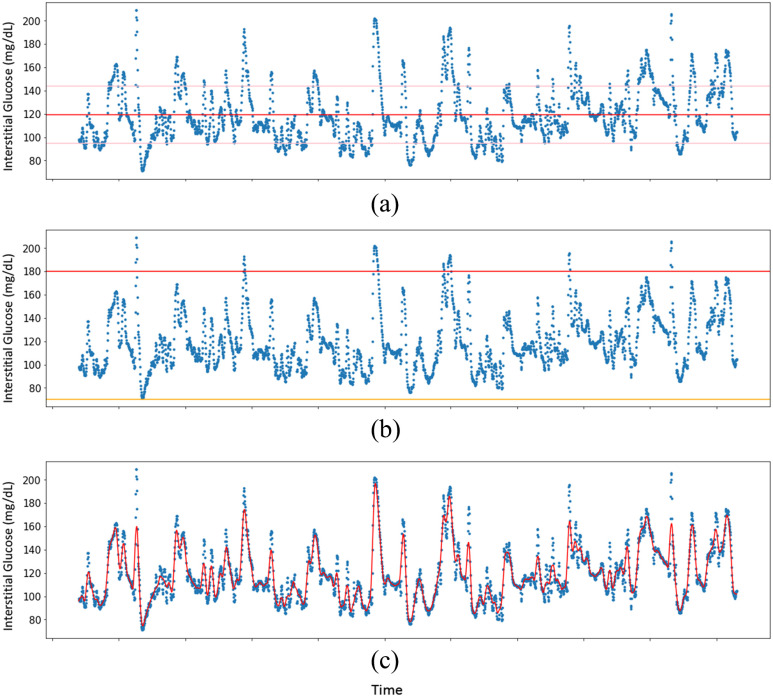
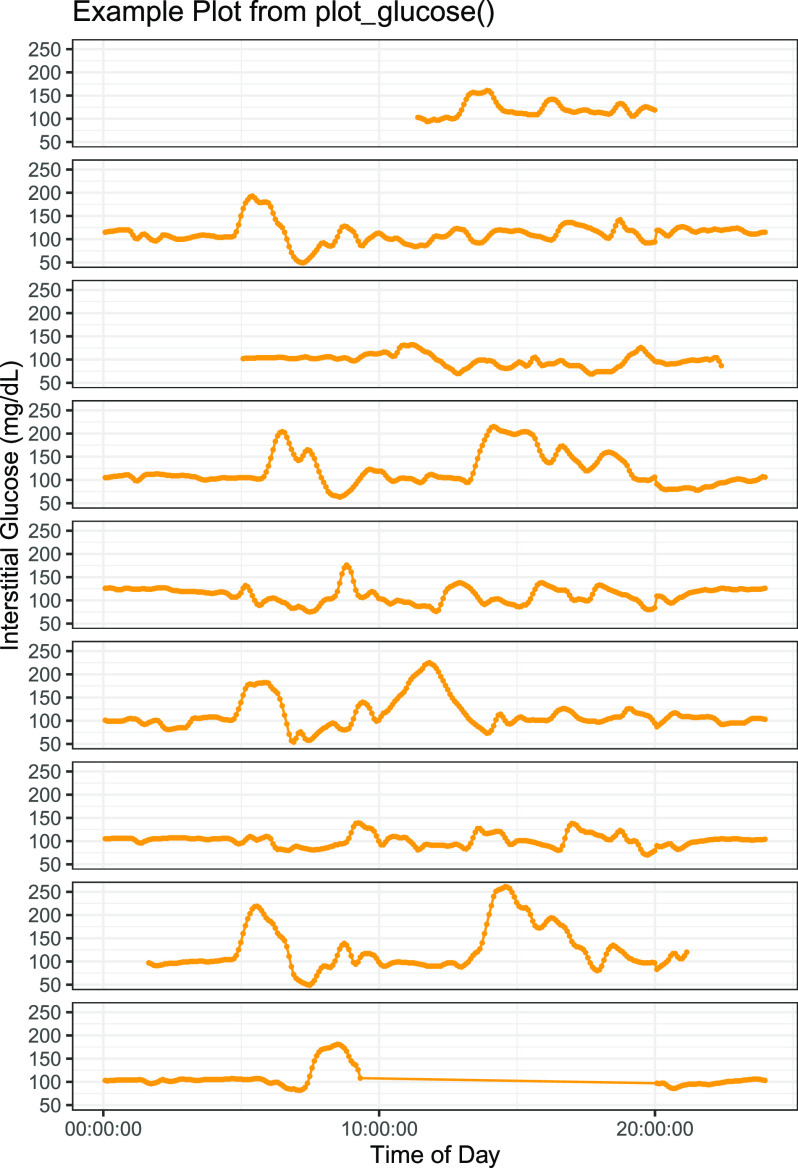
Goal: Continuous glucose monitoring (CGM) is commonly used in Type 1 diabetes management by clinicians and patients and in diabetes research to understand how factors of longitudinal glucose and glucose variability relate to disease onset and severity and the efficacy of interventions. CGM data presents unique bioinformatic challenges because the data is longitudinal, temporal, and there are infinite ways to summarize and use this data. There are over 25 metrics of glucose variability used clinically and in research, metrics are not standardized, and little validation exists across studies. The primary goal of this work is to present a software resource for systematic, reproducible, and comprehensive analysis of interstitial glucose and glycemic variability from continuous glucose monitor data. Methods: Comprehensive literature review informed the clinically-validated functions developed in this work. Software packages were developed and open-sourced through the Python Package Index (PyPi) and the Comprehensive R Archive Network (CRAN). cgmquantify is integrated into the Digital Biomarker Discovery Pipeline and MD2K Cerebral Cortex. Results: Here we present an open-source software toolbox called cgmquantify, which contains 25 functions calculating 28 clinically validated metrics of glucose and glycemic variability, as well as tools for visualizing longitudinal CGM data. Detailed documentation facilitates modification of existing code by the community for customization of input data and visualizations. Conclusions: We have built systematic functions and documentation of metrics and visualizations into a software resource available in both the Python and R languages. This resource will enable digital biomarker development using continuous glucose monitors.
Keywords: Continuous glucose monitor; diabetes; digital biomarkers; glycemic variability; open-source software.
Figures
References
-
- Wolinsky H., “Continuous glucose monitors: The long and winding road to acceptance, coverage managed care magazine,” Managed Care, 2018. Accessed: Feb. 15, 2020. [Online]. Available: https://www.managedcaremag.com/archives/2018/7/continuous-glucose-monito... - PubMed
-
- Tamborlane W. V. et al., “Continuous glucose monitoring and intensive treatment of type 1 diabetes,” N. Engl. J. Med., vol. 359, no. 14, pp. 1464–1476, Oct. 2008. - PubMed
-
- “OpenAPS.org – #WeAreNotWaiting to reduce the burden of type 1 diabetes.” Accessed: Feb. 15, 2020. [Online]. Available: https://openaps.org/
