. 2022 Apr 1;3(2):101259.
doi: 10.1016/j.xpro.2022.101259. eCollection 2022 Jun 17.

Agonist and antagonist TRUPATH assays for G protein-coupled receptors

Affiliations

Agonist and antagonist TRUPATH assays for G protein-coupled receptors

Jeffrey F DiBerto et al. STAR Protoc. .

Abstract

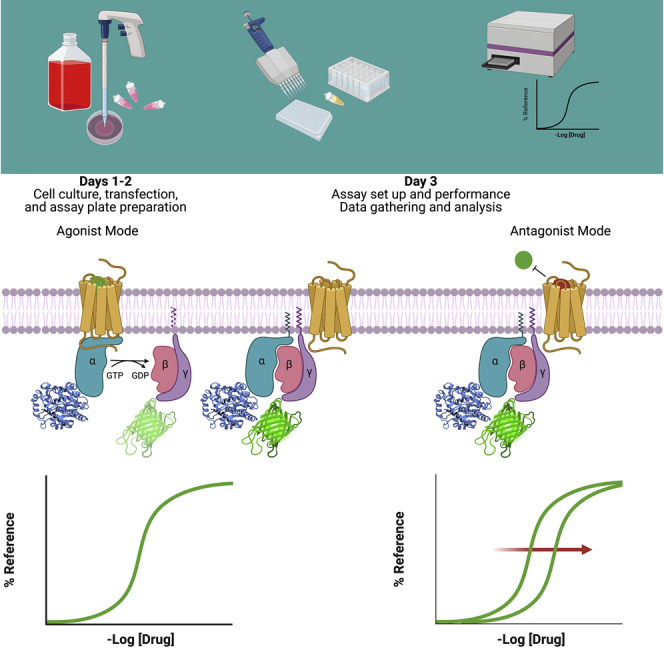
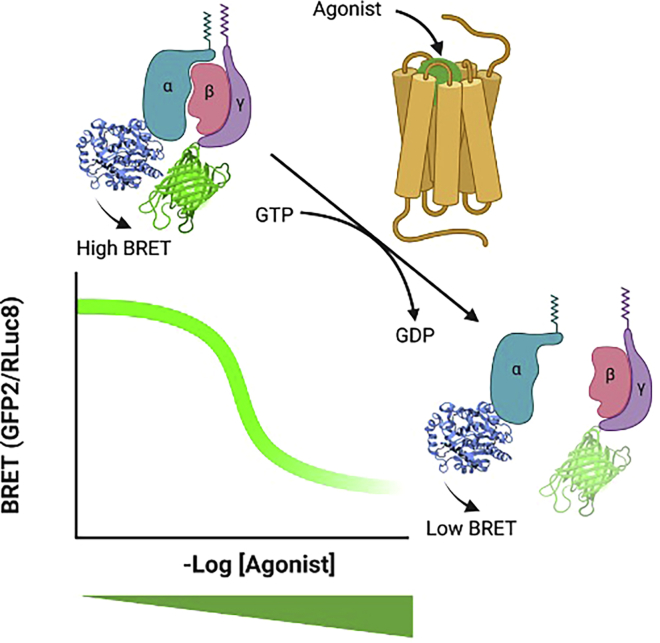
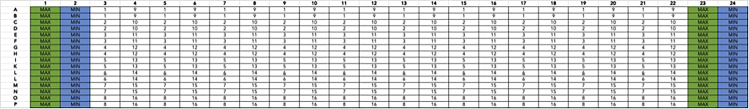
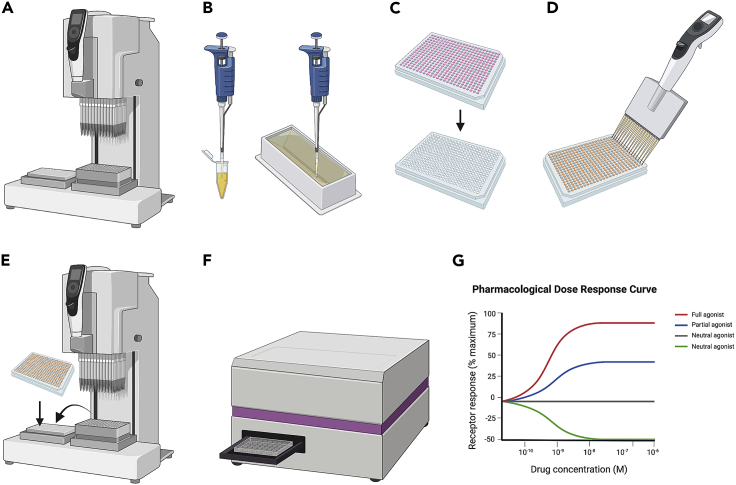
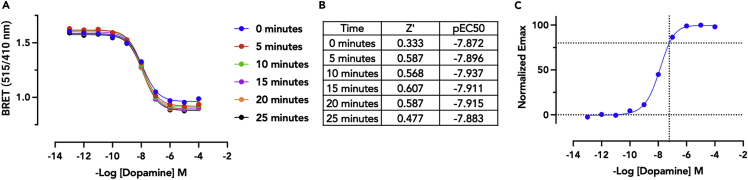
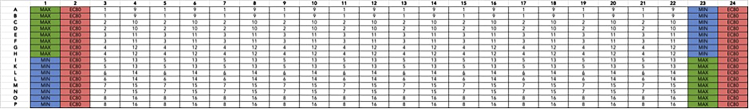
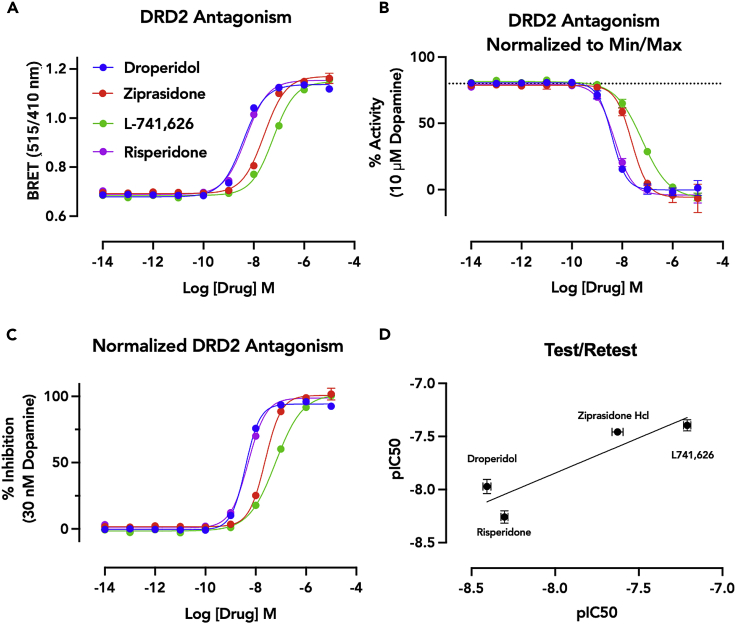
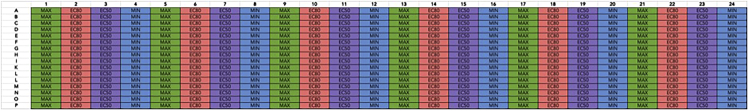
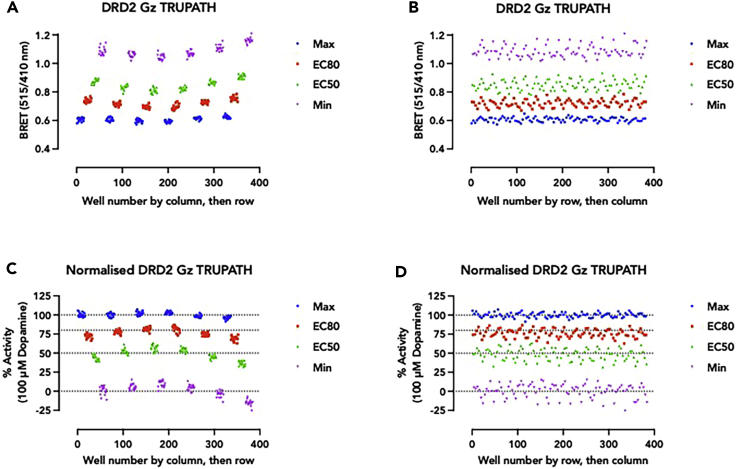
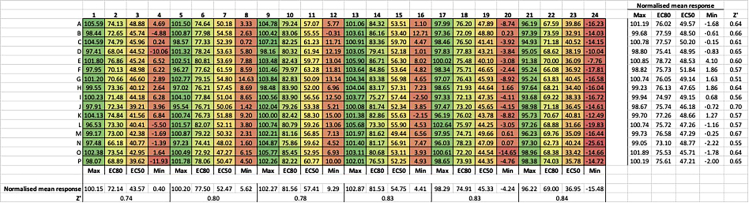
TRUPATH is a bioluminescence resonance energy transfer-based platform for quantifying G protein-coupled receptor activity via dissociation of heterotrimeric G protein biosensors. Here, we present protocols for agonist and antagonist TRUPATH assays in the 384-well plate format, thereby providing an opportunity for higher throughput. We also provide both data analysis and quality control analyses for these assays, along with considerations for assay optimization and solutions for troubleshooting needs that may be encountered. For complete details on the use and execution of this protocol, please refer to Olsen et al. (2020).

Keywords: Biotechnology and bioengineering; Cell Biology; Cell-based Assays; High Throughput Screening; Molecular Biology; Molecular/Chemical Probes; Signal Transduction.


Conflict of interest statement

J.F.D., R.H.J.O., and B.L.R. are co-inventors of the TRUPATH platform for which the University of North Carolina at Chapel Hill has filed a patent.

Figures

None
Graphical abstract
Figure 1
Figure 1
An overview of the TRUPATH platform Gα subunits fused to RLuc8 and Gγ subunits fused to GFP2 produce a BRET signal (calculated as the ratio of GFP2 to RLuc8 counts) in the presence of RLuc8 substrate that is both spatially- and orientationally-dependent. Under basal conditions, when the G protein heterotrimer is associated, this BRET signal is high. Agonist-induced receptor activation catalyzes the exchange of guanosine diphosphate for guanosine triphosphate, resulting in dissociation of the Gα subunit from the Gβγ heterodimer, and a decrease in the BRET signal that is sensitive to changes in agonist concentration.
Figure 2
Figure 2
Initial cell culture and transfection (A) Cells are removed from the tissue culture incubator are dislodged from the tissue culture dish with Trypsin-EDTA and manual disruption following aspiration of the cell media. (B and C) (B) Cells are then gently centrifuged, media aspirated, (C) resuspended, and seeded into a new 10-cm tissue culture dish. (D and F) (D) DNA are diluted in OptiMEM (pink liquid) and incubated with TransIT-2020 (gray liquid) for 20 min before (E) DNA complexes are added drop-wise to the HEK293T cells from earlier and subsequently (F) returned to the tissue-culture incubator for incubation.
Figure 3
Figure 3
Preparation of the assay plate (A) Cells are removed from the tissue culture incubator are dislodged from the tissue culture dish with Versene and manual disruption following aspiration of the cell media. (B–D) (B) Cells are then gently centrifuged, media aspirated, (C) resuspended and diluted to a density between 375 to 625 cells/μL, and (D) seeded into a Poly-L-Lysine coated 384-well tissue culture plate before being returned to the tissue-culture incubator.
Figure 4
Figure 4
Drug plate format for 16 interleaved 10-point concentration-response curves in technical duplicate Min and max columns represent negative (DMSO, minimum response) and positive (maximal concentration of reference agonist) controls. For this experiment, 300 μM of dopamine in 0.99% DMSO (3×, final concentration of 100 μM, 0.33% DMSO) was used as the maximum control. Full-log dilutions of dopamine starting at 300 μM (100 μM) were used to create the curve in this experiment, but alternate dilutions schemes can be used as well. Drug plates prepared by the Echo acoustic dispenser performs dilutions by seeding low volumes of compound solution and back-filling with DMSO.
Figure 5
Figure 5
Running the assay (A) Compounds are resuspended using an Integra VIAFLO to transfer drug buffer to the drug plate from Figure 4. (B) Renilla Luciferase substrate (e.g., Prolume Purple) is resuspended in methanol to 1 mM and diluted in assay buffer to 7.5 μM. (C–F) (C) Media is removed by manual ejection from the tissue culture plate from Figure 2 and (D) replaced with diluted luciferase substrate (E). Resuspended compounds are added to the tissue culture plate containing transfected cells and substrate before (F) being loaded into the plate reader. (G) Finally, data are analyzed.
Figure 6
Figure 6
Data acquisition and analysis, agonist mode (A) BRET2 concentration response curves across 25 min. A decrease in BRET indicates a decrease in the associated (inactive) heteroterimeric G protein complexes (i.e., agonism of the DRD2 receptor). BRET ratio (515/405) is plotted on the Y axis with concentration of dopamine on the X axis. Data represent an average of 32 technical replicates (full plate) with SEM. (B) Table of Z′ and pEC50 values showing a robust assay. (C) Normalized concentration-response-curve from the 20-min time-point from panel A. Intersection of dotted-lines indicates the estimated concentration at the 80% point on the 4-parameter fitted curve. In this experiment the EC80 was estimated as 60 nM. After multiple internal replicates we identified a typical EC80 concentration of 30 nM.
Figure 7
Figure 7
Antagonist drug plate format for 16 interleaved 10-point concentration-response curves in technical duplicate Min and max wells represent negative (DMSO, minimum response) and positive (maximal concentration of reference agonist) controls. For this experiment, 300 μM of dopamine in 0.99% DMSO (3×, final concentration of 100 μM, 0.33% DMSO) was used as the maximum control. EC80 wells represent 90 nM of dopamine (30 nM final concentration). Test antagonist wells also contained this EC80 concentration of DMSO. Full-log dilutions of test antagonists starting at 30 μM (10 μM final) were used to create the curve. Droperidol (1–4), Ziprasidone HCl (5–8), L741,626 (9–12), and Risperidone (13–16) were used as test antagonists in this experiment. Drug plates prepared by the Echo acoustic dispenser performs dilutions by seeding low volumes of compound solution and back-filling with DMSO.
Figure 8
Figure 8
Data acquisition and analysis, antagonist mode (A) BRET data showing an increase in association of the heterotrimeric G protein complex with increasing concentration of test antagonists. These data reflect a functional competition with the EC80 concentration of dopamine. Data represent an average of 8 technical replicates with SEM. (B) A representation of the activity of dopamine in the test-agonist wells. The dashed line indicates 80% of the maximal response of 10 uM dopamine. At diminishing concentrations of antagonist the activity of the 30 nM of dopamine can be resolved in the upper asymptote. The lower asymptote reflects complete antagonism of the the EC80 (30 nM dopamine) signal. Z′ for this assay was 0.690. (C) Concentration-response-curves of the test antagonists normalized. (D) Test/Retest plot of pIC50s of the test antagonists from two temporally separated biological replicates, with an R2 of 0.824.
Figure 9
Figure 9
Drug plate layout containing 4 assay signals in repeating columns Max and Min columns represent positive (maximal concentration of reference agonist) and negative (DMSO, minimum response) controls. EC80 and EC50 columns represent the concentration of reference agonist that produces 80% and 50% maximal responses, respectively. For this experiment, 300 μM of dopamine in 0.99% DMSO (final concentration of 100 μM, 0.33% DMSO) was used as the Max control, 90 nM of dopamine in 0.99% DMSO (final concentration of 30 nM, 0.33% DMSO) as EC80 signal, and 12 nM of dopamine in 0.99% DMSO (final concentration of 4 nM, 0.33% DMSO) as EC50 signal.
Figure 10
Figure 10
Human DRD2 Gz TRUPATH assay plate uniformity assessment A decrease in BRET ratio (515/410) indicates dissociation of heterotrimeric G protein complexes (i.e., agonism of the DRD2 receptor). (A and B) (A) BRET ratios of the 4 signal conditions plotted by well number by column, then row, and (B) well number by row, then column. (C and D) (C) Normalised BRET ratio (normalised to min and max) plotted by well number by column, then row and (D) by row, then column. The data shown is the response from every well in a 384-well plate 30 min post-drug addition and dopamine was used at 100 μM for Max, 30 nM for EC80 and 4 nM for EC50 final concentrations.
Figure 11
Figure 11
Normalized responses from the plate uniformity assessment with signal condition averages and Z′ statistics by row and column
Figure 12
Figure 12
Example data from an agonist-mode concentration-response curve pairing dopamine and the DRD2 receptor Data are presented with a heatmap to exemplify both the variability and the magnitude of changing ratio. Layout reflects the design from Figure 3. (A) Fluorescence counts from the GFP2 acceptor protein as measured using a 515-530 nM filter. (B) Luminescence counts from the oxidation of Prolume Purple by RLuc8 as measured using a 410/480 nM filter. (C) The BRET ratio, calculated by taking the ratio of the acceptor counts (A) to the donor counts (B).

Similar articles

Cited by

References

    1. Chakraborty S., Uprety R., Daibani A.E., Rouzic V.L., Hunkele A., Appourchaux K., Eans S.O., Nuthikattu N., Jilakara R., Thammavong L., et al. Kratom alkaloids as probes for opioid receptor function: pharmacological characterization of minor indole and oxindole alkaloids from kratom. ACS Chem. Neurosci. 2021;12:2661–2678. - PMC - PubMed
    1. Chakraborty S., DiBerto J.F., Faouzi A., Bernhard S.M., Gutridge A.M., Ramsey S., Zhou Y., Provasi D., Nuthikattu N., Jilakara R., et al. A novel mitragynine analog with low-efficacy mu opioid receptor agonism displays antinociception with attenuated adverse effects. J. Med. Chem. 2021;64:13873–13892. - PMC - PubMed
    1. Chao M.L., Luo S., Zhang C., Zhou X., Zhou M., Wang J., Kong C., Chen J., Lin Z., Tang X., et al. S-nitrosylation-mediated coupling of G-protein alpha-2 with CXCR5 induces Hippo/YAP-dependent diabetes-accelerated atherosclerosis. Nat. Commun. 2021;12:4452. - PMC - PubMed
    1. Cao C., Kang H.J., Singh I., Chen H., Zhang C., Ye W., Hayes B.W., Liu J., Gumpper R.H., Bender B.J., et al. Structure, function and pharmacology of human itch GPCRs. Nature. 2021;600:170–175. - PMC - PubMed
    1. Du J., Wang D., Fan H., Xu C., Tai L., Lin S., Han S., Tan Q., Wang X., Xu T., et al. Structures of human mGlu2 and mGlu7 homo- and heterodimers. Nature. 2021;594:589–593. - PubMed

Publication types

MeSH terms

Substances

LinkOut - more resources