. 2022 Apr 5;3(1):139-157.
doi: 10.1089/neur.2021.0061. eCollection 2022.

Empowering Data Sharing and Analytics through the Open Data Commons for Traumatic Brain Injury Research

Affiliations

Empowering Data Sharing and Analytics through the Open Data Commons for Traumatic Brain Injury Research

Austin Chou et al. Neurotrauma Rep. .

Abstract

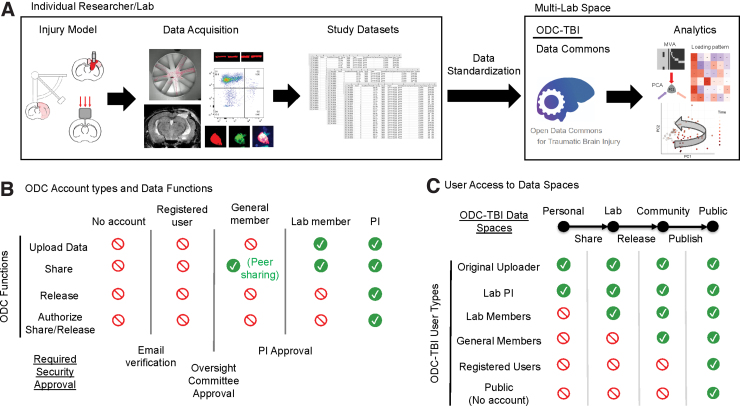
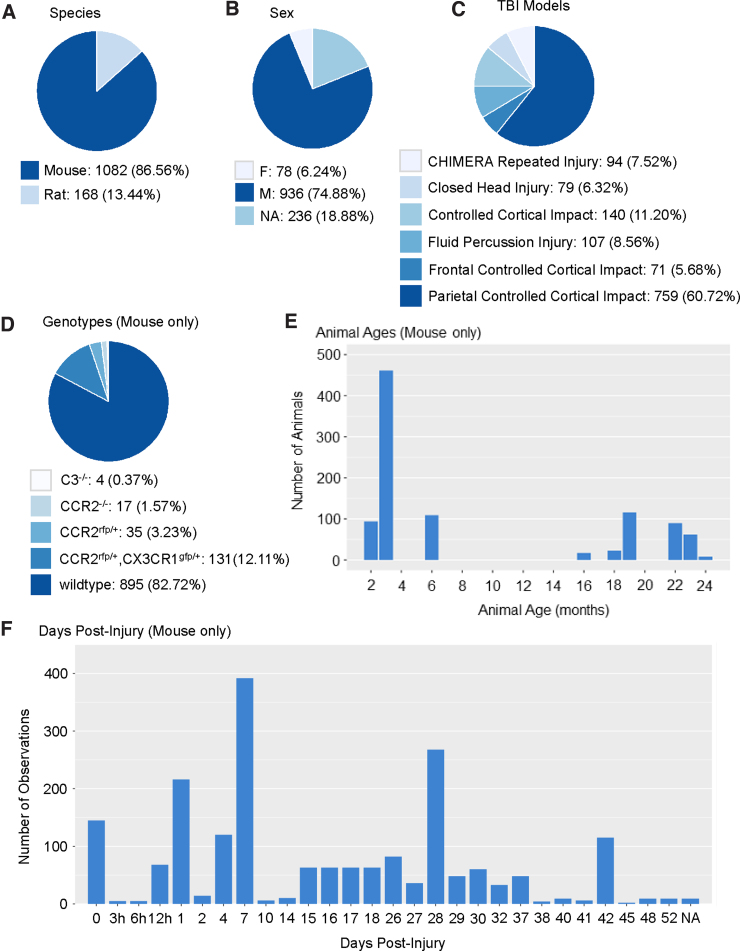
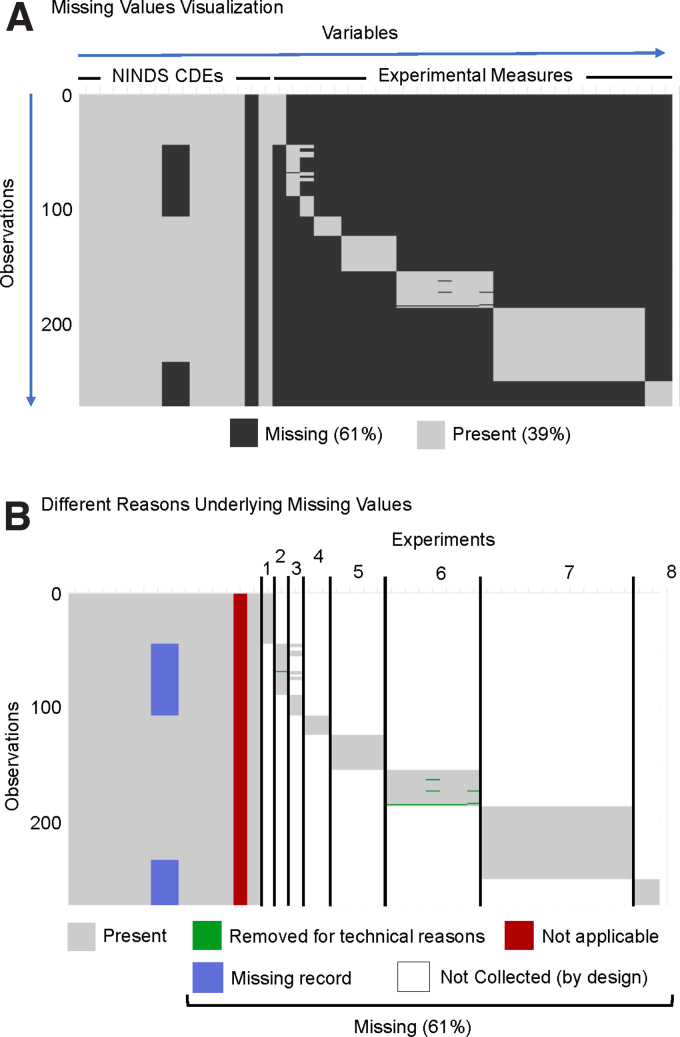
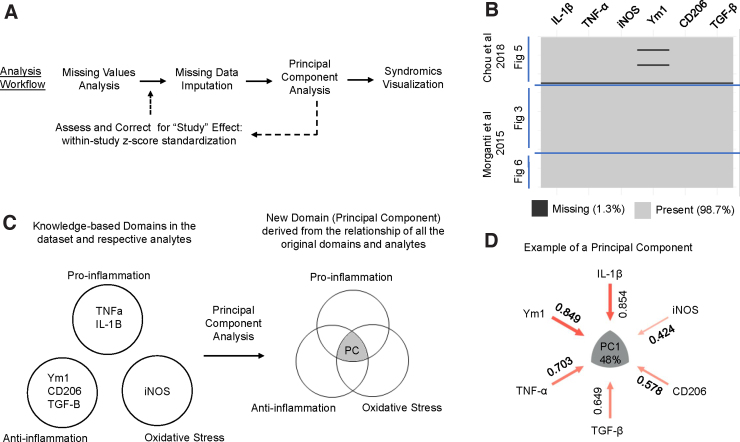
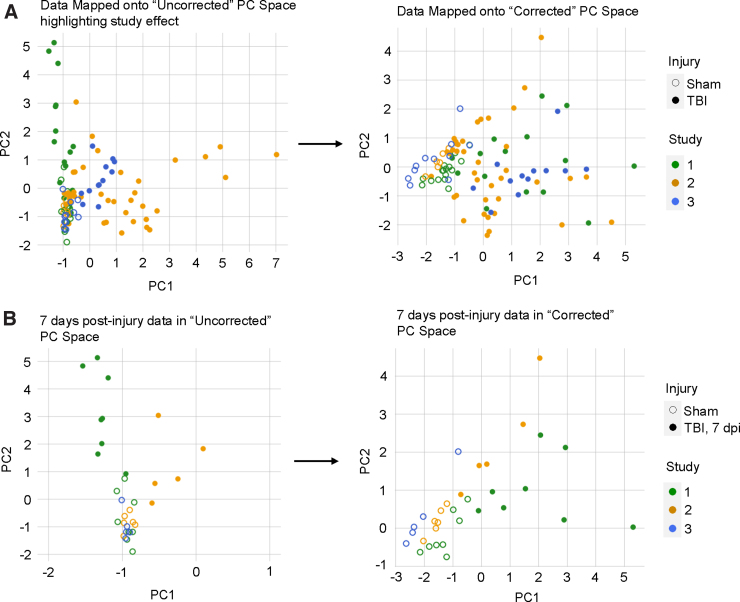
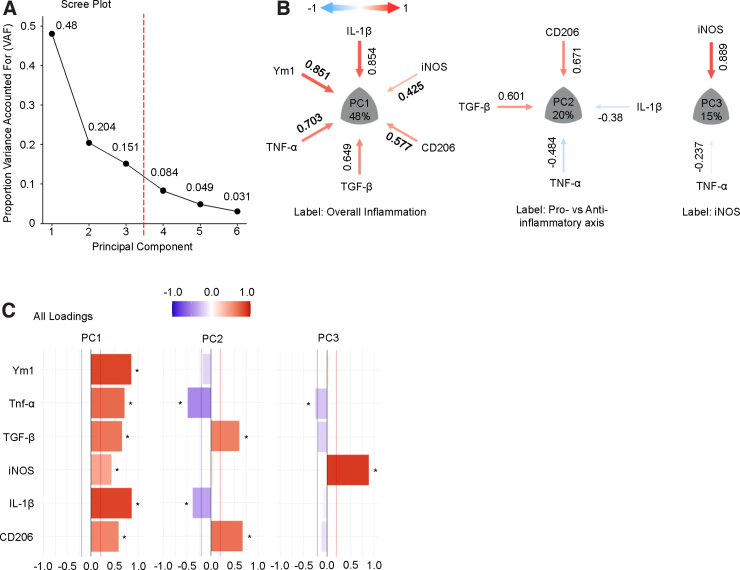
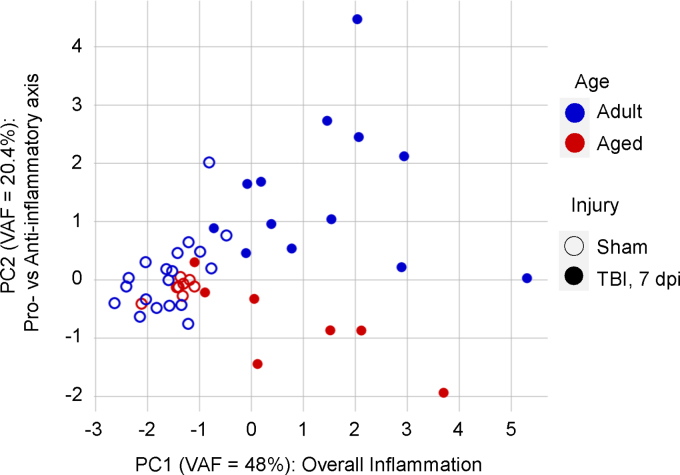
Traumatic brain injury (TBI) is a major public health problem. Despite considerable research deciphering injury pathophysiology, precision therapies remain elusive. Here, we present large-scale data sharing and machine intelligence approaches to leverage TBI complexity. The Open Data Commons for TBI (ODC-TBI) is a community-centered repository emphasizing Findable, Accessible, Interoperable, and Reusable data sharing and publication with persistent identifiers. Importantly, the ODC-TBI implements data sharing of individual subject data, enabling pooling for high-sample-size, feature-rich data sets for machine learning analytics. We demonstrate pooled ODC-TBI data analyses, starting with descriptive analytics of subject-level data from 11 previously published articles (N = 1250 subjects) representing six distinct pre-clinical TBI models. Second, we perform unsupervised machine learning on multi-cohort data to identify persistent inflammatory patterns across different studies, improving experimental sensitivity for pro- versus anti-inflammation effects. As funders and journals increasingly mandate open data practices, ODC-TBI will create new scientific opportunities for researchers and facilitate multi-data-set, multi-dimensional analytics toward effective translation.

Keywords: FAIR principles; Open Data Commons; data sharing; multi-variate analysis; principal component analysis; traumatic brain Injury.


Conflict of interest statement

No competing financial interests exist.

Figures

FIG. 1.
FIG. 1.
Open Data Commons for Traumatic Brain Injury (ODC-TBI) data flow and accessibility summary. (A) Experiments are currently carried out by individual researchers and labs. Resulting data sets are commonly preserved within lab resources (e.g., hard drives, lab notebooks, etc.). The ODC-TBI provides documentation and guidance to help standardize data sets with respect to NINDS-defined pre-clinical Common Data Elements (CDEs). Data sets from multiple labs and centers can then be uploaded into the ODC-TBI and shared and combined for further analysis. (B) The ODC-TBI has five user types with three steps for security. Each user type has different available functions on the site. After an e-mail verification and approval by the ODC-TBI committee to ensure that the user is a researcher in the TBI field, they become a general member. They can then join or create a lab, which requires the lab PI's approval. Lab members can upload and share their data within the lab they have joined. Last, PI-level users can also initiate the data set release/publication process, increasing the accessibility of their data to others outside of their lab. (C) The ODC-TBI consists of four Data Spaces. Each Data Space has different levels of accessibility. Data sets are delegated to a Personal space when they are first uploaded; Personal data sets are accessible only to the uploader and their lab PI. Data sets are shared into the Lab space where they can be accessed by anyone in the lab. Data sets can be released into the Community space where other general members can access them. Last, PIs can publish their data sets, which will make the data set accessible to the general public as citable units of research with unique digital object identifiers. NINDS, National Institute of Neurological Disorders and Stroke; PI, Principal Investigator.
FIG. 2.
FIG. 2.
Descriptive summaries of data aggregated from 11 pre-clinical TBI publications from the UCSF on the ODC-TBI. (A) The 11 data sets constituted data from 1250 unique animals, with the majority being mice. (B) The majority of subjects were male, with a small proportion of female, animals. Notably, 18.9% of the subjects were missing records of male or female. (C) The primary TBI model utilized was the controlled cortical impact model with the greatest representation by parietal injuries. There were also a smaller number of fluid percussion injury subjects, closed TBI subjects, and repeated closed-TBI models using the CHIMERA impactor. (D) Of the mice subjects, the predominant genotype was wild type. The remaining mouse models included C3-knockout, CCR2-knockout, CCR2-rfp transgenic, and CX3CR1-gfp and CCR2-rfp transgenic animals. These transgenics reflected the interest in inflammatory pathways after TBI in the publications. (E) Mice subjects' age at time of injury showed a bimodal distribution encompassing young (2–6 months) and old (16+ months) animals. Age distribution reflected the focus on the effect of aging on TBI processes. (F) Data were collected at a variety of time points from the mice experiments. Time points with the greatest number of observations were 0 days post-injury (dpi), 1 dpi, 7 dpi, and 28 dpi. The breadth of time points reflected time-course studies as well as the interest in both acute and chronic effects of TBI in the studies. C3, complement C3; CCR2, C-C motif chemokine receptor 2; CX3CR1, C-X3-C motif chemokine receptor 1; CHIMERA, closed-head impact model of engineered rotational acceleration; F, female; M, male; NA, not applicable; TBI, traumatic brain injury; UCSF, University of California San Francisco.
FIG. 3.
FIG. 3.
Missing value visualizations of Chou and colleagues (2018). (A) Typical missing value visualization shows which elements (i.e., cells) contain a value and which do not, which are thus termed missing. The uploaded data showed generally low missingness for variables (i.e., columns) corresponding to NINDS CDEs and fairly high missingness for variables corresponding to collected experimental measures. Each row corresponded to an observation, in this case a single animal subject. (B) Types of missingness were manually color-coded based on the type of missingness. The majority of the missing values were “Not Collected (by design)”; the data set constituted eight separate experiments, and experimental outcomes were specifically collected for subjects belonging to one experiment. The result was an extremely sparse data set by design. Another source of missingness was when a variable is “Not applicable,” which we expect in cases when a NINDS-defined CDE is not applicable to the study design. In this example, no treatments were given, so the treatment CDE column was entirely missing values. Data could also be irrecoverable because of “Missing records,” such as the subject's sex in this example and as reflected in Figure 2B. Last, data from experiments could also have been “Removed due to technical reasons.” CDEs, Common Data Elements; NINDS, National Institute of Neurological Disorders and Stroke.
FIG. 4.
FIG. 4.
Multi-dimensional analytics use case. (A) We implemented an analysis workflow including missing values analysis, missing data imputation, principal component analysis (PCA), and syndromic visualizations. After an initial analysis, we implemented an additional z-score standardization step before data imputation to correct for a study effect. (B) Data were aggregated from three experiments (figures) from two articles: Chou and colleagues (2018) and Morganti and colleagues (2015)., Visualization of the missing data show that 1.3% of the data set was missing values. Notably, one entire row was entirely missing, and the other two missing values were from the Ym1 variable. (C) Conceptual representation of PCA. The original variables (TNF-α, IL-1β, Ym1, CD206, TGF-β, and iNOS) can be categorized into the domains of proinflammation, anti-inflammation, and oxidative stress based off of existing knowledge. PCA is an unsupervised method that captures the underlying relationship between the variables—and thus the relationship between the represented knowledge domains—to derive new latent cross-domain features from the data. (D) The derived PC can be represented as a syndromic plot that visualizes the contributions (i.e., loadings) of each variable to the PC. Further, the PC captures a portion of the variance in the data, which is reflected by the percentage value in the center of the syndromic plot. In the example PC, 48% of the variance in the data set was accounted for, and all six of the variables were loading positively. CD206, cluster of differentiation 206; IL-1β, interleukin 1 beta; iNOS, inducible nitric oxide synthase; PC, principal component; TGF-β, transforming growth beta; TNF-α, tumor necrosis factor alpha; Ym1, Ym1 chitinase-like protein.
FIG. 5.
FIG. 5.
Change in PC scores after correcting for study. (A) Data points mapped onto PC space (i.e., PC1 and PC2) grouped by Study and Injury groups. In the uncorrected PC space, PC1 primarily captured the variance from study 2 whereas PC2 primarily captured the variance from study 1 (left). Two-way ANOVA revealed significant main effects of Study and Injury and significant interaction along both PC1 and PC2. After correcting for study, PC1 primarily captured the variance between sham and TBI samples, and neither PC1 nor PC2 appeared to represent the variance from a single study (right). Two-way ANOVA revealed only a significant main effect of Injury along PC1. (B) Data points for animals belonging to similar experimental groups mapped onto the uncorrected and study-corrected PC spaces. Before correcting for the study effect, adult animals at 7 days post-injury (dpi) from study 1 and study 2 fell on opposite sides of the sham experimental groups (left). After correcting for study, the 7-dpi animals clustered more closely in the PC space and exhibited similar PC1 direction in relation to sham animals (right). The variance accounted for (VAF) of the PCs additionally show that the study correction increases the VAF of PC1 and decreases the VAF of PC2. ANOVA, analysis of variance; PC, principal component; TBI, traumatic brain injury.
FIG. 6.
FIG. 6.
Syndromic visualization of the principal component analysis (PCA). (A) The scree plot after running PCA on the imputed data set revealed that the first three PCs account for 83.5% of the variance in the aggregated data set. (B) Syndromic plot visualization showed the significant variable loadings for each PC. PC1 was labeled as overall inflammation, PC2 as the pro- versus anti-inflammatory axis, and PC3 as iNOS expression. (C) The barmap visualization provides additional information, including the variable loadings that were below the threshold of significance (0.2) for each PC. The barmap denotes with an asterisk (“*”) which loadings were above the significance threshold. CD206, cluster of differentiation 206; IL-1β, interleukin 1 beta; iNOS, inducible nitric oxide synthase; PC, principal component; TGF-β, transforming growth beta; TNF-α, tumor necrosis factor alpha; Ym1, Ym1 chitinase-like protein.
FIG. 7.
FIG. 7.
Validation of results from previous studies with the aggregate analysis. Animals corresponding to sham versus TBI at 7 days post-injury and Adult (3 months) versus Aged (18+ months) experimental groups were filtered from the aggregated data set and mapped onto the study-corrected PC space. Sham animals clustered closely regardless of age. TBI significantly increased the overall inflammation (PC1; variance accounted for [VAF] = 48%) for TBI animals without a significant main effect of Age or interaction. Along PC2 (VAF = 20.4%), there were significant effects of Injury and Age as well as a significant Injury and Age interaction, suggesting that aged animals exhibited a shift toward proinflammation whereas adult animals shifted toward anti-inflammation at 7 days post-injury. PC, principal component; TBI, traumatic brain injury.

Similar articles

Cited by

References

    1. Centers for Disease Control and Prevention. (2015). Traumatic Brain Injury In the United States: Epidemiology and Rehabilitation. National Center for Injury Prevention and Control; Division of Unintentional Injury Prevention: Atlanta, GA.
    1. Dewan, M.C., Rattani, A., Gupta, S., Baticulon, R.E., Hung, Y.-C., Punchak, M., Agrawal, A., Adeleye, A.O., Shrime, M.G., Rubiano, A.M., Rosenfeld, J.V., and Park, K.B. (2018). Estimating the global incidence of traumatic brain injury. J. Neurosurg. 130, 1080–1097. - PubMed
    1. Zaloshnja, E., Miller, T., Langlois, J.A., and Selassie, A.W. (2008). Prevalence of long-term disability from traumatic brain injury in the civilian population of the United States, 2005. J. Head Trauma Rehabil. 23, 394–400. - PubMed
    1. Masel, B.E., and DeWitt, D.S. (2010). Traumatic brain injury: a disease process, not an event. J. Neurotrauma 27, 1529–1540. - PubMed
    1. Xiong, Y., Mahmood, A., and Chopp, M. (2009). Emerging treatments for traumatic brain injury. Expert Opin. Emerg. Drugs 14, 67–84. - PMC - PubMed