

Construction of a prognostic risk assessment model for lung adenocarcinoma based on Integrin β family-related genes
- PMID: 35403268
- PMCID: PMC9169214
- DOI: 10.1002/jcla.24419
Construction of a prognostic risk assessment model for lung adenocarcinoma based on Integrin β family-related genes
Abstract
Background: Integrin β (ITGB) superfamily plays an essential role in the intercellular connection and signal transmission. It was exhibited that overexpressing of ITGB family members promotes the malignant progression of lung adenocarcinoma (LUAD), but the relationship between ITGB superfamily and the LUAD prognosis remains unclear.
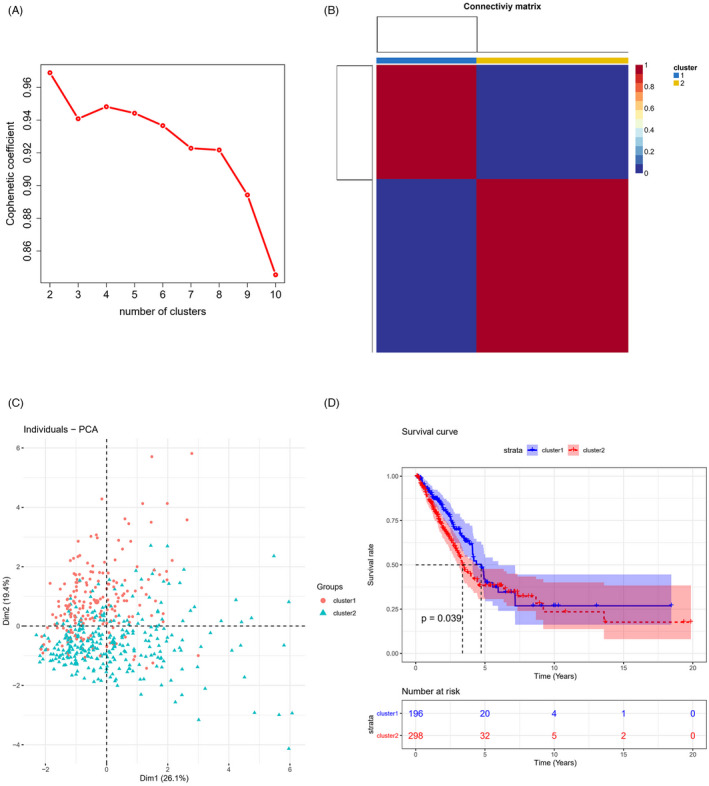
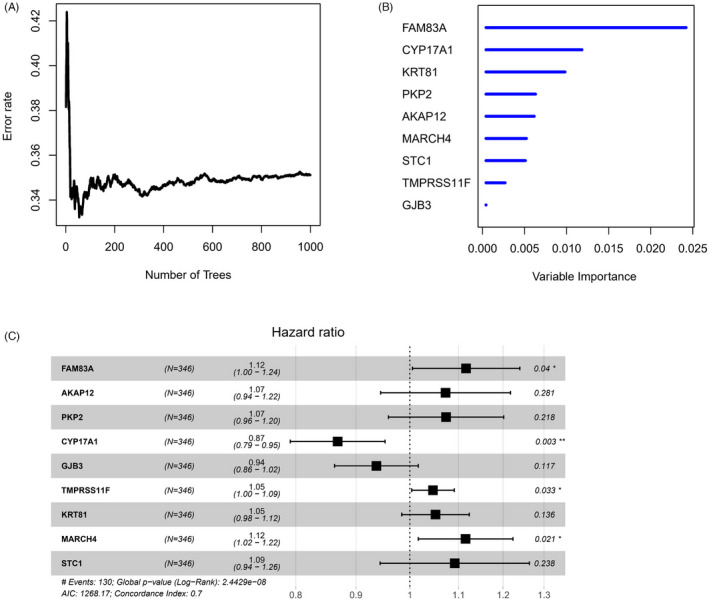
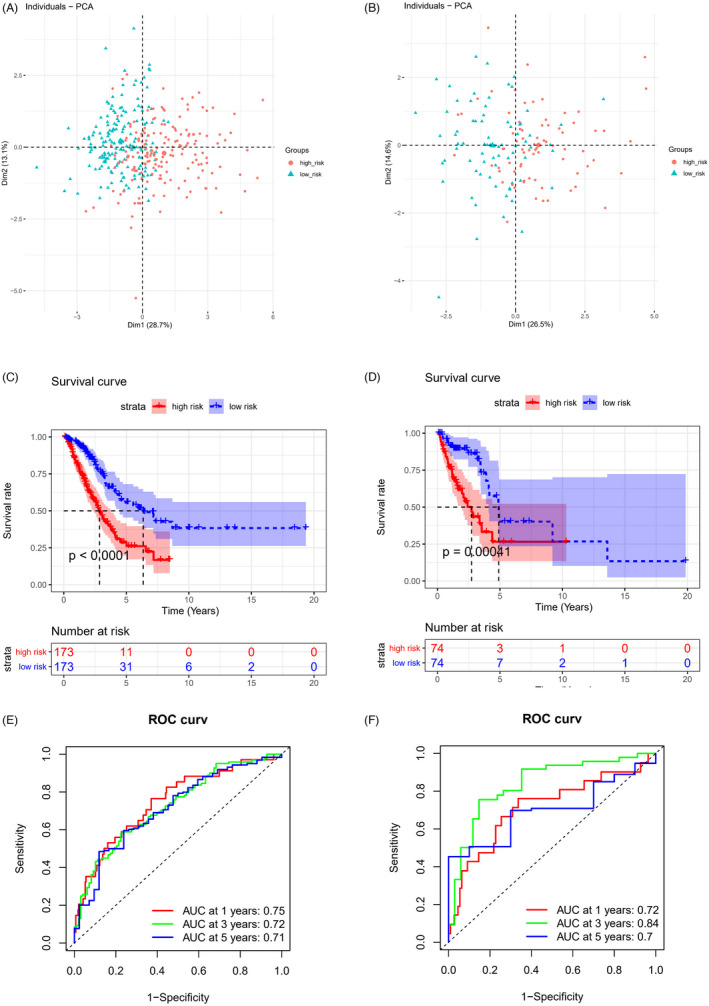
Methods: In this study, the samples were assigned to different subgroups utilizing non-negative matrix factorization clustering according to the expression of ITGB family members in LUAD. Kaplan-Meier (K-M) survival analysis revealed the significant differences in the prognosis between different ITGB subgroups. Subsequently, we screened differentially expressed genes among different subgroups and conducted univariate Cox analysis, random forest feature selection, and multivariate Cox analysis. 9-feature genes (FAM83A, AKAP12, PKP2, CYP17A1, GJB3, TMPRSS11F, KRT81, MARCH4, and STC1) in the ITGB superfamily were selected to establish a prognostic assessment model for LAUD.
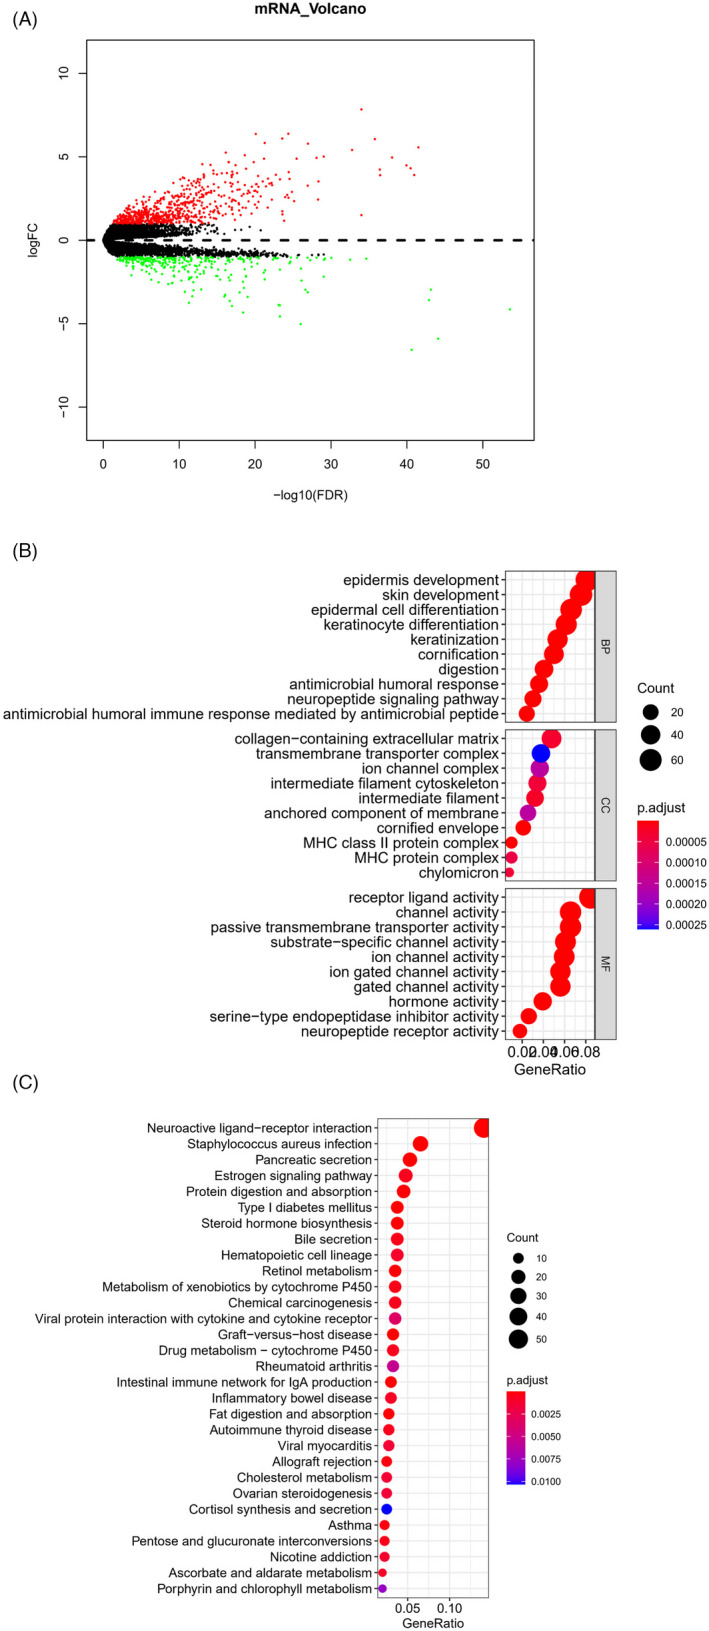
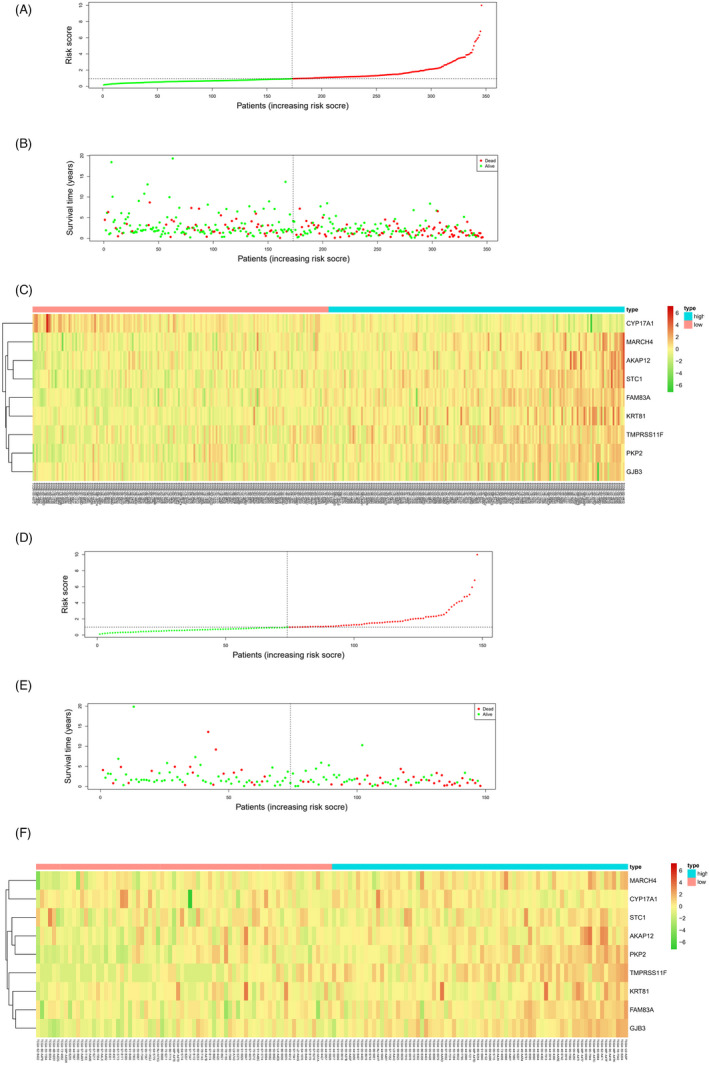
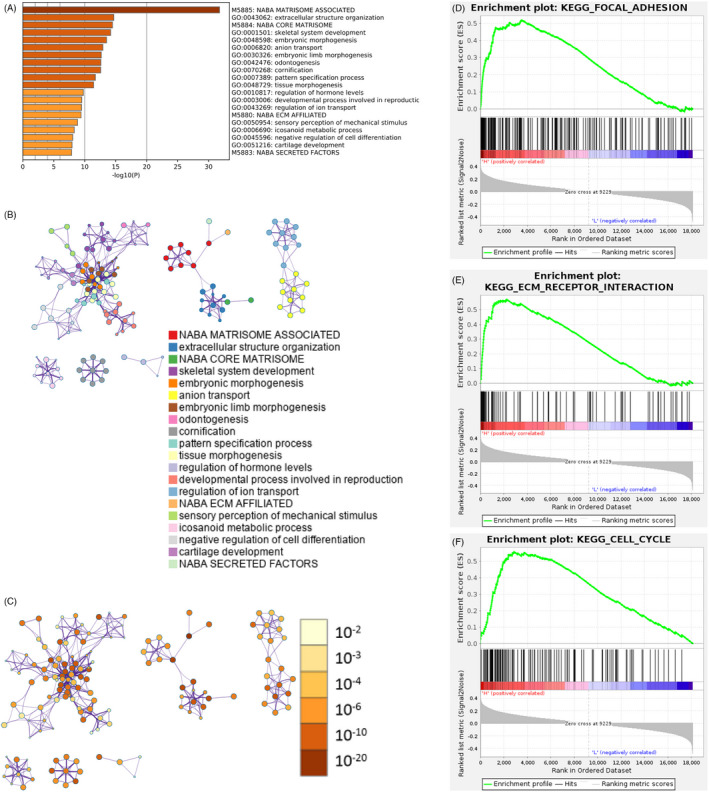
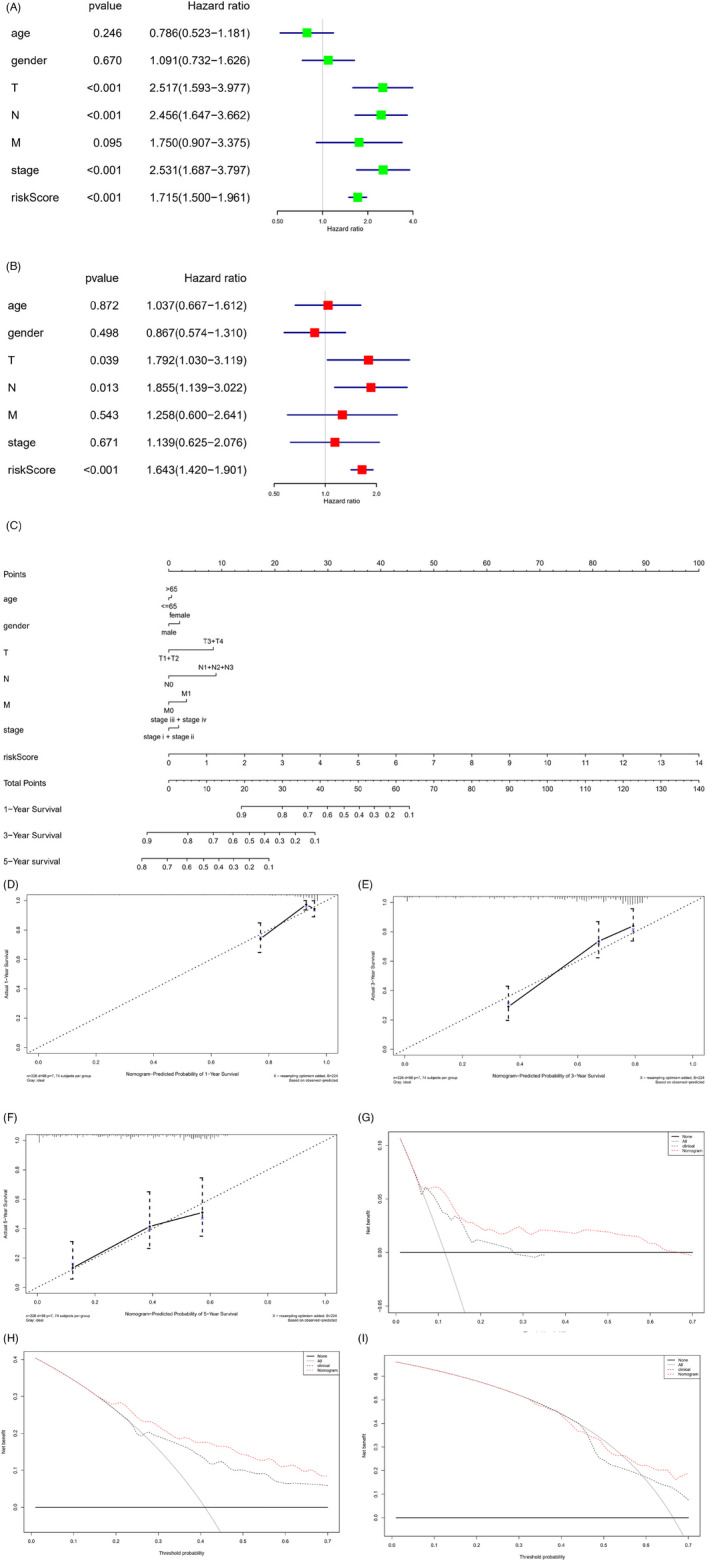
Results: In accordance with the median risk score, LUAD samples were divided into high- and low-risk groups. The receiver operating characteristic (ROC) curve of LUAD patients' survival was predicted via K-M survival curve and principal component analysis dimensionality reduction. This model was found to have a favorable performance in LUAD prognostic assessment. Gene Ontology (GO) and Kyoto Encyclopedia of Genes and Genomes (KEGG) analyses of differentially expressed genes between groups and Gene Set Enrichment Analysis (GSEA) of intergroup samples confirmed that the high- and low-risk groups had evident differences mainly in the function of extracellular matrix (ECM) interaction. Risk score and univariate and multivariate Cox regression analyses of clinical factors showed that the prognostic model could be applied as an independent prognostic factor for LUAD. Then, we draw the nomogram of 1-, 3-, and 5-year survival of LUAD patients predicted with the risk score and clinical factors. Calibration curve and clinical decision curve proved the favorable predictive ability of nomogram.
Conclusion: We constructed a LUAD prognostic risk model based on the ITGB superfamily, which can provide guidance for clinicians on their prognostic judgment.
Keywords: ITGB; NMF; lung adenocarcinoma; nomogram; prognostic model.
© 2022 The Authors. Journal of Clinical Laboratory Analysis published by Wiley Periodicals LLC.
Conflict of interest statement
The authors declare that they have no potential conflicts of interest.
Figures
Similar articles
-
Construction of a Prognostic Immune-Related LncRNA Risk Model for Lung Adenocarcinoma.Front Cell Dev Biol. 2021 Mar 18;9:648806. doi: 10.3389/fcell.2021.648806. eCollection 2021. Front Cell Dev Biol. 2021. PMID: 33869203 Free PMC article.
-
[Construction and Validation of Prognostic Risk Score Model of Autophagy Related Genes in Lung Adenocarcinoma].Zhongguo Fei Ai Za Zhi. 2021 Aug 20;24(8):557-566. doi: 10.3779/j.issn.1009-3419.2021.103.09. Epub 2021 Jul 14. Zhongguo Fei Ai Za Zhi. 2021. PMID: 34256900 Free PMC article. Chinese.
-
Hypoxia-related gene signature for predicting LUAD patients' prognosis and immune microenvironment.Cytokine. 2022 Apr;152:155820. doi: 10.1016/j.cyto.2022.155820. Epub 2022 Feb 14. Cytokine. 2022. PMID: 35176657
-
Construction and validation of a prognostic model for lung adenocarcinoma based on endoplasmic reticulum stress-related genes.Sci Rep. 2022 Nov 18;12(1):19857. doi: 10.1038/s41598-022-23852-z. Sci Rep. 2022. PMID: 36400857 Free PMC article.
-
[Construction and Validation of A Prognostic Model for Lung Adenocarcinoma Based on Ferroptosis-related Genes].Zhongguo Fei Ai Za Zhi. 2025 Jan 20;28(1):22-32. doi: 10.3779/j.issn.1009-3419.2025.102.04. Zhongguo Fei Ai Za Zhi. 2025. PMID: 39988436 Free PMC article. Chinese.
Cited by
-
Prognostic value and potential molecular mechanism of ITGB superfamily members in hepatocellular carcinoma.Medicine (Baltimore). 2023 Aug 18;102(33):e34765. doi: 10.1097/MD.0000000000034765. Medicine (Baltimore). 2023. PMID: 37603520 Free PMC article.
-
GJB3 promotes pancreatic cancer liver metastasis by enhancing the polarization and survival of neutrophil.Front Immunol. 2022 Oct 19;13:983116. doi: 10.3389/fimmu.2022.983116. eCollection 2022. Front Immunol. 2022. PMID: 36341459 Free PMC article.
-
Multi-omics analysis of expression profile and prognostic values of connexin family in LUAD.J Cancer Res Clin Oncol. 2023 Nov;149(14):12791-12806. doi: 10.1007/s00432-023-05075-5. Epub 2023 Jul 17. J Cancer Res Clin Oncol. 2023. PMID: 37458803 Free PMC article.
-
A robust six-gene prognostic signature based on two prognostic subtypes constructed by chromatin regulators is correlated with immunological features and therapeutic response in lung adenocarcinoma.Aging (Albany NY). 2023 Nov 7;15(21):12330-12368. doi: 10.18632/aging.205183. Epub 2023 Nov 7. Aging (Albany NY). 2023. PMID: 37938151 Free PMC article.
-
Defining lung adenocarcinoma subtypes with glucocorticoid-related genes and constructing a prognostic index for immunotherapy guidance.J Thorac Dis. 2025 Apr 30;17(4):1888-1905. doi: 10.21037/jtd-24-1083. Epub 2025 Apr 28. J Thorac Dis. 2025. PMID: 40400930 Free PMC article.
References
-
- Sung H, Ferlay J, Siegel RL, et al. Global cancer statistics 2020: GLOBOCAN estimates of incidence and mortality worldwide for 36 cancers in 185 countries. CA Cancer J Clin. 2021;71(3):209‐249. - PubMed
-
- Gu XY, Jiang Z, Fang W. Cryoablation combined with molecular target therapy improves the curative effect in patients with advanced non‐small cell lung cancer. J Int Med Res. 2011;39(5):1736‐1743. - PubMed
-
- Li ZH, Zhou Y, Ding YX, Guo QL, Zhao L. Roles of integrin in tumor development and the target inhibitors. Chin J Nat Med. 2019;17(4):241‐251. - PubMed
MeSH terms
Substances
LinkOut - more resources
Full Text Sources
Medical
Miscellaneous
