An alternative UPF1 isoform drives conditional remodeling of nonsense-mediated mRNA decay
- PMID: 35403729
- PMCID: PMC9108617
- DOI: 10.15252/embj.2021108898
An alternative UPF1 isoform drives conditional remodeling of nonsense-mediated mRNA decay
Abstract
The nonsense-mediated mRNA decay (NMD) pathway monitors translation termination in order to degrade transcripts with premature stop codons and regulate thousands of human genes. Here, we show that an alternative mammalian-specific isoform of the core NMD factor UPF1, termed UPF1LL , enables condition-dependent remodeling of NMD specificity. Previous studies indicate that the extension of a conserved regulatory loop in the UPF1LL helicase core confers a decreased propensity to dissociate from RNA upon ATP hydrolysis relative to UPF1SL , the major UPF1 isoform. Using biochemical and transcriptome-wide approaches, we find that UPF1LL can circumvent the protective RNA binding proteins PTBP1 and hnRNP L to preferentially bind and down-regulate transcripts with long 3'UTRs normally shielded from NMD. Unexpectedly, UPF1LL supports induction of NMD on new populations of substrate mRNAs in response to activation of the integrated stress response and impaired translation efficiency. Thus, while canonical NMD is abolished by moderate translational repression, UPF1LL activity is enhanced, offering the possibility to rapidly rewire NMD specificity in response to cellular stress.
Keywords: PTBP1; UPF1; hnRNP L; nonsense-mediated mRNA decay; translation termination.
Published 2022. This article is a U.S. Government work and is in the public domain in the USA.
Figures
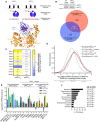
(Top) Schematic representation of alternative 5' splice site usage in exon 7 of mammalian UPF1 that results in two UPF1 protein isoforms that differ in length of the regulatory loop within the helicase core. (Bottom) Ribbon diagram of human UPF1SL helicase core overlaid with that of human UPF1LL. The regulatory loop in domain 1B is indicated for UPF1SL (light blue) and UPF1LL (purple), based on Protein Data Bank accessions 2XZP and 6EJ5 (Chakrabarti et al, ; Gowravaram et al, 2018).
(Top) Semiquantitative RT–PCR of UPF1SL or UPF1LL transcript levels following transfection of HEK‐293 cells with a NT siRNA or a siRNA that specifically targets the UPF1LL isoform. (Bottom) Venn diagram (to scale) of overlapping targets identified from RNA‐seq following total UPF1 or UPF1LL‐specific knockdown. Depicted are genes that increased in abundance at least 1.4‐fold (FDR < 0.05) and met read count cutoffs in both datasets. P‐value indicates enrichment of genes that increased in abundance at least 1.4‐fold (FDR < 0.05) with UPF1LL‐specific knockdown among those regulated by total UPF1, as determined by Fisher's exact test.
Heat map of changes in relative mRNA abundance for genes encoding NMD factors, as determined from RNA‐seq following transfection of HEK‐293 cells with a siRNA that targets both UPF1 isoforms (UPF1total) or a siRNA that specifically targets the UPF1LL isoform.
Density plot of changes in relative mRNA abundance as determined by RNA‐seq in SMG7ko/SMG6kd cells, relative to a parental cell line treated with control siRNAs (Boehm et al, 2021). Genes were categorized as up‐regulated by siUPF1total only, siUPF1LL only, or both siUPF1total and siUPF1LL. Statistical significance was determined by K–W test, with Dunn’s correction for multiple comparisons.
RT–qPCR analysis of indicated transcripts following transfection of HEK‐293 cells with the indicated siRNAs. Relative fold changes are in reference to NT siRNA. Asterisk (*) indicates P < 0.05, as determined by two‐way ANOVA. Black dots represent individual data points and error bars indicate mean ± SD (n = 3 biological replicates). Dashed line indicates log2(fold change) of +0.5. PTC+ indicates the use of primers specific to transcript isoforms with validated poison exons (Lareau et al, ; Ni et al, 2007). See also Dataset EV3 for P‐values associated with each statistical comparison.
Gene ontology analysis of 1621 genes that increased in expression at least 1.4‐fold upon UPF1LL‐specific knockdown in HEK‐293 cells under normal cellular conditions. Genes may map to multiple categories.
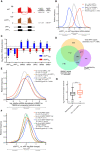
Sashimi plot from representative RNA‐seq samples of siNT and siUPF1LL knockdown cells. Percent spliced in values and FDR were calculated with rMATS software (Shen et al, 2014).
Density plot of changes in mRNA stability as determined by REMBRANDTS analysis of RNA‐seq following isoform‐specific UPF1LL depletion (Alkallas et al, 2017). mRNAs were binned according to up‐ or down‐regulation in response to siUPF1LL. Statistical significance was determined by K–W test, with Dunn's correction for multiple comparisons.
RT–qPCR analysis of indicated transcripts following transfection of HEK‐293 cells with siRNAs that target both UPF1 isoform (UPF1total) and the UPF1LL isoform. Relative fold changes are in reference to NT siRNA. siUPF1total or siUPF1LL was compared to the NT siRNA control for significance testing. Asterisk (*) indicates P < 0.05, as determined by two‐way ANOVA. Black dots represent individual data points and error bars indicate mean ± SD (n = 3 biological replicates). Dashed lines indicate log2 (fold change) of ± 0.5. See also Dataset EV3 for P‐values associated with each statistical comparison.
Venn diagram (to scale) of overlapping targets identified from RNA‐seq following UPF1LL knockdown (this dataset), total UPF1 knockdown, or SMG6/7 double knockdown and rescue (Colombo et al, 2017). Depicted are genes that increased in abundance at least 1.4‐fold (FDR < 0.05) with UPF1LL‐specific knockdown and their overlap with genes that increased in abundance (FDR < 0.05) with total UPF1 knockdown or genes that increased in abundance with SMG6/7 double knockdown and were significantly rescued by expression of SMG6 or SMG7 (SMG6/7 targets). P‐values indicate enrichment of genes that increased in abundance at least 1.4‐fold (FDR < 0.05) with UPF1LL‐specific knockdown among those regulated by total UPF1 and SMG6/7, as determined by Fisher's exact test. Only genes that met read count cutoffs in all conditions were included in the analysis.
Density plot of changes in relative mRNA abundance as determined by RNA‐seq in SMG7ko/SMG5kd cells, relative to a parental cell line treated with control siRNAs (Boehm et al, 2021). Genes were categorized as up‐regulated by siUPF1total only, siUPF1LL only, or both siUPF1total and siUPF1LL. Statistical significance was determined by K–W test, with Dunn’s correction for multiple comparisons.
Density plot of changes in relative mRNA abundance as determined by RNA‐seq following UPF1LL knockdown in HEK‐293 cells. Genes were categorized as up‐regulated by SMG7ko, SMG7ko/SMG5kd, SMG7ko/SMG6kd, or SMG7ko/SMG5kd and SMG7ko/SMG6kd (Boehm et al, 2021). Statistical significance was determined by K–W test, with Dunn’s correction for multiple comparisons.
Box plot of log2 enrichment for translation at the ER (Jan et al, 2014). mRNAs were binned by sensitivity to UPF1LL‐specific knockdown in HEK‐293 cells. Statistical significance was determined by K–S test (****P = 1 × 10⁻⁶). Boxes indicate interquartile ranges, horizontal lines represent medians, and bars indicate Tukey whiskers.
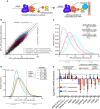
Scheme for the CLIP‐UPF1 affinity purification (RIP) assay.
Scatterplot of CLIP‐UPF1LL vs. CLIP‐UPF1SL RIP‐seq efficiency. mRNAs were binned according to 3’UTR length (short, medium, or long).
Density plot of recovered mRNAs in CLIP‐UPF1LL or CLIP‐UPF1SL affinity purifications. mRNAs were binned according to 3’UTR length. Statistical significance was determined by K–S test.
Density plot of recovered mRNAs in CLIP‐UPF1LL affinity purifications relative to that of CLIP‐UPF1SL. mRNAs were subdivided by PTBP1 and/or hnRNP L motif density within the 3’UTR, as indicated by the gradient triangle. Statistical significance was determined by K–W test, with Dunn’s correction for multiple comparisons.
RT–qPCR analysis of indicated transcripts from CLIP‐UPF1 overexpression RNA‐seq experiments. Relative fold changes are in reference to the GFP‐expressing control line. Significance of CLIP‐UPF1SL or CLIP‐UPF1LL overexpression was compared to the GFP‐expressing control line. Asterisk (*) indicates P < 0.05, as determined by two‐way ANOVA. Black dots represent individual data points and error bars indicate mean±SD (n = 3 biological replicates). Dashed lines indicate log2 (fold change) of ± 0.5. For protected mRNAs, the motif density of PTBP1/hnRNP L within the 3'UTR is indicated. PTC+ indicates the use of primers specific to transcript isoforms with validated poison exons (Lareau et al, ; Ni et al, 2007). See also Dataset EV3 for P values associated with each statistical comparison.

Western blots of CLIP‐UPF1SL and CLIP‐UPF1LL overexpression. Membranes were probed with an anti‐UPF1 antibody that detects both endogenous and CLIP‐tagged UPF1. Wedge indicates serial twofold dilutions of lysate. Mean (± SD) of CLIP‐UPF1 overexpression was determined from two replicate membranes.
RT–qPCR analysis of well‐characterized NMD targets following total UPF1 knockdown and rescue with siRNA‐resistant CLIP‐tagged UPF1. Relative fold changes are in reference to the GFP‐expressing control line treated with a NT siRNA. Significance of NMD rescue by CLIP‐UPF1 was compared to the GFP‐expressing control line treated with total UPF1 siRNA. Asterisk (*) indicates P < 0.0001, as determined by two‐way ANOVA with multiple comparisons. Black dots represent individual data points and error bars indicate mean ± SD (n = 3 biological replicates). PTC+ indicates the use of primers specific to transcript isoforms with validated poison exons (Lareau et al, ; Ni et al, 2007). See also Dataset EV3 for P‐values associated with each statistical comparison.
Density plot of recovered mRNAs in CLIP‐UPF1LL affinity purifications relative to that of CLIP‐UPF1SL. Genes were categorized as up‐regulated by siUPF1total only, siUPF1LL only, or both siUPF1total and siUPF1LL. Statistical significance was determined by K–W test, with Dunn’s correction for multiple comparisons.
RT–qPCR analysis of indicated transcripts from UPF1 RIP‐seq experiments. Relative fold enrichment was determined by dividing the recovered mRNA by its corresponding input amount. Significance of differential recovery in CLIP‐UPF1LL RIP was determined by comparison to that in CLIP‐UPF1SL. Asterisk (*) indicates P < 0.05, as determined by unpaired Student’s t‐test. Black dots represent individual data points, and error bars indicate mean ± SD (n = 3 biological replicates). For protected mRNAs, the PTBP1/hnRNP L motif density bin of the 3'UTR is indicated. PTC+ indicates the use of primers specific to transcript isoforms with validated poison exons (Lareau et al, ; Ni et al, 2007). See also Dataset EV3 for P‐values associated with each statistical comparison.
Density plots of changes in relative mRNA abundance as determined by RNA‐seq following UPF1LL (top) or UPF1SL (bottom) overexpression. mRNAs were binned according to enrichment in the CLIP‐UPF1LL or CLIP‐UPF1SL affinity purifications. Statistical significance was determined by K–W test, with Dunn’s correction for multiple comparisons.
Density plots of changes in mRNA stability as determined by REMBRANDTS analysis of RNA‐seq following UPF1LL (top) or UPF1SL (bottom) overexpression. mRNAs were binned according to enrichment in the CLIP‐UPF1LL or CLIP‐UPF1SL affinity purifications. Statistical significance was determined by K–W test, with Dunn’s correction for multiple comparisons.

Semiquantitative RT–PCR of UPF1SL or UPF1LL transcript levels following transfection of HEK‐293 cells with the indicated siRNAs.
RT–qPCR analysis of indicated transcripts following transfection of a NT siRNA or SRSF1‐specific siRNA under conditions of CLIP‐UPF1SL or CLIP‐UPF1LL overexpression. Relative fold changes are in reference to the GFP‐expressing control line treated with a NT siRNA. Asterisk (*) indicates P < 0.05, as determined by unpaired Student’s t‐test. Black dots represent individual data points and error bars indicate mean ± SD (n = 3 biological replicates). See also Dataset EV3 for P values associated with each statistical comparison.
Density plot of changes in relative mRNA abundance as determined by RNA‐seq following SRSF1 overexpression (Data ref: Caputi et al, 2019). Genes were categorized as up‐regulated by siUPF1total only, siUPF1LL only, or both siUPF1total and siUPF1LL. Statistical significance was determined by K–W test, with Dunn’s correction for multiple comparisons.
Density plot as in (C), with genes binned according to enrichment in the CLIP‐UPF1LL or CLIP‐UPF1SL affinity purifications.

Scheme of the fluorescence‐based unwinding assay to monitor UPF1 translocation in real‐time (Fritz et al, 2020). An RNA substrate harboring a high‐affinity PTBP1 binding site is incubated with highly purified UPF1ΔCH in the absence and presence of equal molar amounts of highly purified PTBP1. Upon the addition of ATP, UPF1 translocation results in a decrease in fluorescence due to displacement of a labeled, duplexed oligonucleotide and subsequent quenching by a trap strand.
UPF1SLΔCH translocation along an RNA substrate harboring a high‐affinity PTBP1 binding site in the absence and presence of PTBP1. Time to 50% unwound and relative total % unwound at end of assay (1,200 s) are indicated. Results of four technical replicates are shown for each dataset and represent at least three independent experiments. Shaded region indicates SD.
Results as in (B) but with UPF1LLΔCH.
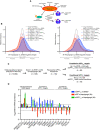
Scheme for activation of the integrated stress response (ISR) and effects on UPF1‐dependent decay.
Density plots of changes in relative mRNA abundance as determined by RNA‐seq following treatment of HEK‐293 cells with 1 µM thapsigargin for 6 h (left) or 9 h (right). Genes were categorized as up‐regulated by siUPF1total only or siUPF1LL only under basal conditions. Statistical significance was determined by K–W test, with Dunn’s correction for multiple comparisons.
RNA‐seq analysis of HEK‐293 cells identifies populations of genes that decreased in abundance with thapsigargin treatment and were rescued by UPF1LL‐specific knockdown. Indicated are genes that increased in abundance at least 1.4‐fold (FDR < 0.05) with UPF1LL‐specific knockdown under normal conditions.
RT–qPCR analysis of indicated transcripts following transfection of HEK‐293 cells with indicated siRNAs and treatment with 1 µM thapsigargin for 6 h. Relative fold changes are in reference to vehicle‐treated, NT siRNA. Black dots represent individual data points and error bars indicate mean ± SD (n = 3 biological replicates). Dashed lines indicate log2 (fold change) of ± 0.5. PTC+ indicates the use of primers specific to transcript isoforms with validated poison exons (Lareau et al, ; Ni et al, 2007). See also Dataset EV3 for P‐values associated with each statistical comparison.
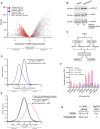
Volcano plot of relative mRNA abundance as determined from RNA‐seq following treatment of HEK‐293 cells with 1 µM tunicamycin for 6 h (Data ref: Park et al, 2017). mRNAs were binned by RIP‐seq efficiency in CLIP‐UPF1LL or CLIP‐UPF1SL affinity purifications. Statistical significance was determined by K–W test, with Dunn's correction for multiple comparisons. Dashed line indicates the significance threshold P ≤ 0.05 (n = 3 biological replicates).
Western blot of eIF2α phosphorylation following treatment of HEK‐293 cells with 1 µM thapsigargin for 6 h.
Schematic of the RNA‐seq experimental workflow and conditions for UPF1LL knockdown and thapsigargin treatment.
Density plot of relative mRNA stability as determined by REMBRANDTS analysis of RNA‐seq following treatment of HEK‐293 cells with 1 µM thapsigargin for 6 h. mRNAs were binned by changes in relative mRNA abundance in thapsigargin. Statistical significance was determined by K–S test.
Density plot of relative mRNA stability as determined by REMBRANDTS analysis of RNA‐seq following UPF1LL knockdown in HEK‐293 cells and treatment with 1 µM thapsigargin for 6 h (Alkallas et al, 2017). mRNAs were binned by changes in relative mRNA abundance in thapsigargin with UPF1LL knockdown. Statistical significance was determined by K–W test, with Dunn's correction for multiple comparisons.
Quantification of characterized ISR‐target transcript abundance in RNA‐seq of the indicated conditions. Error bars indicate mean ± SD (n = 3 biological replicates).
Quantification of UPF1LL isoform expression in control and thapsigargin‐treated HEK‐293 cells from rMATS analyses (n = 3 biological replicates).

Framework for investigation of effects of translation inhibition on UPF1LL activity.
RNA‐seq analysis of HEK‐293 cells identifies populations of genes that decreased in abundance with puromycin treatment (50 µg/ml for 4 h) and were rescued by UPF1LL‐specific knockdown. Indicated are genes that increased in abundance at least 1.4‐fold (FDR < 0.05) with UPF1LL‐specific knockdown under normal conditions.
RT–qPCR analysis of indicated transcripts following transfection of HEK‐293 cells with indicated siRNAs and treatment with 50 µg/ml puromycin for 4 h. Relative fold changes are in reference to vehicle‐treated, NT siRNA. Black dots represent individual data points, and error bars indicate mean ± SD (n = 3 biological replicates). Dashed lines indicate log2 (fold change) of ± 0.5. PTC+ indicates the use of primers specific to transcript isoforms with validated poison exons (Lareau et al, ; Ni et al, 2007). See also Dataset EV3 for P‐values associated with each statistical comparison.
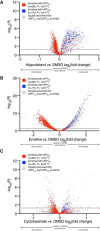
Volcano plot of relative mRNA abundance as determined from RNA‐seq following treatment of MCF7 cells with 150 nM hippuristanol for 1 h (Data ref: Waldron et al, 2019). mRNAs were binned by RIP‐seq efficiency in CLIP‐UPF1LL or CLIP‐UPF1SL affinity purifications. Statistical significance was determined by K–W test, with Dunn's correction for multiple comparisons. Dashed line indicates the significance threshold P ≤ 0.05 (n = 3 biological replicates).
Volcano plot as in (A), following treatment of HEK‐293 cells with 50 ng/ml emetine for 4 h (Martinez‐Nunez et al, 2017). Dashed line indicates the significance threshold P ≤ 0.05 (n = 3 biological replicates).
Volcano plot as in (A), following treatment of HeLa cells with 100 µg/ml cycloheximide for 15 min (Data ref: Kearse et al, 2019). Dashed line indicates the significance threshold P ≤ 0.05 (n = 3 biological replicates).
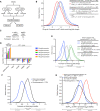
Schematic of the RNA‐seq experimental workflow and conditions for UPF1LL knockdown and puromycin treatment.
Density plot of relative mRNA abundance as determined by RNA‐seq following treatment of HEK‐293 cells with 50 µg/ml puromycin. mRNAs were binned according to destabilization in CLIP‐UPF1LL or CLIP‐UPF1SL overexpression experiments, as determined by REMBRANDTS analysis (Alkallas et al, 2017). Statistical significance was determined by K–S test.
Quantification of UPF1LL isoform expression in control and puromycin‐treated HEK‐293 cells from rMATS analyses (n = 3 biological replicates) (Shen et al, 2014).
RT–qPCR analysis of indicated transcripts following treatment of HEK‐293 cells with indicated concentrations of puromycin for 4 h. Relative fold changes are in reference to vehicle‐treated control. Significance of puromycin treatment on relative transcript abundance was compared to the vehicle‐treated control. Asterisk (*) indicates P < 0.05, as determined by two‐way ANOVA. Black dots represent individual data points, and error bars indicate mean ± SD (n = 3 biological replicates). Dashed lines indicate log2 (fold change) of ± 0.5. PTC+ indicates the use of primers specific to the transcript isoform with a validated poison exon (Lareau et al, ; Ni et al, 2007). See also Dataset EV3 for P‐values associated with each statistical comparison.
Density plot of relative mRNA abundance as determined by RNA‐seq following treatment of HEK‐293 cells with 25 µg/ml or 100 µg/ml puromycin. mRNAs were binned according to sensitivity to 50 µg/ml puromycin and UPF1LL knockdown. Statistical significance was determined by K–S test.
Density plot of relative mRNA stability as determined by REMBRANDTS analysis of RNA‐seq following treatment of HEK‐293 cells with 50 µg/ml puromycin for 4 h (Alkallas et al, 2017). mRNAs were binned by changes in relative mRNA abundance in puromycin. Statistical significance was determined by K–S test.
Density plot of relative mRNA stability as determined by REMBRANDTS analysis of RNA‐seq following UPF1LL knockdown in HEK‐293 cells and treatment with 50 µg/ml puromycin for 4 h (Alkallas et al, 2017). mRNAs were binned by changes in relative mRNA abundance in puromycin with UPF1LL knockdown. Statistical significance was determined by K–W test, with Dunn's correction for multiple comparisons.
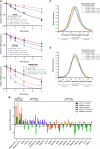
mRNA decay measurement using Roadblock‐qPCR (Watson et al, 2021). RNA was isolated from HEK‐293 cells at indicated timepoints following transfection with indicated siRNAs and treatment with 400 µM 4sU and 50 µg/ml puromycin. mRNA half‐lives were estimated by fitting the data to a single‐phase exponential decay model. Puromycin treatment was compared to the vehicle control and siUPF1LL was compared to the siNT in the absence and presence of puromycin treatment using the extra‐sum‐of‐squares F test. Error bars indicate mean ± SD (n = 4 biological replicates). See also Dataset EV3 for P values associated with each statistical comparison.
RT–qPCR analysis of indicated transcripts following transfection of HEK‐293 cells with indicated siRNAs and treatment with 50 µg/ml puromycin for 4 h. Relative fold changes are in reference to vehicle‐treated, NT siRNA. Black dots represent individual data points and error bars indicate mean ± SD (n = 3 biological replicates). Dashed lines indicate log2 (fold change) of ± 0.5. PTC+ indicates the use of primers specific to transcript isoforms with validated poison exons (Lareau et al, ; Ni et al, 2007). See also Dataset EV3 for P values associated with each statistical comparison.
Density plot of changes in relative mRNA abundance as determined from RNA‐seq following treatment of HEK‐293 cells with 50 µg/ml of puromycin for 4 h. mRNAs were subdivided by PTBP1 and/or hnRNP L motif density within the first 400 nt of 3'UTR. Statistical significance was determined by K–W test, with Dunn's correction for multiple comparisons.
Density plot as in (C), following UPF1LL‐specific knockdown.

References
Publication types
MeSH terms
Substances
Associated data
- Actions
- Actions
- Actions
LinkOut - more resources
Full Text Sources
Molecular Biology Databases

