

Endothelial-immune crosstalk contributes to vasculopathy in nonalcoholic fatty liver disease
- PMID: 35403791
- PMCID: PMC9171677
- DOI: 10.15252/embr.202154271
Endothelial-immune crosstalk contributes to vasculopathy in nonalcoholic fatty liver disease
Erratum in
-
Endothelial-immune crosstalk contributes to vasculopathy in nonalcoholic fatty liver disease.EMBO Rep. 2022 Oct 6;23(10):e55871. doi: 10.15252/embr.202255871. EMBO Rep. 2022. PMID: 36200589 Free PMC article.
Abstract
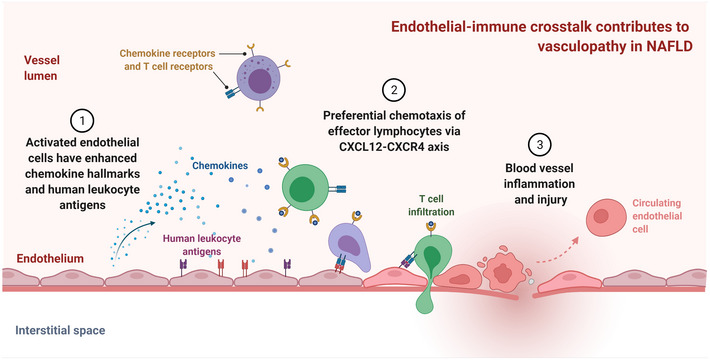
The top cause of mortality in patients with nonalcoholic fatty liver disease (NAFLD) is cardiovascular complications. However, mechanisms of NAFLD-associated vasculopathy remain understudied. Here, we show that blood outgrowth endothelial cells (BOECs) from NAFLD subjects exhibit global transcriptional upregulation of chemokines and human leukocyte antigens. In mouse models of diet-induced NAFLD, we confirm heightened endothelial expressions of CXCL12 in the aortas and the liver vasculatures, and increased retention of infiltrated leukocytes within the vessel walls. To elucidate endothelial-immune crosstalk, we performed immunoprofiling by single-cell analysis, uncovering T cell intensification in NAFLD patients. Functionally, treatment with a CXCL12-neutralizing antibody is effective at moderating the enhanced chemotactic effect of NAFLD BOECs in recruiting CD8+ T lymphocytes. Interference with the CXCL12-CXCR4 axis using a CXCR4 antagonist also averts the impact of immune cell transendothelial migration and restores endothelial barrier integrity. Clinically, we detect threefold more circulating damaged endothelial cells in NAFLD patients than in healthy controls. Our work provides insight into the modulation of interactions with effector immune cells to mitigate endothelial injury in NAFLD.
Keywords: chemokine ligand-receptor interaction; circulating endothelial cells; endothelial dysfunction; immunoprofiling; transcriptomics.
© 2022 The Authors. Published under the terms of the CC BY NC ND 4.0 license.
Figures
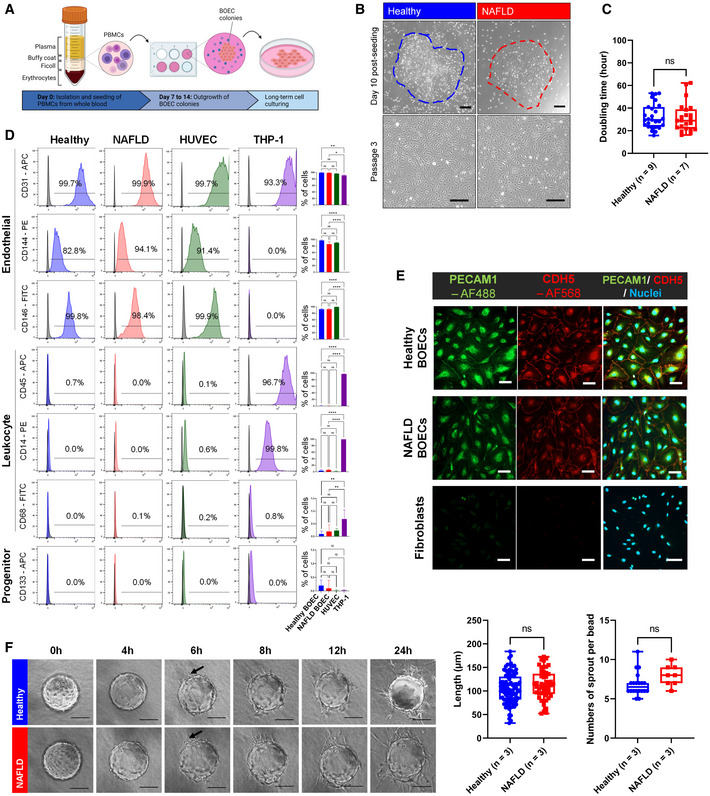
Workflow schematic of BOEC generation from PBMC samples isolated from NAFLD patients and healthy donors.
Upper panel: Representative images of BOEC colonies from PBMC cultivation 10 days post‐seeding. Dotted line in each image outlines a BOEC colony. Lower panel: Stabilized BOEC cultures after passaging of colonies (scale bar, 250 µm).
Proliferation doubling time for NAFLD and healthy BOECs based on passages 2 and 3. Sample sizes are n = 9 healthy, n = 7 NAFLD; with 3 biological replicates per donor. Box‐whisker plots indicate median (middle line), 25th, 75th percentile (box), and the lowest/highest data points (whiskers). ns—not significant (t‐test).
Left panel: Flow cytometry characterization of BOECs for endothelial, leukocyte, and progenitor cell markers (gray—isotype control; red/blue/green/purple—cell lineage marker staining). HUVEC and monocytic THP‐1 cells were used as positive controls for endothelial and leukocytic markers, respectively. Right panel: Percentages of positively expressing cells. Sample sizes are n = 4–6 healthy, n = 2–7 NAFLD. Results are indicated by mean ± SD. *P < 0.05; **P < 0.01; ****P < 0.0001; ns—not significant (one‐way ANOVA).
Representative images of immunostaining for endothelial markers, PECAM1 and CDH5 (scale bar, 100 µm).
Left panel: Longitudinal monitoring of BOEC angiogenesis in fibrin gel bead‐based sprouting assays over 24 h (representative images; scale bar, 100 µm). Right panel: Box‐whisker plots of quantifications of sprout lengths and numbers of sprout per bead at 24 h. n = 3 healthy, n = 3 NAFLD, with 4–5 beads analyzed per donor and 5–11 sprouts per bead. ns—not significant (t‐test). Box‐whisker plots indicate median (middle line), 25th, 75th percentile (box), and the lowest/highest data points (whiskers).
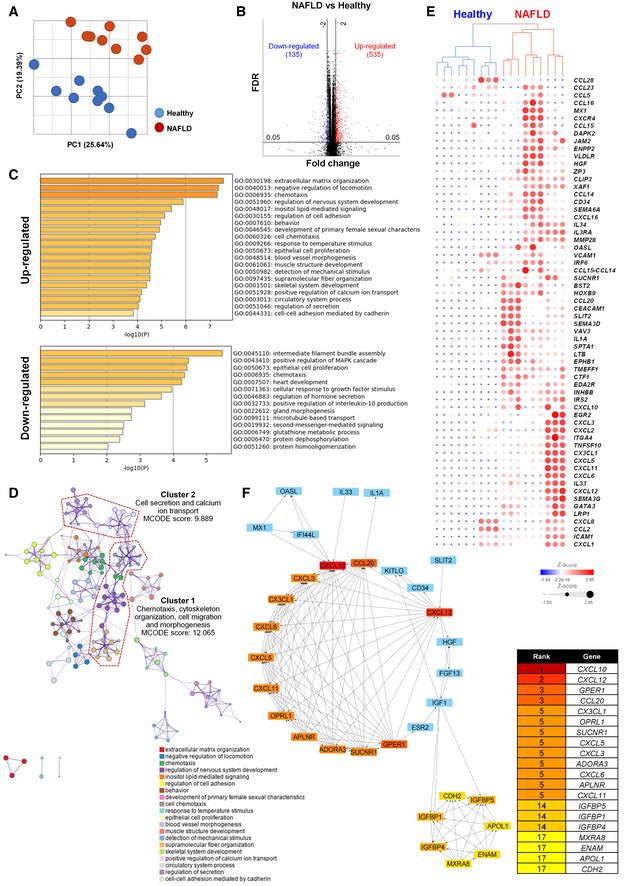
Principal component analysis of NAFLD (n = 3) and healthy (n = 3) BOEC transcriptomes, with 3 biological replicates per donor.
Volcano plot depicting differentially expressed genes comparing NAFLD BOECs with healthy BOECs. Red and blue dots represent upregulated and downregulated genes in NAFLD BOECs, respectively.
Enriched gene ontology terms of the differentially expressed genes.
Metascape enrichment network visualization showing intracluster and intercluster interactomes of the upregulated genes in NAFLD BOECs. Nodes that share the same cluster annotations are close to each other. Densely connected clusters were identified using MCODE algorithm and outlined in red.
Heatmap featuring the genes in MCODE Cluster 1.
STRING protein–protein interaction network were analyzed by maximum neighborhood component, showing hub genes as ranked and indicated by gradient of red colors. Blue nodes represent differentially expressed genes in the extended networks.
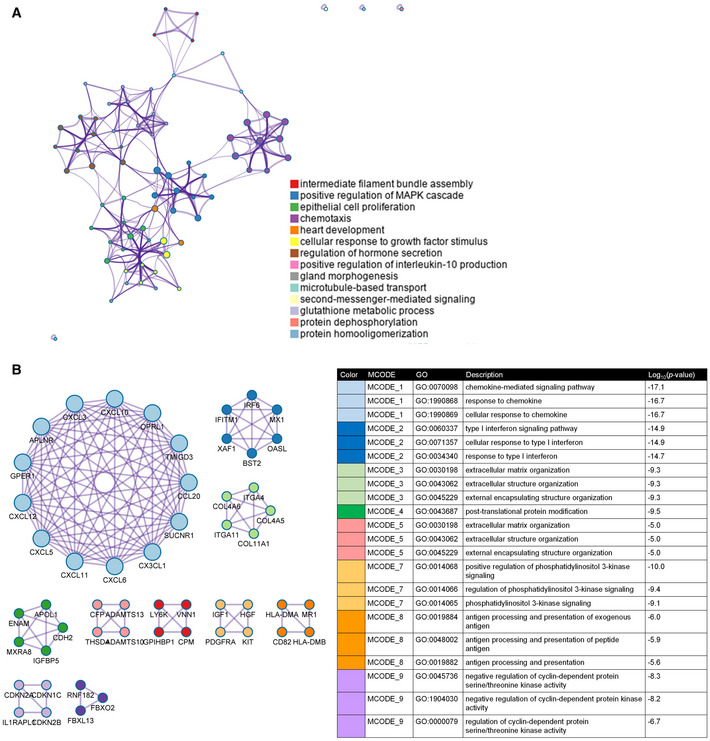
Metascape enrichment network visualization of interactomes of the downregulated terms in NAFLD BOECs. No identifiable MCODE complexes were found.
Ten MCODE complexes identified in the upregulated networks in NAFLD BOECs, ranked, and colored by their identities. The identities of the complexes were listed in the table.
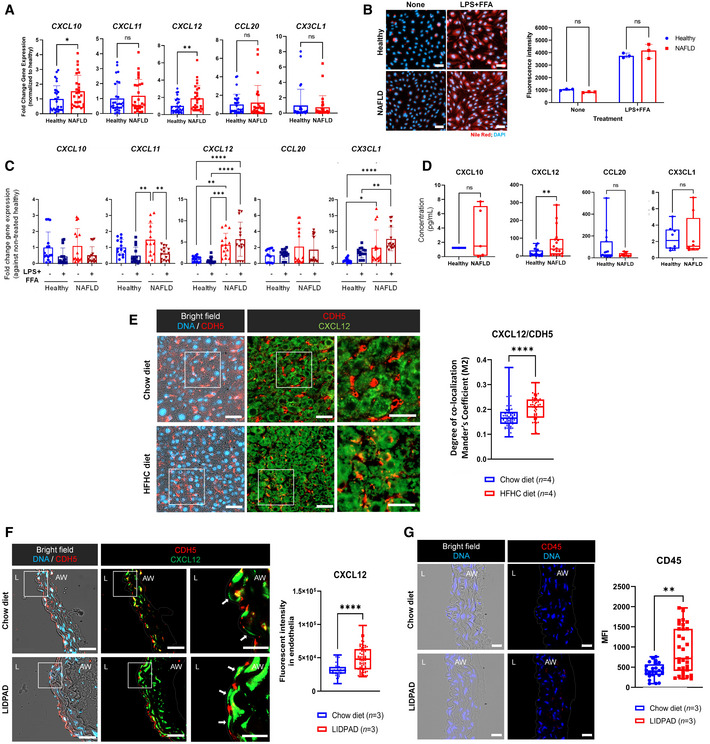
Fold change in gene expressions of CXCL10, CXCL11, CXCL12, CCL20, and CX3CL1 in NAFLD (n = 10) BOECs, normalized to healthy (n = 12) BOECs, with 2 technical replicates per donor. Results are indicated by mean ± SD. *P < 0.05; **P < 0.01; ns—not significant (Mann–Whitney test).
Left: Representative images showing nontreated and LPS + FFA‐treated NAFLD and healthy BOECs, stained with Nile Red (scale bars, 100 µm). Right: Fluorescence intensity of intracellular Nile Red stain was quantified at 515/585 nm, and readings were normalized with blanks (n = 3 donors/group). Results are indicated by mean ± SD. ns—not significant (two‐way ANOVA comparing NAFLD and healthy groups).
Fold change in gene expressions of CXCL10, CXCL11, CXCL12, CCL20, and CX3CL1 in LPS + FFA‐treated or nontreated NAFLD (n = 5) and healthy (n = 5) BOECs, normalized to nontreated healthy BOECs, with 3 technical replicates per donor. Results are indicated by mean ± SD. *P < 0.05; **P < 0.01; ***P < 0.001; ****P < 0.0001 (two‐way ANOVA).
Protein concentrations of chemokines in the conditioned culture media of healthy and NAFLD BOECs. *P < 0.05; ns—not significant (Mann–Whitney test). Box‐whisker plots indicate median (middle line), 25th, 75th percentile (box), and the lowest/highest data points (whiskers).
Left: Representative images (Bright field; DAPI, nuclei; CDH5, endothelial cells; CXCL12) of liver sections from chow diet‐fed and HFHC diet‐fed humanized mice (scale bar, 40 μm). Boxed regions were further magnified (scale bar, 30 µm). Right: Box‐whisker plot of Mander’s coefficient (M2) that was a measure of the degree of CXCL12 overlap with CDH5‐positive vasculatures in the livers. Box‐whisker plots indicate median (middle line), 25th, 75th percentile (box), and the lowest/highest data points (whiskers). Chow diet‐fed (n = 4) and HFHC diet‐fed (n = 4) humanized mice were analyzed, with 10–20 independent regions of interest per mouse were analyzed for image quantification. ****P < 0.0001 (Mann–Whitney test).
Left: Representative images (Bright field; DAPI, nuclei; CDH5, endothelial cells; CXCL12) of aortic sections from chow diet‐fed and LIDPAD mice (scale bar, 40 μm). Boxed regions were further magnified (scale bar, 30 µm). Arrows point at aortic endothelial cells. AW—aortic wall; L—lumen. Right: Box‐whisker plot of CXCL12 fluorescent intensity in the aortic vascular endothelia. CXCL12 fluorescent intensity for each delimitated endothelial region is represented as individual data points on the plot. Box‐whisker plots indicate median (middle line), 25th, 75th percentile (box), and the lowest/highest data points (whiskers). Chow diet‐fed (n = 3) and LIDPAD diet‐fed (n = 3) mice were analyzed, with 10–20 delimitated endothelial regions per mouse analyzed for image quantification. ****P < 0.0001 (Mann–Whitney test).
Left: Representative images showing aortic sections harvested from mice fed with either chow or LIDPAD diet. Sections were stained for leukocyte markers CD45 (red) to determine the extent of leukocyte infiltration. Dotted lines demarcate the aortic walls (AW). L—lumen. Scale bar: 20 µm. Right: Box‐whisker plot of mean fluorescence intensity (MFI) of CD45 signals as a readout for the amount of infiltrated CD45+ leukocytes within the aortic walls. Box‐whisker plots indicate median (middle line), 25th, 75th percentile (box), and the lowest/highest data points (whiskers). n = 3 mice per group, with 2 tissue sections analyzed per animal. **P < 0.01 (Mann–Whitney).
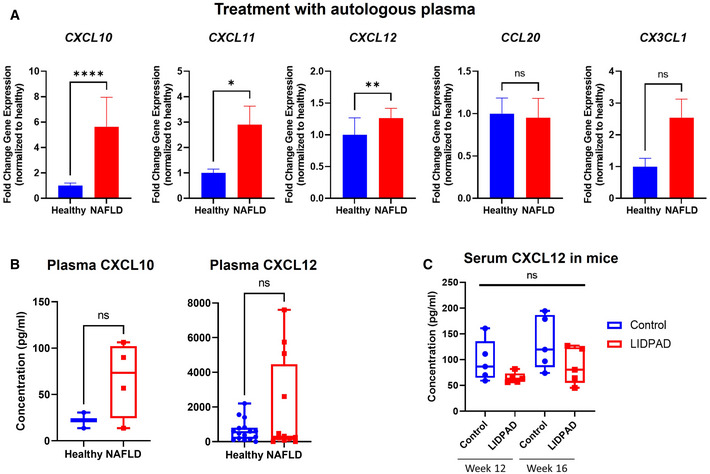
Chemokine expressions in the BOECs treated with autologous plasma. Fold changes in gene expressions of CXCL10, CXCL11, CXCL12, CCL20, and CX3CL1 in NAFLD (n = 10) BOECs were normalized to healthy (n = 12) BOECs. Results are indicated by mean ± SD. *P < 0.05; **P < 0.01; ****P < 0.0001; ns—not significant (Mann–Whitney test).
Plasma concentrations of CXCL10 and CXCL12 in healthy and NAFLD subjects. Box‐whisker plots indicate median (middle line), 25th, 75th percentile (box), and the lowest/highest data points (whiskers). ns—not significant (Mann–Whitney test).
Serum CXCL12 concentrations of wild‐type C57BL/6J mice placed on LIDPAD or control diet for 12 and 16 weeks (n = 5 mice), determined by ELISA. Data presented as box‐whisker plots of median (middle line), 25th, 75th percentile (box), and the lowest/highest data points (whiskers). ns—not significant (two‐way ANOVA).
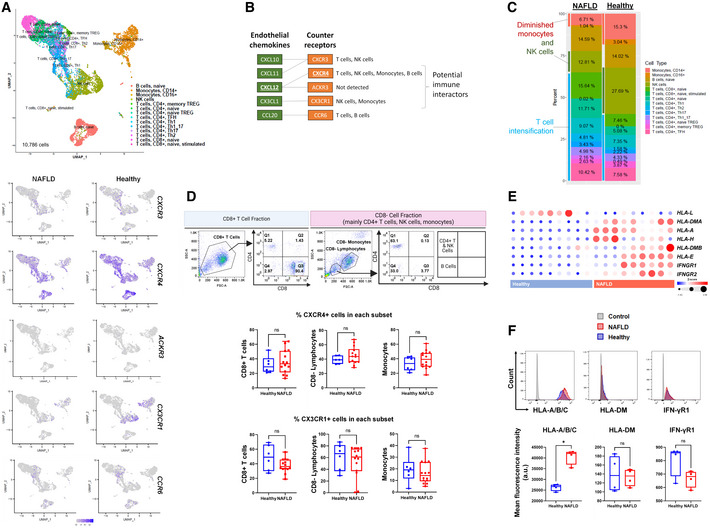
Upper panel: Single‐cell UMAP of sequenced PBMCs from 2 NAFLD patients and 4 healthy subjects; n = 10,786 cells. We identified 15 distinct cell types by DICE annotation. Lower panel: Expression patterns of CXCR3, CXCR4, ACKR3, CX3CR1, and CCR6 across different cell types in NAFLD and healthy PBMC samples.
Chemokine ligand‐receptor mapping to identify potential immune cell interactors based on NAFLD endothelial chemokine signatures.
Graphic shows the percentage composition of identified cell types in NAFLD and healthy PBMCs single‐cell analysis.
Upper panel: Representative flow cytometry dot plots, characterizing the isolated CD8+ T cells and CD8− immune cell fraction (mainly CD4+ T cells, NK cells, and monocytes) from PBMCs of healthy and NAFLD subjects. Lower panel: Flow cytometry quantification of % of positively expressing CXCR4+ and CX3CR1+ cells within each immune subset. Sample sizes are n = 14 NAFLD; n = 6 healthy. Box‐whisker plots indicate median (middle line), 25th, 75th percentile (box), and the lowest/highest data points (whiskers). ns—not significant (t‐test).
Heatmap of gene expressions of endothelial antigens relevant to interaction with T lymphocytes in NAFLD (n = 3) and healthy (n = 3) BOECs, with 3 biological replicates per donor.
Upper panel: Representative flow cytometry histograms of HLA‐A/B/C, HLA‐DM, and IFN‐γR1 expressions in NAFLD (red) and healthy (blue) BOECs. Gray, isotype control. Lower panel: Box‐whisker plots reflect mean fluorescence intensity (a.u—arbituary unit), normalized to isotype control, as a readout for epitope density. Box‐whisker plots indicate median (middle line), 25th, 75th percentile (box), and the lowest/highest data points (whiskers). ns—not significant (t‐test). n = 4 donors; *P < 0.05; ns—not significant (Mann–Whitney test for HLA‐A/B/C and IFN‐γR1; t‐test for HLA‐DM).
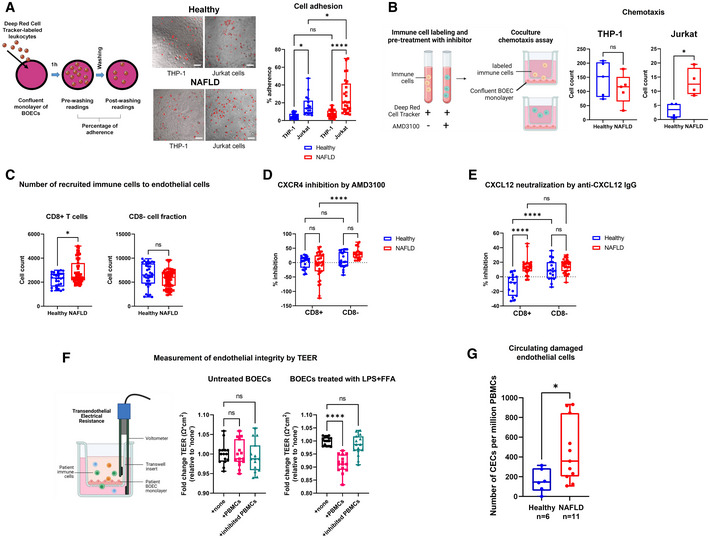
Left: Workflow schematic of adhesion assay. Middle: Representative images of labeled THP‐1 and Jurkat cells attached to BOEC monolayers (Scale bars, 100 µm). Right: Box‐whisker plots of the numbers of adhered leukocytes were determined fluorometrically. Sample sizes are n = 9 NAFLD and n = 7 healthy, with 3 biological replicates per donor. Box‐whisker plots indicate median (middle line), 25th, 75th percentile (box), and the lowest/highest data points (whiskers). *P < 0.05; ****P < 0.0001; ns—not significant (two‐way ANOVA).
Left: Schematic of chemotaxis assay. Right: Box‐whisker plots of the numbers of recruited THP‐1 and Jurkat cells by the BOECs. Box‐whisker plots indicate median (middle line), 25th, 75th percentile (box), and the lowest/highest data points (whiskers). ns—not significant (t‐test). Sample size is n = 5 donors; *P < 0.05; ns—not significant (t‐test).
CD8+ T cells and CD8− cell fractions were isolated from NAFLD and healthy subjects. Box‐whisker plots show the number of recruited immune cells to their respective BOECs matched by health condition in coculture chemotaxis assays. Box‐whisker plots indicate median (middle line), 25th, 75th percentile (box), and the lowest/highest data points (whiskers). ns—not significant (t‐test). Sample sizes are n = 11 NAFLD and n = 6 healthy, with 3–4 technical replicates per donor. *P < 0.05; ns—not significant (Mann–Whitney).
Box‐whisker plots show percentages of inhibition on immune cells chemotaxis by treatment with AMD3100 (CXCR4 small molecule inhibitor). Box‐whisker plots indicate median (middle line), 25th, 75th percentile (box), and the lowest/highest data points (whiskers). ns—not significant (t‐test). Sample sizes are n = 6 NAFLD and n = 4 healthy, with 3–4 technical replicates per donor. ****P < 0.0001; ns—not significant (two‐way ANOVA).
Box‐whisker plots show percentages of inhibition on immune cells chemotaxis by treatment with anti‐CXCL12 IgG (CXCL12‐neutralizing antibody). Box‐whisker plots indicate median (middle line), 25th, 75th percentile (box), and the lowest/ highest data points (whiskers). ns—not significant (t‐test). Sample sizes are n = 5 NAFLD and n = 3 healthy, with 3–4 technical replicates per donor. ****P < 0.0001; ns—not significant (two‐way ANOVA).
Left: Schematic of transendothelial migration assay with patient‐derived BOECs and immune cells. Right: Transendothelial electric resistance (TEER) measurements of BOEC barrier tightness in the presence and absence of PBMCs and/or AMD3100. Box‐whisker plots indicate median (middle line), 25th, 75th percentile (box), and the lowest/highest data points (whiskers). ns—not significant (t‐test). Sample size is n = 5 patient samples, with 3 technical TEER readings recorded per sample. ****P < 0.0001; ns—not significant (one‐way ANOVA).
Box‐whisker plots of the numbers of circulating endothelial cells per million PBMCs in healthy (n = 6) and NAFLD subjects (n = 11). Box‐whisker plots indicate median (middle line), 25th, 75th percentile (box), and the lowest/highest data points (whiskers). ns—not significant (t‐test). *P < 0.05 (Mann–Whitney test).
References
-
- Bigorgne AE, Bouchet‐Delbos L, Naveau S, Dagher I, Prevot S, Durand‐Gasselin I, Couderc J, Valet P, Emilie D, Perlemuter G (2008) Obesity‐induced lymphocyte hyperresponsiveness to chemokines: a new mechanism of Fatty liver inflammation in obese mice. Gastroenterology 134: 1459–1469 - PubMed
Publication types
MeSH terms
Associated data
- Actions
- Actions
LinkOut - more resources
Full Text Sources
Medical
Molecular Biology Databases
Research Materials
