. 2022 Jun;9(17):e2104986.
doi: 10.1002/advs.202104986. Epub 2022 Apr 11.

Genetic Deficiency of MicroRNA-15a/16-1 Confers Resistance to Neuropathological Damage and Cognitive Dysfunction in Experimental Vascular Cognitive Impairment and Dementia

Affiliations

Genetic Deficiency of MicroRNA-15a/16-1 Confers Resistance to Neuropathological Damage and Cognitive Dysfunction in Experimental Vascular Cognitive Impairment and Dementia

Chao Zhou et al. Adv Sci (Weinh). 2022 Jun.

Abstract

Chronic cerebral hypoperfusion-derived brain damage contributes to the progression of vascular cognitive impairment and dementia (VCID). Cumulative evidence has shown that microRNAs (miRs) are emerging as novel therapeutic targets for CNS disorders. In this study, it is sought to determine the regulatory role of miR-15a/16-1 in VCID. It is found that miR-15a/16-1 knockout (KO) mice exhibit less cognitive and sensorimotor deficits following VCID. Genetic deficiency of miR-15a/16-1 in VCID mice also mitigate myelin degeneration, axonal injury, and neuronal loss. Mechanistically, miR-15a/16-1 binds to the 3'-UTR of AKT3 and IL-10RA. Genetic deletion of miR-15a/16-1 increases AKT3 and IL-10RA expression in VCID brains, and intranasal delivery of AKT3 and IL-10RA siRNA-loaded nanoparticles partially reduce brain protection and cognitive recovery in miR-15a/16-1 KO mice after VCID. In conclusion, the miR-15a/16-1-IL/10RA/AKT3 axis plays a critical role in regulating vascular brain damage and cognitive decline after VCID. Targeting miR-15a/16-1 is a novel therapeutic approach for the treatment of VCID.

Keywords: AKT3; IL-10RA; grey matter lesions; miR-15a/16-1; microRNAs; vascular cognitive impairment and dementia; white matter lesions.


Conflict of interest statement

The authors declare no conflict of interest.

Figures

Figure 1
Figure 1
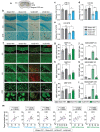
Genetic deletion of miR‐15a/16‐1 promotes long‐term recovery of regional CBF, sensorimotor, and cognitive function in an experimental mouse VCID model. Experimental VCID was induced in miR‐15a/16‐1 KO and WT mice, followed by a 35 d survival period. a) Cortical CBF was monitored in mice using laser speckle imaging before surgery (pre), 3 d, 7 d, 14 d, 28 d, and 35 d after surgery. Representative CBF images (black ellipses: ROIs) were presented. b,c) Quantitative analysis of regional CBF changes in the left and right hemispheres in sham and VCID mice (n = 5–6/group). VCID mice and sham controls were subjected to MWM and NOR tests for examination of long‐term cognitive decline or deficits. d) Swim paths of learning and memory phases during the MWM test. e) The latency to find the hidden platform in the place navigation phase (learning). f) The swim time in the target quadrant in the probe test (memory). g) Average swimming speed in the MWM test (n = 12–15/group). h) Graphic protocol of NOR test. i) The discrimination index at test phase of NOR (n = 12–15/group). Sensorimotor function was examined in VCID mice and sham controls at the indicated time points (−1, 3, 7, 14, 28, and 35 d after operation, n = 13–15/group). j) The time to fall in the rotarod test. k) The time to touch and l) time to remove the tape in the adhesive tape removal test. m) The left turn numbers in the corner test. Data are presented as mean ± SEM. * p < 0.05, ** p < 0.01, and *** p < 0.001 versus VCID+WT group. Statistical analyses were performed by one‐way ANOVA and Bonferroni's test (g, h, j) and two‐way ANOVA with Bonferroni's test (b, c, e, j–m).
Figure 2
Figure 2
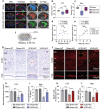
Genetic deletion of miR‐15a/16‐1 preserves long‐term WM integrity in mice after VCID. DTI and TEM were conducted to evaluate the integrity of WM in miR‐15a/16‐1 KO and WT mice 35 d after VCID. a) Image showing the ROI for DTI analysis. b) Representative DTI axial views of FA maps and DEC maps of the same brains (blue and red squares: enlarged images of the CC and EC, respectively; yellow arrows: injured area). c,d) Quantitative analysis of FA values in the CC and EC (n = 4–5/group, one‐way ANOVA & Bonferroni's test). e,f) The correlation analysis of target quadrant time in the MWM test and FA values in the CC and EC areas (n = 4–5/group, Pearson correlation analysis). g) Representative fiber tracking images in mouse brain and h) quantitative analysis of fiber intensity. The brain region of fiber loss was indicated by yellow arrows. i) Representative TEM images showing the ultrastructure of axons and myelin sheaths (red arrows: myelin debris). Quantitative analysis of j) g‐ratio, k) myelin thickness (n = 100 axons/group, simple linear regression and slopes comparison), and l) abnormal axons (one‐way ANOVA & Bonferroni's test) in the CC/EC areas. Data are presented as mean ± SEM or scatterplots. * p<0.05, ** p<0.01, or *** p<0.001 versus VCID+WT group.
Figure 3
Figure 3
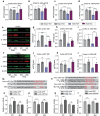
MiR‐15a/16‐1 genetic deletion protects against long‐term myelin loss and axonal damage in mice after VCID. LFB histological staining and MBP/SMI32 immunofluorescence double staining were applied to miR‐15a/16‐1 KO and WT mouse brains harvested 35 d after VCID to detect myelin loss and axonal damage. a) Coordinates of LFB and MBP/SMI32 staining and brain regions for analysis. b) Representative LFB images of the CC, EC, and STR areas (Black arrow: demyelinated area). c–e) Quantitative analysis of relative OD values of LFB in the CC, EC, and STR areas (n = 6/group, one‐way ANOVA & Bonferroni's test) f) Representative images of MBP (green) and SMI32 (red) double‐immunostaining in the CC, EC, and STR areas. g–i) Quantitative analysis of MBP fluorescence intensities and j–l) the ratio of SMI32/MBP in the CC, EC, and STR areas (n = 6/group, one‐way ANOVA & Bonferroni's test). m) Correlation analysis of target quadrant time in the MWM test and LFB or MBP staining of the CC, EC, and STR areas (n = 6/group, Pearson correlation analysis). Data are presented as mean ± SEM. * p<0.05, ** p<0.01, or *** p<0.001 versus VCID+WT group.
Figure 4
Figure 4
Genetic deletion of miR‐15a/16‐1 reduces neuronal loss and hippocampal atrophy in mice after VCID. a) Hippocampal volume was evaluated with DTI. Representative DEC maps and hippocampal 3D reconstitution images of miR‐15a/16‐1 KO and WT mouse brains 35 d after VCID (white lines: enlarged areas; yellow arrow: atrophy area). b,c) Quantitative analysis of volume in cerebral cortex (CTX) and hippocampus (Hipp) areas (n = 4–5/group, one‐way ANOVA & Bonferroni's test). d,e) The correlation analysis of target quadrant time in the MWM test and volume of the CTX and Hipp (n = 4–5/group, Pearson correlation analysis). In order to evaluate neuronal loss in VCID brains, CV histological staining and NeuN immunofluorescence staining were conducted in miR‐15a/16‐1 KO and WT mouse brains harvested 35 d after VCID. f) Coordinates of CV and NeuN staining and brain regions for analysis. g) Representative images of CV staining in the CTX and Hipp regions (red arrows: pyknotic neuron cells). h,i) Quantitative analysis of normal‐like neurons in the CTX and Hipp areas (n = 6/group, one‐way ANOVA & Bonferroni's test). j) Representative images of NeuN staining in the CTX and Hipp areas (yellow arrows: NeuN‐negative staining areas). k,l) Quantitative analysis of NeuN‐positive neurons in the CTX and Hipp (n = 6/group, one‐way ANOVA & Bonferroni's test). Data are presented as mean ± SEM. * p<0.05, ** p<0.01, or *** p<0.001 versus VCID+WT group.
Figure 5
Figure 5
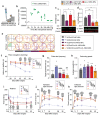
Genetic deletion of miR‐15a/16‐1 alleviates astroglial activation in WM and grey matter in mouse VCID brains. GFAP (astrocyte marker) immunofluorescence staining was conducted in miR‐15a/16‐1 KO and WT mouse brains harvested 3 d after VCID to evaluate the activation of astrocytes in the brain. a) Representative images of GFAP (green) staining in the CC, EC, CTX, and STR areas. b–e) Quantitative analysis of GFAP‐positive cells in the CC, EC, CTX, and STR areas (n = 6/group, one‐way ANOVA & Bonferroni's test). Data are represented as mean ± SEM. * p<0.05, ** p<0.01, or *** p<0.001 versus VCID+WT group.
Figure 6
Figure 6
MiR‐15a/16‐1 translationally suppresses AKT3 and IL‐10RA expression in mouse VCID brains. The expression of anti‐inflammatory mediators, AKT3 and IL‐10RA in both WM and grey matter were evaluated in miR‐15a/16‐1 KO and WT mouse brains harvested 3 d after VCID by qPCR and western blotting. a–d) Quantitative analysis of qPCR results showing AKT3 and IL‐10RA relative mRNA expression in the CC/EC and CTX areas (n = 5/group, one‐way ANOVA & Bonferroni's test). e,f) Representative western blotting images of pAKT (Ser473), AKT3, and IL‐10RA in the CC/EC and CTX areas. g–l) Quantitative analysis showing pAKT, AKT3, and IL‐10RA relative protein expression in the CC/EC and CTX areas (n = 5/group, one‐way ANOVA & Bonferroni's test). Data are presented as mean ± SEM. * p<0.05, ** p<0.01, or *** p<0.001 versus VCID+WT group. m,n) The partial sequence of mature mouse miR‐15a (mmu‐miR‐15a), and its wild‐type and mutated binding sequences on the 3’‐UTR (untranslated regions) regions of mouse AKT3 and IL‐10RA mRNAs. o,p) Quantitative data showing luciferase activity of the reporter vector containing a wild‐type or mutated 3’‐UTR of mouse AKT3 in HEK 293 cells with lentiviral gain‐ or loss‐of‐miR‐15a function by Lenti‐miR‐15a or miZip‐15a. q,r) Quantitative data showing luciferase activity of the reporter vector containing a wild‐type or mutated 3’‐UTR of mouse IL‐10RA in HEK 293 cells with lentiviral gain‐ or loss‐of‐miR‐15a function by Lenti‐miR‐15a or miZip‐15a (n = 4/group, one‐way ANOVA & Bonferroni's test). Data are presented as mean ± SEM. *** p<0.001 versus WT+miZip‐GFP or WT+Lenti‐GFP group.
Figure 7
Figure 7
AKT3 and IL‐10RA are mainly expressed in neurons and astrocytes and genetic deletion of miR‐15a/16‐1 rescues AKT3 and IL‐10RA decline in VCID brains. a,g) The expression profiles of AKT3 in different brain cells were detected by double immunostaining of AKT3 (red) with NeuN (neuron marker, green), GFAP (astrocyte marker, green), Iba‐1 (microglia marker, green), CD31 (blood vessel marker, green) and APC (oligodendrocyte marker, green) in sham‐operated mouse brains. 3D reconstruction images showing co‐immunostaining of AKT3/IL‐10RA with NeuN and GFAP (White arrow: co‐immunostained cells). The expression levels of AKT3 and IL‐10RA in different brain regions were also detected in miR‐15a/16‐1 KO and WT mice 3 d after VCID. b,h) Representative images showing immunostaining of AKT3 or IL‐10RA (red) and DAPI (blue) in CTX, CC/EC, STR, and Hipp areas. Quantitative analysis (n = 6/group, one‐way ANOVA & Bonferroni's test) of c–f) AKT3 or i–l) IL‐10RA. Mean fluorescence intensity in both WM (CC/EC, STR) and grey matter (CTX, Hipp). Data are presented as mean ± SEM. * p<0.05, ** p<0.01, or *** p<0.001 versus VCID+WT group.
Figure 8
Figure 8
Knockdown of cerebral AKT3 and IL‐10RA partially abolishes long‐term neurobehavioral improvements in miR‐15a/16‐1 KO mice after VCID. a) Schematic diagram of intranasal siRNA‐loaded NP administration. b) Quantitative analysis of fluorescence intensity in mouse brains after intranasal delivery of FITC‐siRNA‐NPs (n = 3/group). c,d) Western blotting images and quantitative analysis showing cerebral AKT3 and IL‐10RA expression at 5 d after AKT3 and IL‐10RA siRNA‐NP delivery (n = 3/group, one‐way ANOVA & Bonferroni's test). Cognitive function was evaluated by the MWM test at 30–35 d of VCID in miR‐15a/16‐1 KO and WT mice with the treatment of AKT3 and IL‐10RA siRNA‐NPs. e) Swim paths in learning and memory phases during the MWM test. f) The latency to find the hidden platform in the place navigation phase (learning). g) The swim time in the target quadrant in the probe test (memory). h) Average swimming speed in the MWM test. Sensorimotor function was also evaluated in miR‐15a/16‐1 KO and WT mice with the treatment of AKT3 and IL‐10RA siRNA‐NPs by rotarod and adhesive tape removal tests at indicated VCID time points. i) The time to fall in the rotarod test. j) The time to touch and k) time to remove the tape in the adhesive tape removal test. Data are presented as mean ± SEM, n = 5‐7/group. *, @, &, # p < 0.05; **, @@, &&, ## p < 0.01; and ***, @@@, &&&, ### p < 0.001 versus VCID+KO+ SC NPs. Statistical analyses were performed by one‐way ANOVA and Bonferroni's post‐hoc test (c, d, g, h) and two‐way ANOVA with Bonferroni's test (f, i–k).
Figure 9
Figure 9
Knockdown of cerebral AKT3 and IL‐10RA partially blocks the reduction of WM and grey matter injury in miR‐15a/16‐1 KO mice after VCID. LFB histological staining and MBP/SMI32 immunofluorescence double staining were conducted in brains from miR‐15a/16‐1 KO and WT mice intranasally treated with AKT3 and IL‐10RA siRNA‐loaded‐NPs to detect myelin loss and axonal damage at 35 d after VCID. a) Representative images of LFB staining in the CC, EC, and STR areas. b) Quantitative analysis of relative OD values of LFB in the CC, EC, and STR (n = 5–6/group, one‐way ANOVA & Bonferroni's test). c) Representative images of MBP (green) co‐immunostained with SMI32 (red). d) Quantitative analysis of MBP mean fluorescence intensities and e) ratio of SMI32/MBP in the CC, EC, and STR (n = 5–6/group, one‐way ANOVA & Bonferroni's test). CV and NeuN staining were conducted in miR‐15a/16‐1 KO and WT mice intranasally treated with AKT3 and IL‐10RA siRNA‐loaded‐NPs to evaluate grey matter damage at 35 d after VCID. f,g) Representative images of CV and NeuN (red) staining in the CTX and Hipp regions. h,i) Quantitative analysis of normal‐like neurons in the CTX and Hipp areas. j,k) Quantitative analysis of NeuN‐positive neurons in the CTX and Hipp areas (n = 5–6/group, one‐way ANOVA & Bonferroni's test). Data are presented as mean ± SEM. *, @, &, # p < 0.05; **, @@, &&, ## p < 0.01; and ***, @@@, &&&, ### p < 0.001 versus VCID+KO+SC NPs group.

References

    1. a) Khan A., Kalaria R. N., Corbett A., Ballard C., J. Geriatr. Psychiatry Neurol. 2016, 29, 281; - PubMed
    2. b) O'Brien J. T., Thomas A., Lancet 2015, 386, 1698; - PubMed
    3. c) O'Brien J. T., Erkinjuntti T., Reisberg B., Roman G., Sawada T., Pantoni L., Bowler J. V., Ballard C., DeCarli C., Gorelick P. B., Rockwood K., Burns A., Gauthier S., DeKosky S. T., Lancet Neurol. 2003, 2, 89. - PubMed
    1. a) Orgogozo J.‐M., Rigaud A.‐S., StöFfler A., MöBius H.‐J., Forette F. O., Stroke 2002, 33, 1834,; - PubMed
    2. b) Kavirajan H., Schneider L. S., Lancet Neurol. 2007, 6, 782. - PubMed
    1. Kalaria R. N., Akinyemi R., Ihara M., Biochim. Biophys. Acta 2016, 1862, 915. - PMC - PubMed
    1. Zhang J., Sun P., Zhou C., Zhang X., Ma F., Xu Y., Hamblin M. H., Yin K. J., CNS Neurosci. Ther. 2020, 26, 1207. - PMC - PubMed
    1. a) Hase Y., Horsburgh K., Ihara M., Kalaria R. N., J. Neurochem. 2018, 144, 617; - PubMed
    2. b) Duncombe J., Kitamura A., Hase Y., Ihara M., Kalaria R. N., Horsburgh K., Clin. Sci. 2017, 131, 2451; - PubMed
    3. c) Mao L., Yang T., Li X., Lei X., Sun Y., Zhao Y., Zhang W., Gao Y., Sun B., Zhang F., J. Cereb. Blood Flow Metab. 2019, 39, 352. - PMC - PubMed

LinkOut - more resources