. 2022 Apr 26;13(2):e0384921.
doi: 10.1128/mbio.03849-21. Epub 2022 Apr 11.

Entamoeba histolytica EHD1 Is Involved in Mitosome-Endosome Contact

Affiliations

Entamoeba histolytica EHD1 Is Involved in Mitosome-Endosome Contact

Herbert J Santos et al. mBio. .

Abstract

Interorganellar cross talk is often mediated by membrane contact sites (MCSs), which are zones where participating membranes come within 30 nm of one another. MCSs have been found in organelles, including the endoplasmic reticulum, Golgi bodies, endosomes, and mitochondria. Despite its seeming ubiquity, reports of MCS involving mitochondrion-related organelles (MROs) present in a few anaerobic parasitic protozoa remain lacking. Entamoeba histolytica, the etiological agent of amoebiasis, possesses an MRO called the mitosome. We previously discovered several Entamoeba-specific transmembrane mitosomal proteins (ETMPs) from in silico and cell-biological analyses. One of them, ETMP1 (EHI_175060), was predicted to have one transmembrane domain and two coiled-coil regions and was demonstrated to be mitosome membrane integrated based on carbonate fractionation and immunoelectron microscopy (IEM) data. Immunoprecipitation analysis detected a candidate interacting partner, EH domain-containing protein (EHD1; EHI_105270). We expressed hemagglutinin (HA)-tagged EHD1 in E. histolytica, and subsequent immunofluorescence and IEM data indicated an unprecedented MCS between the mitosome and the endosome. Live imaging of a green fluorescent protein (GFP)-EHD1-expressing strain demonstrated that EHD1 is involved in early endosome formation and is observed in MCS between endosomes of various sizes. In vitro assays using recombinant His-EHD1 demonstrated ATPase activity. MCSs are involved in lipid transfer, ion homeostasis, and organelle dynamics. The serendipitous discovery of the ETMP1-interacting partner EHD1 led to the observation of the mitosome-endosome contact site in E. histolytica. It opened a new view of how the relic mitochondria of Entamoeba may likewise be involved in organelle cross talk, a conserved feature of mitochondria and other organelles in general. IMPORTANCE Membrane contact sites (MCSs) are key regulators of interorganellar communication and have been widely demonstrated between various organelles. However, studies on MCSs involving mitochondrion-related organelles (MROs), present in some anaerobic parasitic protozoans, remain scarce. Entamoeba histolytica, the etiological agent of amoebiasis, possesses an MRO called the mitosome. This organelle is crucial for cellular differentiation and disease transmission, thereby significantly contributing to the amoeba's parasitic lifestyle. Our recent discovery of the interaction between the Entamoeba-specific transmembrane mitosomal protein (ETMP1) and EH domain-containing protein (EHD1) showcases a newly found mitosome-endosome contact site in E. histolytica. This finding reflects the idea that despite their substantially divergent and reduced nature, MROs like mitosomes conserve mechanisms for interorganellar cross talk. We posit lipid and ion transport, mitosome fission, and quality control as potential processes that are mediated by the ETMP1-EHD1-tethered mitosome-endosome contact site in E. histolytica.

Keywords: EH domain; Entamoeba histolytica; endosome; membrane contact site; mitochondrion-related organelles; mitosome.


Conflict of interest statement

The authors declare no conflict of interest.

Figures

FIG 1
FIG 1
Multiple sequence alignment of ETMP1 orthologs in Entamoeba. Amino acid sequences of orthologs in E. histolytica (EHI_175060), E. nuttalli (ENU1_040700), E. dispar (EDI_139180), and E. moshkovskii (EMO_001640) were aligned using MAFFT (67) and displayed using Jalview (68). The hydrophobic, positively charged, negatively charged, polar, cysteine, glycine, proline, and aromatic residues are indicated in blue, red, magenta, green, pink, orange, yellow, and cyan, respectively. Dashed black boxes show the coiled-coil domains predicted by DeepCoil (64), while the dashed red box indicates the transmembrane region predicted by our TMD prediction tool (12).
FIG 2
FIG 2
Expression and localization of HA-ETMP1 in E. histolytica trophozoites. (A) Approximately 30 μg protein from whole-cell lysates of HA-ETMP1 and mock control (pEhEx-HA) strains were separated by SDS-PAGE and subjected to anti-HA immunoblot analysis (top). The 33-kDa band corresponds to the predicted molecular mass of HA-ETMP1. As a loading control, cysteine synthase 1 (CS1) was probed using anti-CS1 antibody (bottom). (B) Immunofluorescence analysis of HA-ETMP1-expressing trophozoites, double stained with anti-HA (green) and anti-APSK (red). White arrowheads in the merged panel point to colocalization of anti-HA and anti-APSK signals. Bar = 10 μm. (C) Fractionation of HA-ETMP1 by discontinuous Percoll gradient ultracentrifugation. Homogenate of HA-ETMP1 was separated by density against a Percoll gradient. Approximately 15 μL of fractions collected from the first (1 to 22) and second (A to V) ultracentrifugation steps was separated by SDS-PAGE followed by immunoblot analysis with anti-HA and anti-Cpn60 antibodies, respectively. (D) Anti-HA and anti-Cpn60 immunoblot profiles of subcellular fractionation, including alkaline carbonate-treated organelle-rich fractions of HA-ETMP1 and HA-MBOMP30 (mitosome membrane control). (E) Representative immunoelectron micrographs of 15-nm anti-APSK–gold-labeled mitosomes of HA-ETMP1, costained with 5-nm anti-HA–gold. Bar = 200 nm.
FIG 3
FIG 3
Effect of overexpression on the growth of HA-ETMP1 strain. (A) Representative growth curves showing cell numbers of HA-ETMP1 (red) and mock-HA (black) strains cultivated in BI-S-33 medium containing 0, 10, and 20 μg/mL G418, plotted against time. Growth curves from the other two experiments are shown in Fig. S2A. (B) Doubling time of HA-ETMP1 (red) and mock-HA (black) calculated at various concentration of G418. Statistical significance was analyzed using Student's t test. n =3. *, P < 0.05; **, P < 0.005; ***, P < 0.0005. (C) Western blot analysis of whole-cell lysates of HA-ETMP1 and mock-HA grown in medium containing 0, 10, and 20 μg/mL G418. Top and bottom panels show anti-HA and anti-CPBF1 (loading control) immunoblots, respectively.
FIG 4
FIG 4
Anti-HA bead immunoprecipitation (IP) of mock-HA and HA-ETMP1 strains. (A) Western blot analysis using anti-HA antibody of the cell lysates and various IP fractions of mock-HA (left) and HA-ETMP1 (right). A black arrowhead indicates the position of HA-tagged ETMP1 (33 kDa). (B) Silver-stained-SDS-PAGE gel of IP eluates of mock-HA and HA-ETMP1 strains. A black arrowhead points to a specific ∼55-kDa band unique to HA-ETMP1. (C) Enriched or exclusively detected proteins in the ∼55-kDa excised gel band from HA-ETMP1 IP eluate compared to that of mock-HA control IP eluate by liquid chromatography-tandem mass spectrometry (LC-MS/MS) sequencing analysis. MW, predicted molecular weight; Qv, quantitative value (normalized total spectra). The presence of the detected proteins in the previously published mitosome proteome data (18) was analyzed, and the results are listed in the last column (+, present; −, absent). (D) Total cell lysates of mock-HA and HA-ETMP1 were separated by BN-PAGE, followed by anti-HA Western blot analysis. Black and red arrowheads indicate the ∼180-kDa and ∼90-kDa complexes, respectively, that contain HA-ETMP1.
FIG 5
FIG 5
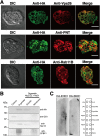
HA-EHD1 expression in E. histolytica trophozoites. (A) Anti-HA immunoblot analysis of approximately 30 μg total cell lysates of mock-HA and HA-EHD1 shows a 61-kDa band corresponding to HA-tagged EHD1 (top). CS1, detected by anti-CS1 antiserum, was used as a loading control (bottom). (B and C) Representative immunofluorescence images of fixed HA-EHD1-expressing cells double-stained with anti-HA (green) and anti-APSK (red) antibodies. The arrow and arrowheads indicate proximity and colocalization between anti-HA and anti-APSK signals, respectively. Bar = 10 μm. (D) Representative immunoelectron micrographs of HA-EHD1 trophozoites, double stained with 5-nm anti-HA–gold and 15-nm anti-APSK–gold. Bar = 200 nm. c, cytosol; e, endosome; m, mitosome. An arrow points to the structure where the membranes of the mitosome and endosome are in close contact. The mitosome in the right panel was identified by its discrete double-membrane structure and highly electron-dense matrix. (E) Percoll gradient fractionation of HA-EHD1 followed by Western blotting analysis using anti-HA and ant-Cpn60 antibodies.
FIG 6
FIG 6
Association of HA-EHD1 with the E. histolytica membranes. (A) Colocalization analysis of HA-EHD1 with various endosomal markers. Representative IFA images of HA-EHD1 costained with anti-HA (green) and anti-vacuolar protein sorting 26 (Vps26 [red, top]), anti-pyridine nucleotide transhydrogenase (PNT [red, middle]), and anti-Rab11B (red, bottom). (B) Immunoblot analysis of carbonate fractionation assay of the HA-EHD1 organelle-rich fraction using (from top to bottom) anti-HA, anti-CS1 (cytosolic protein control), anti-Sec13 (peripheral membrane protein control), and anti-CPBF1 (integral membrane protein control). (C) Lipid overlay assay of HA-EHD1 and HA-SNX1 (PI3P binding protein control). The membrane strips contain 100 pmol of the following lipids per spot: lysophosphatidic acid (LPA), lysophosphocholine (LPC), phosphatidylinositol (PtdIns), phosphatidylinositol (3)-phosphate [PI(3)P], phosphatidylinositol (4)-phosphate [PI(4)P], phosphatidylinositol (5)-phosphate [PI(5)P], phosphatidylethanolamine (PE), phosphatidylcholine (PC), sphingosine 1-phosphate (S1P), phosphatidylinositol (3,4)-bisphosphate [PI(3,4)P2], phosphatidylinositol (3,5)-bisphosphate [PI(3,5)P2], phosphatidylinositol (4,5)-bisphosphate [PI(4,5)P2], phosphatidylinositol (3,4,5)-trisphosphate [PI(3,4,5)P3], phosphatidic acid (PA), and phosphatidylserine (PS).
FIG 7
FIG 7
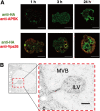
Involvement of HA-EHD1 in multivesicular body formation. (A) Representative anti-HA antibody and anti-APSK antiserum (top) or anti-Vps26 antiserum (bottom) double-staining IFA images of trophozoites that expressed HA-EHD1 trophozoites after 1, 3, and 24 h of induction by tetracycline. Bar = 10 μm. (B) Representative immunoelectron image of a trophozoite expressing HA-EHD1 24 h after tetracycline induction, stained with 15-nm gold–anti-HA. c, cytosol; MVB, multivesicular body; ILV, intraluminal vesicle. Bar = 200 nm.
FIG 8
FIG 8
Involvement of GFP-EHD1 in amoebic endocytosis. (A) Anti-GFP immunoblot analysis of approximately 20 μg total lysate of GFP-EHD1-expressing trophozoites. (B) Confocal microscopy images from movies of live trophozoites expressing GFP-EHD1 (left) and GFP-EHD1 in medium supplemented with either RITC-dextran (middle) or Alexa Fluor 568-transferrin (right). Bar = 10 μm.
FIG 9
FIG 9
Participation of HA-EHD1 in amoebic phagocytosis and trogocytosis. Representative IFA images of fixed anti-HA (green) and anti-Vps26 (red) double-stained HA-EHD1 trophozoites 15, 30, and 60 min (top to bottom) after coincubation with CellTracker blue-stained CHO cells. The white arrow in the top panel indicates the base of the phagocytic cup. The white arrowhead in the bottom panel points to the tubulation of a trogosome. Bar = 10 uμ
FIG 10
FIG 10
Activity assay of purified recombinant His-EHD1. (A) Coomassie brilliant blue-stained SDS-PAGE gel (left) and anti-His immunoblot (right) of purification fractions of His-EHD1. (B) Specific activity of His-EHD1, determined using ATP as the substrate at various concentrations.

Similar articles

Cited by

References

    1. Jain A, Holthuis JCM. 2017. Membrane contact sites, ancient and central hubs of cellular lipid logistics. Biochim Biophys Acta Mol Cell Res 1864:1450–1458. doi:10.1016/j.bbamcr.2017.05.017. - DOI - PubMed
    1. Helle SCJ, Kanfer G, Kolar K, Lang A, Michel AH, Kornmann B. 2013. Organization and function of membrane contact sites. Biochim Biophys Acta 1833:2526–2541. doi:10.1016/j.bbamcr.2013.01.028. - DOI - PubMed
    1. Scorrano L, De Matteis MA, Emr S, Giordano F, Hajnóczky G, Kornmann B, Lackner LL, Levine TP, Pellegrini L, Reinisch K, Rizzuto R, Simmen T, Stenmark H, Ungermann C, Schuldiner M. 2019. Coming together to define membrane contact sites. Nat Commun 10:1287. doi:10.1038/s41467-019-09253-3. - DOI - PMC - PubMed
    1. Hoyer MJ, Chitwood PJ, Ebmeier CC, Striepen JF, Qi RZ, Old WM, Voeltz GK. 2018. A novel class of ER membrane proteins regulates ER-associated endosome fission. Cell 175:254–265. doi:10.1016/j.cell.2018.08.030. - DOI - PMC - PubMed
    1. Wong YC, Ysselstein D, Krainc D. 2018. Mitochondria-lysosome contacts regulate mitochondrial fission via RAB7 GTP hydrolysis. Nature 554:382–386. doi:10.1038/nature25486. - DOI - PMC - PubMed

Publication types

LinkOut - more resources