. 2022 Apr 11:11:e73225.
doi: 10.7554/eLife.73225.

Evolution of binding preferences among whole-genome duplicated transcription factors

Affiliations

Evolution of binding preferences among whole-genome duplicated transcription factors

Tamar Gera et al. Elife. .

Abstract

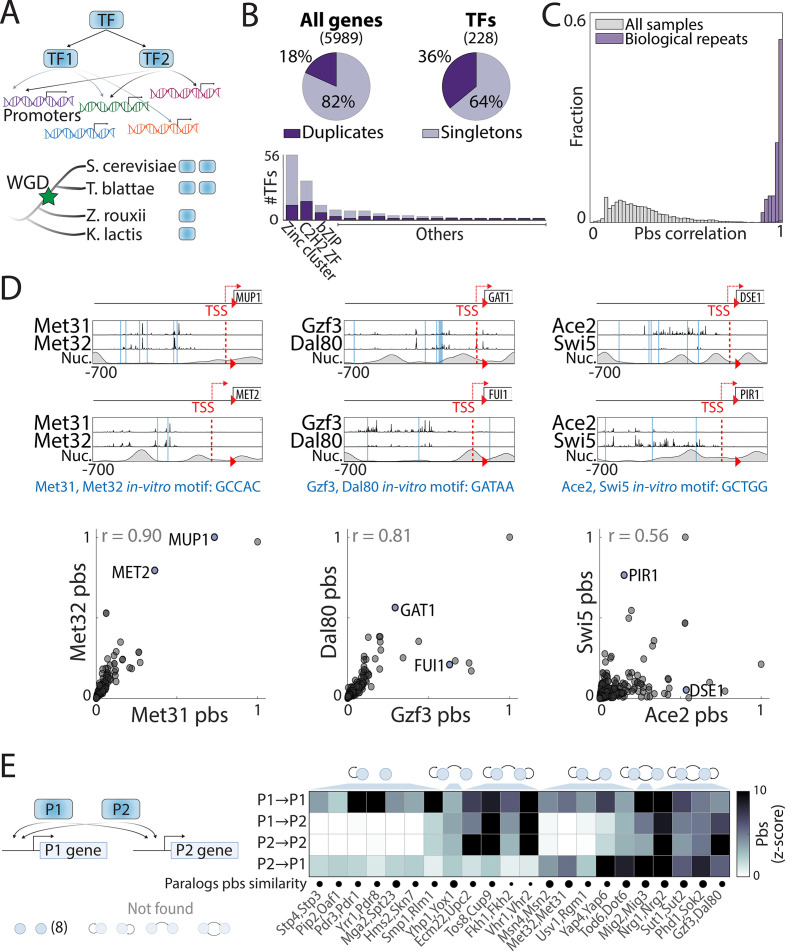
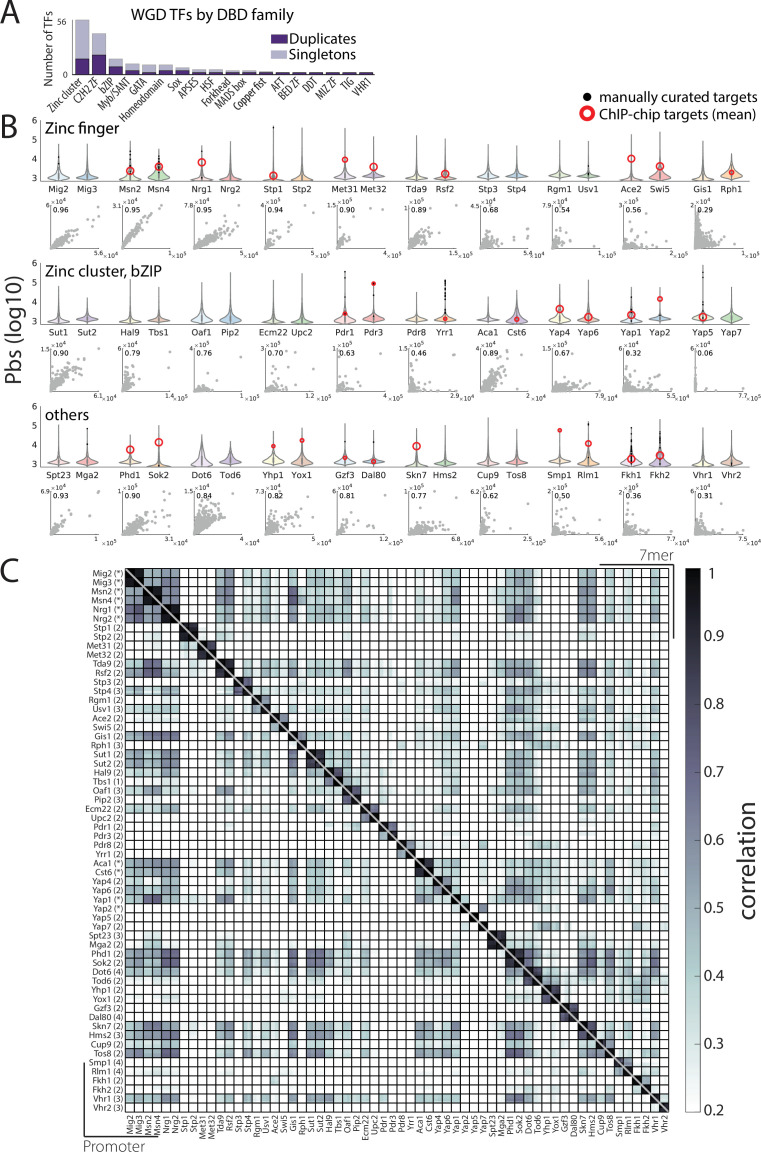
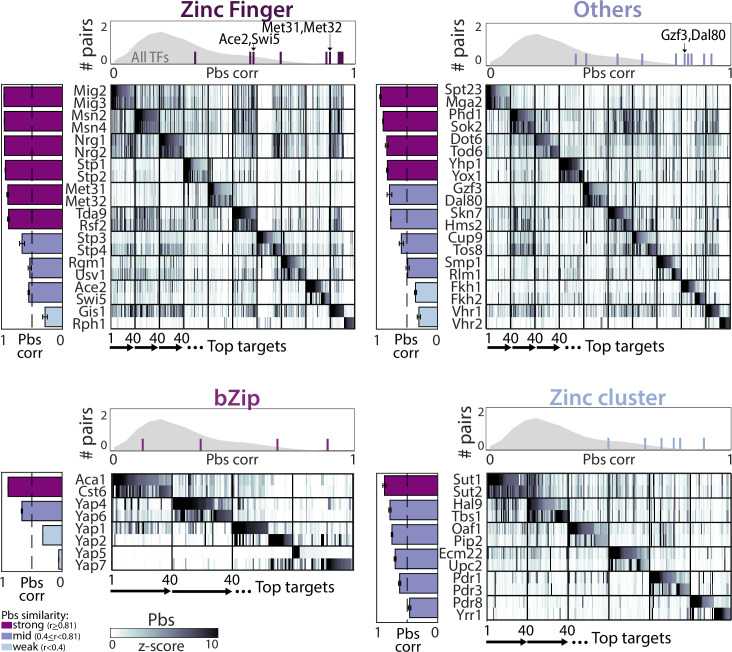
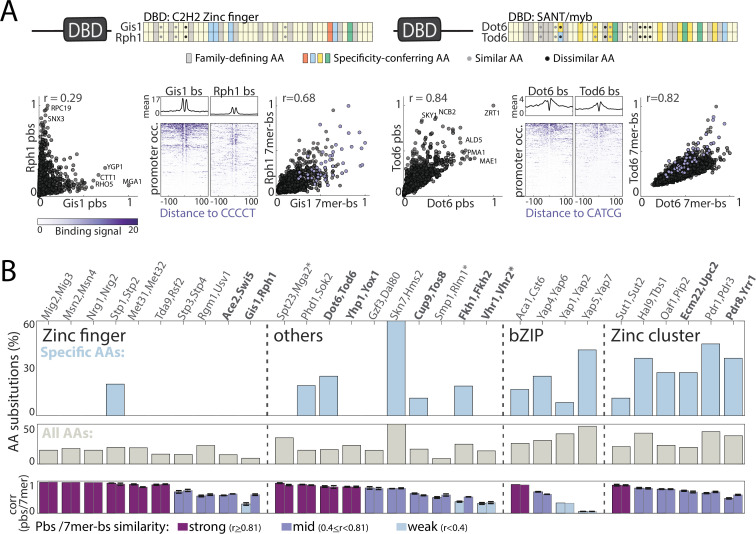
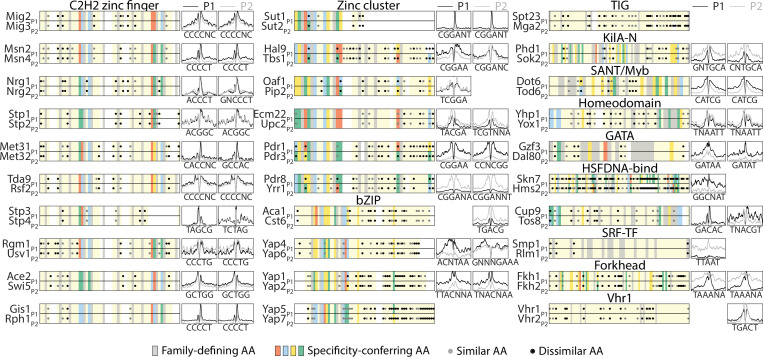
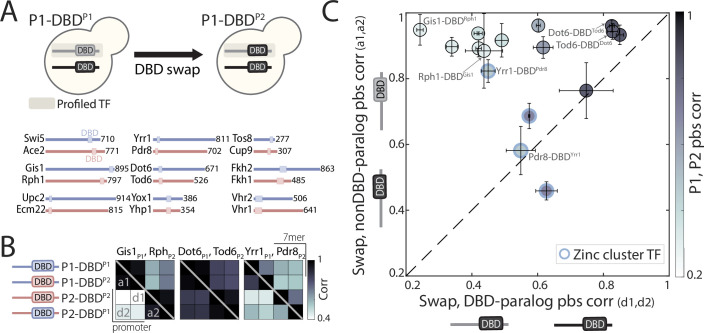
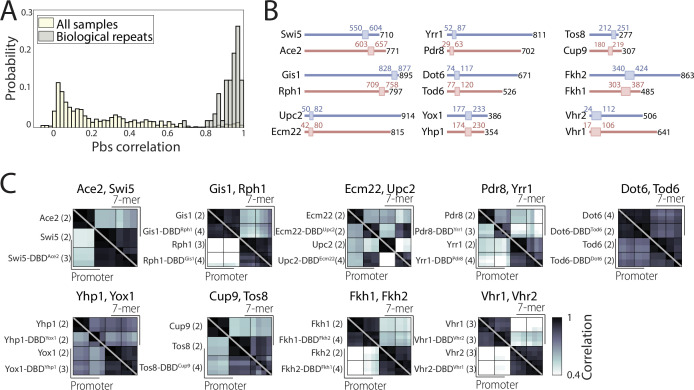
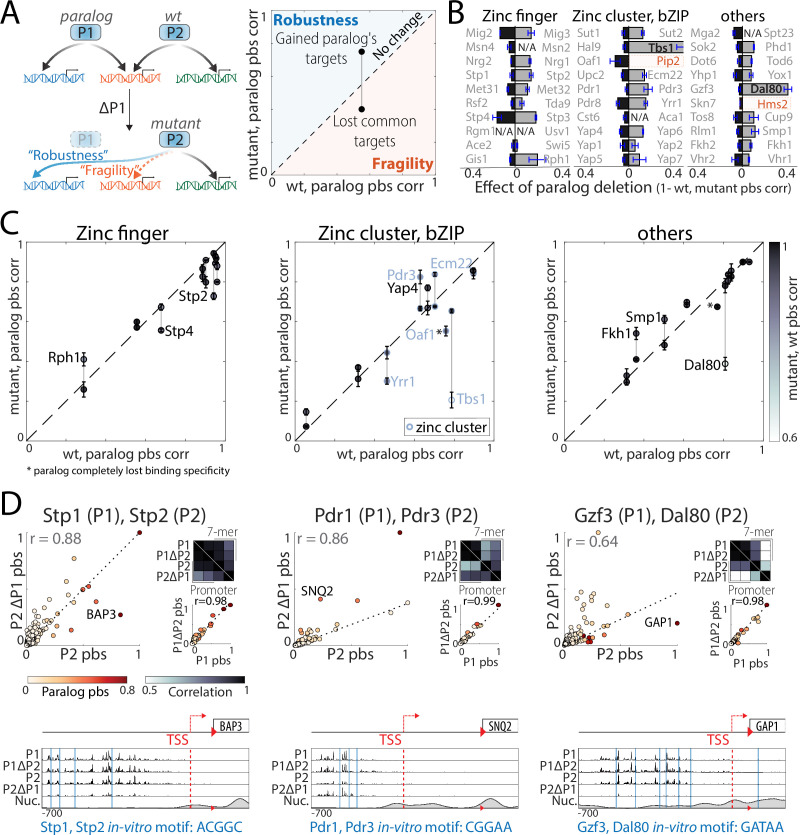
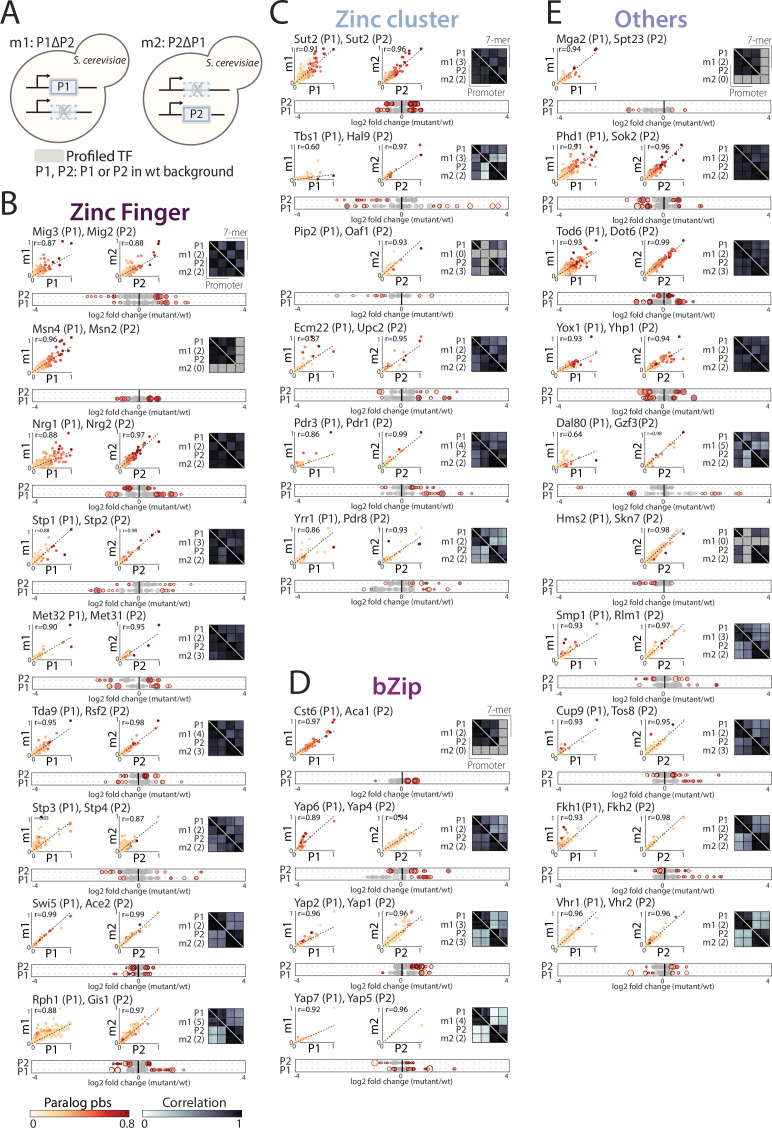
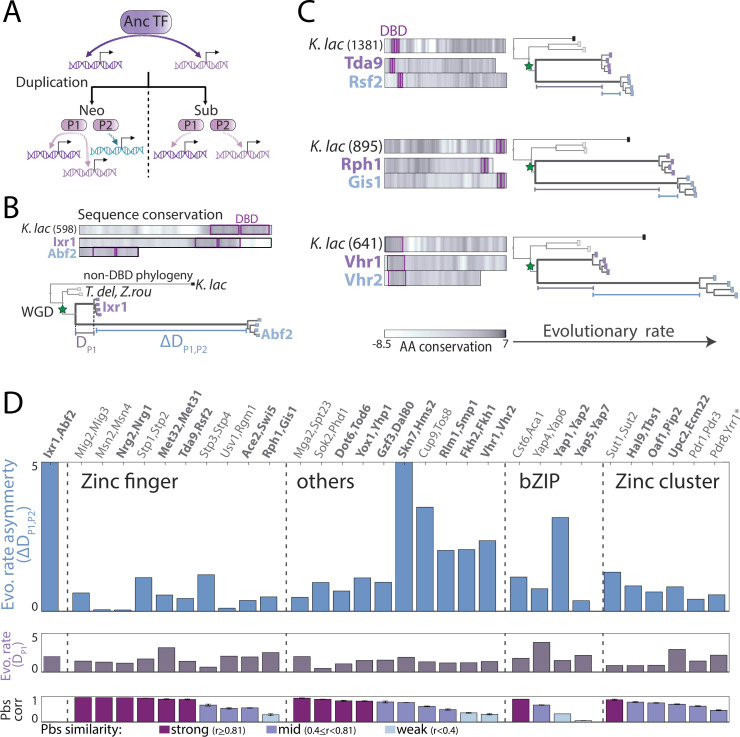
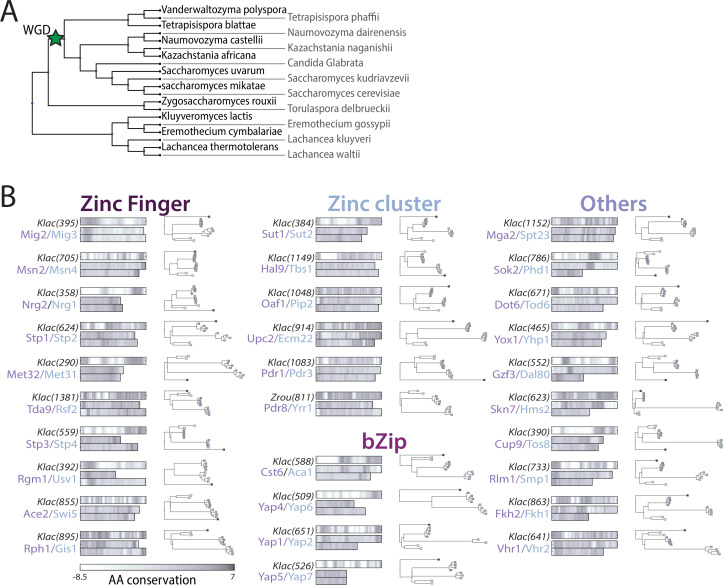
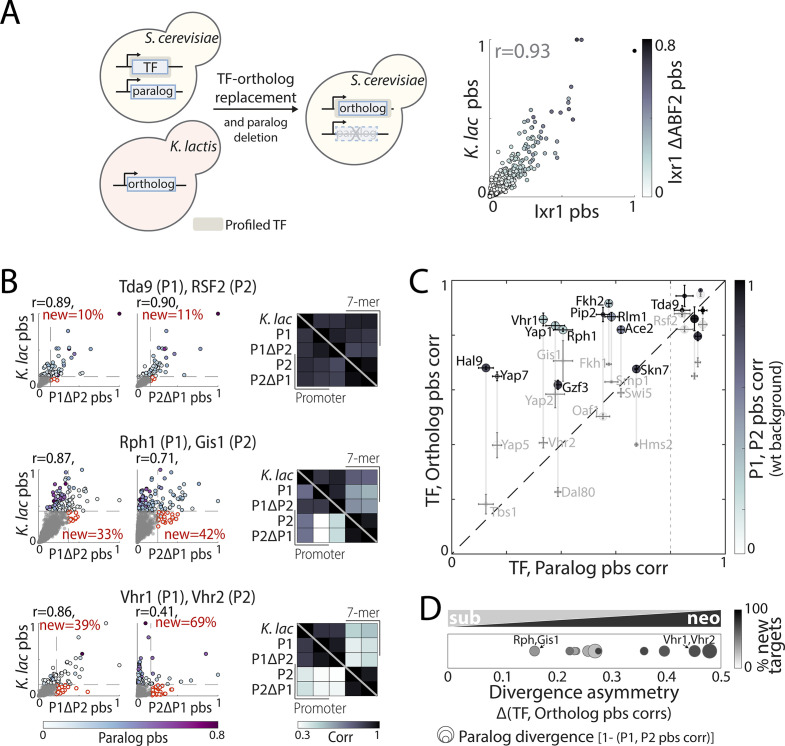
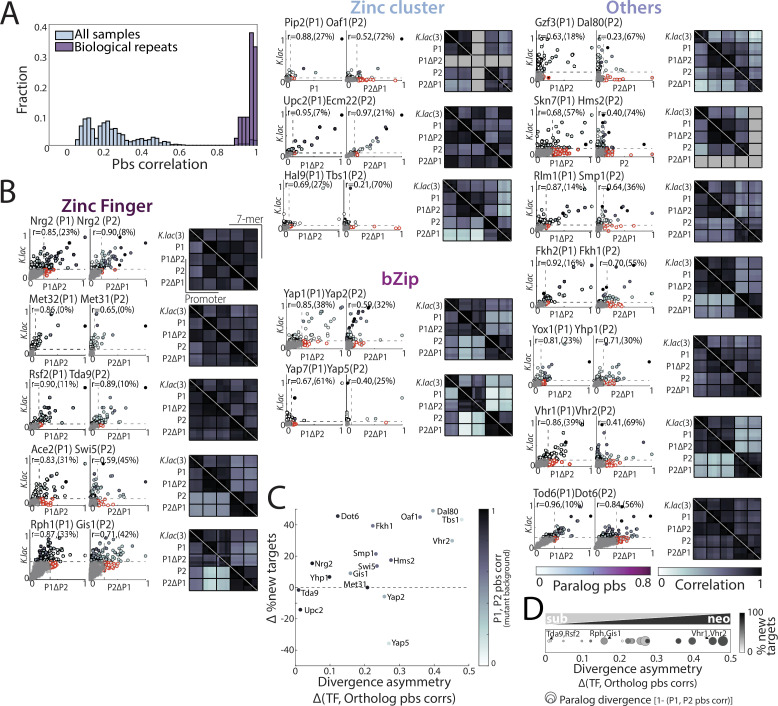
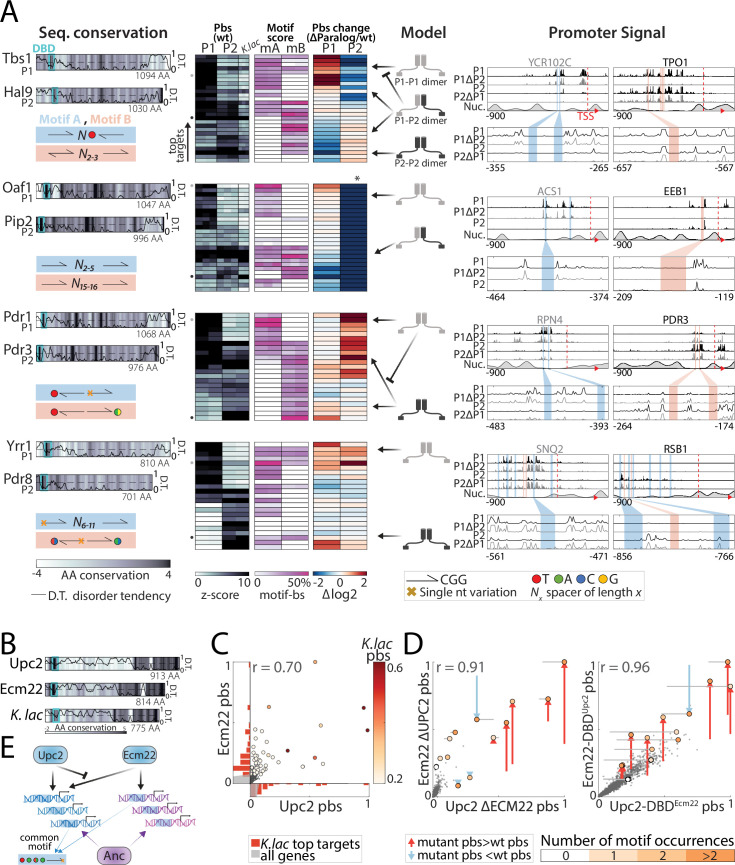
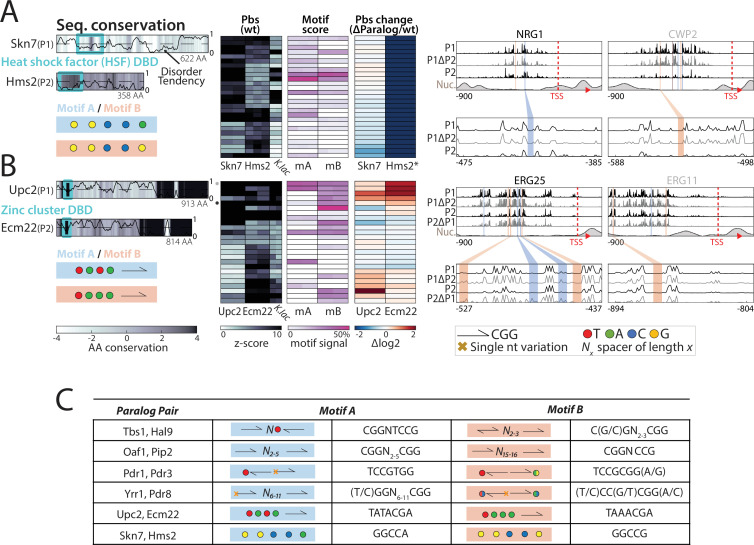
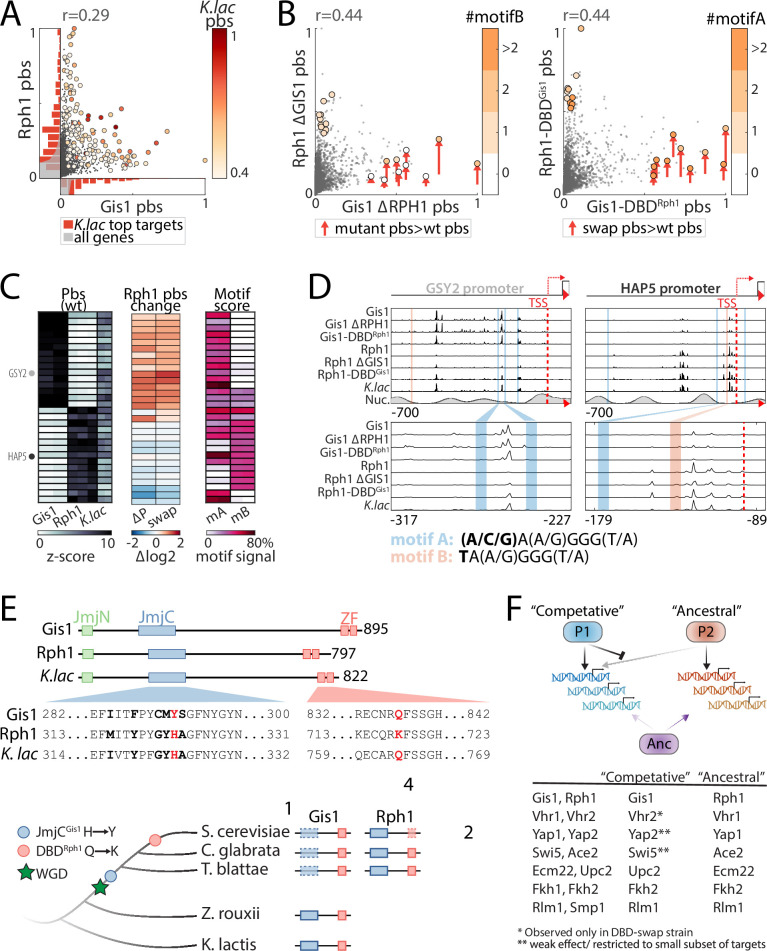
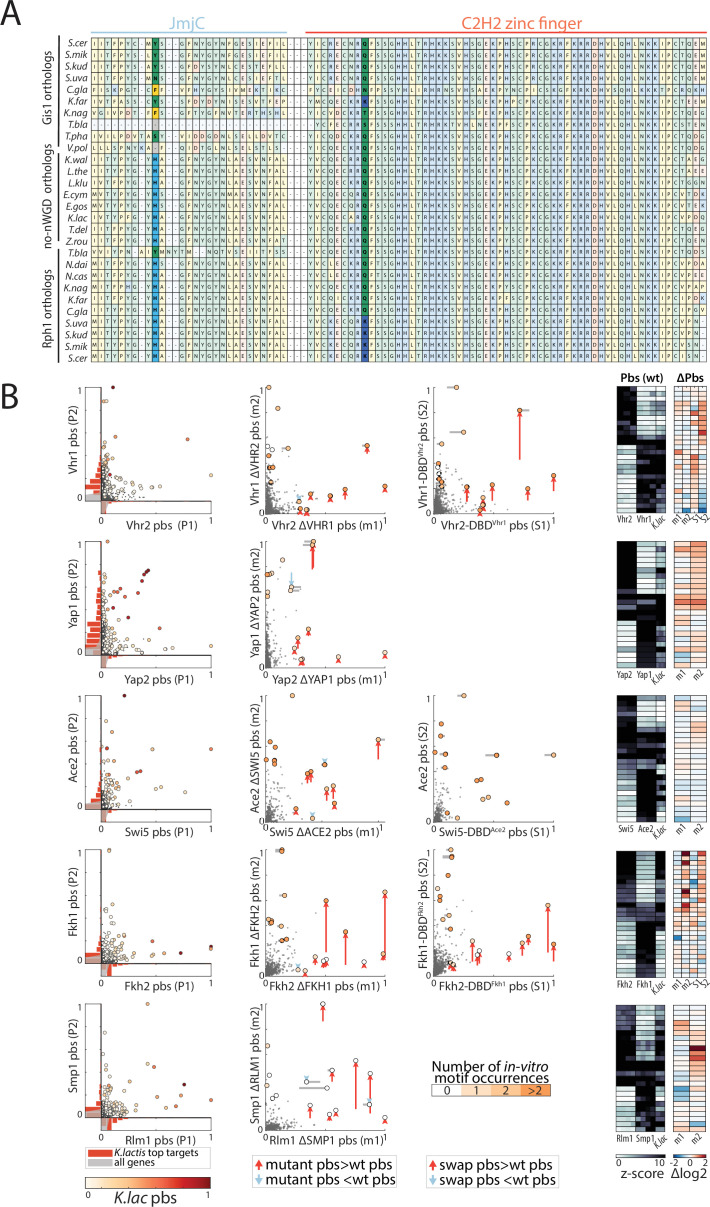
Throughout evolution, new transcription factors (TFs) emerge by gene duplication, promoting growth and rewiring of transcriptional networks. How TF duplicates diverge was studied in a few cases only. To provide a genome-scale view, we considered the set of budding yeast TFs classified as whole-genome duplication (WGD)-retained paralogs (~35% of all specific TFs). Using high-resolution profiling, we find that ~60% of paralogs evolved differential binding preferences. We show that this divergence results primarily from variations outside the DNA-binding domains (DBDs), while DBD preferences remain largely conserved. Analysis of non-WGD orthologs revealed uneven splitting of ancestral preferences between duplicates, and the preferential acquiring of new targets by the least conserved paralog (biased neo/sub-functionalization). Interactions between paralogs were rare, and, when present, occurred through weak competition for DNA-binding or dependency between dimer-forming paralogs. We discuss the implications of our findings for the evolutionary design of transcriptional networks.

Keywords: DNA binding; S. cerevisiae; evolutionary biology; functional divergence; gene regulation; genetics; genomics; paralogs; transcription factors; whole genome duplication.


Conflict of interest statement

TG, FJ, RM No competing interests declared, NB Senior editor, eLife

Figures

Figure 1.
Figure 1.. Mapping the promoter-binding preferences of whole-genome duplication (WGD) transcription factors (TFs).
(A–B) WGD shaped the budding yeast transcription network: (A) TF duplicates (paralogs) can diverge to bind different targets. (B) In Saccharomyces cerevisiae, ~35% (Gietz et al., 1995) of all present-day TFs are retained WGD paralogs, belonging to 18 different DNA-binding domain families (see Figure 1—figure supplement 1). (C) TF-binding profiles are reproducible: Shown is the distribution of correlations between different samples (gray) and between biological repeats (purple). Correlations are between promoter-binding signals (pbs). (D) Binding profiles of indicated TF-paralog pairs. Top: Measured binding signal and nucleosome occupancy (Nuc.) on individual promoters (see Materials and methods). Lines indicate transcription start sites (TSS, red dashed) and locations of in vitro motifs (blue). Bottom: Pbs of the indicated TF-paralog pairs (each dot is a promoter, r: Pearson’s correlation). (E) Auto- and cross-promoter binding by TF paralogs: Pbs is shown as z-score. Potentially formed circuits indicated on top. Note that 22/30 pairs are associated with six of nine possible circuits.
Figure 1—figure supplement 1.
Figure 1—figure supplement 1.. Sensitive, accurate, and reproducible mapping of whole-genome duplication (WGD) transcription factors (TFs) DNA-binding profiles with chromatin endogenous cleavage with high-throughput sequencing (ChEC-seq).
(A) WGD TFs by DNA-binding domain (DBD) family: Shown are the number of TFs in each family divided into WGD duplicates and singletons. (B) TFs promoter-binding signal (pbs) using ChEC-seq identifies known and new target promoters: Pbs distribution for all WGD-generated TF paralogs (top violin plot, log-scale) and direct paralog-paralog comparison (x-axis first paralog). Manually curated and chromatin immunoprecipitation with DNA microarray (ChIP-chip) targets from Saccharomyces cerevisiae genome database (SGD) (Cherry et al., 2012) are highlighted and intra-pair Pearson’s r indicated (scatter plot, left-top corner). (C) Distinct and reproducible binding profiles for 60 mapped TFs: Binding signal correlation (bottom triangle: promoters, top triangle: 7-mers, Pearson’s r) between all repeats for all profiled TFs (each row/column corresponds to an individual biological repeat, number of repeats indicated in parenthesis, * indicates profiles obtained from Brodsky et al., 2020).
Figure 2.
Figure 2.. Divergence of promoter-binding preferences in whole-genome duplication (WGD) transcription factor (TF) paralogs.
The 40 top-bound promoters by each paralog pair (y-axis) were selected (see Supplementary file 2), ordered along the x-axis, and color-coded according to promoter binding signal (pbs, z-score). TFs are organized by DNA-binding domain (DBD) families, as indicated. Bars on the left depict correlations in binding preferences (pbs similarity) of respective paralogs and are summarized for all paralogs of the indicated family (individual lines) and non-paralog TFs (gray) in the histogram on top.
Figure 3.
Figure 3.. Sequence variations distinguishing paralogs’ DNA-binding domains (DBDs).
(A–B) Classifying DBD residue substitutions. (A) For all paralog pairs, Pfam-defined DBDs were aligned and residues classified into those conserved among all family members (gray) and specificity-conferring ones (colored: blue, red, yellow, and green denoting positive, negative, hydrophobic and hydrophilic residues, respectively) (Lambert et al., 2019). Amino acid (AA) substitutions into biophysically similar or dissimilar residues are indicated as gray and black dots, respectively. Two examples are shown, as indicated, see Figure 3—figure supplement 1 for other pairs. Also shown are comparisons of binding signals across promoters (left) or 7-mers (right, purple dots indicate 7-mers containing the in vitro motif), as well as the binding signals around in vitro-motif occurrences (middle). (B) Fraction of amino acid substitutions among specificity-conferring (top) and all (middle) DBD residues between the paralog pairs. Also shown are the correlations in promoter and 7-mer binding signal between the respective paralogs (bottom, left and right bar, respectively). Note the little correspondence between DBD sequence variations and divergence of binding profiles. Paralogs chosen for further DBD-swapping analysis (Figure 4) are highlighted in bold, *: indicates paralogs from DBD families where specificity-conferring residues are not available.
Figure 3—figure supplement 1.
Figure 3—figure supplement 1.. Sequence variations distinguishing paralog DNA-binding domains (DBDs).
DBD sequence conservation varies between paralog pairs but is not associated with changes in motif selection. Shown are the aligned DBDs of both paralogs and highlighted are conserved residues among all family members (gray), specificity-conferring residues (colored: blue, red, yellow, and green for positive, negative, hydrophilic, and hydrophobic residues, respectively) and amino acid (AA) substitutions into biophysically similar or dissimilar residues (gray and black dots, respectively). Also shown is the mean in vivo binding signal of both paralogs (black: P1, gray: P2) around the known in vitro motifs of both TFs (left: P1, right: P2, Figure 3A, Materials and methods).
Figure 4.
Figure 4.. DNA-binding domain (DBD) swapping has a minor effect on binding preferences.
(A) DBD-swapping experimental scheme: DBDs of the indicated paralog pairs were swapped, and their binding profiles mapped. (B) Correlations of binding preferences between the indicated transcription factors (TFs) and their swapped variants (bottom triangle: promoters, top triangle: 7-mers; see also Figure 4—figure supplement 1 for all tested pairs). (C) Correlation in promoter-binding signals (pbs) between paralogs and their swapped variants, as indicated. Blue indicates zinc cluster TFs; shading depicts correlation between the wild-type paralogs. Note that outside the zinc cluster family, DBD-swapping is of little consequence for promoter-binding preferences, even among highly divergent paralogs. Within the zinc cluster family, DBD-swapping affected binding profiles, but did not recover binding preferences of the paralog from which the DBD was taken.
Figure 4—figure supplement 1.
Figure 4—figure supplement 1.. Swapping experiment confirms functional conservation of DNA-binding domains (DBDs) between paralogs.
(A) Reliable binding profiles can be obtained for DBD-swapped transcription factor (TF) variants: Distribution of pairwise promoter-binding signal (pbs) correlation between all samples (off-white) and biological repeats (gray) indicates distinct, reproducible binding profiles for DBD-swapped TF variants. (B) DBD length and position in TFs examined for the DBD-swapping experiment: Drawn to scale are the full protein (black number indicates length in amino acids) and the position of the DBD (box and colored numbers) based on Saccharomyces cerevisiae genome database (SGD) Pfam annotation (red and blue correspond to the colors used in Figure 4A). (C) DBD-swapping has a minor effect on binding preferences: Shown are pbs correlations between individual repeats of the indicated TFs and their swapped variants (each row/column corresponds to an individual repeat, number of repeats indicated in parenthesis, bottom triangle: promoters, top triangle: 7-mers, see also Figure 4).
Figure 5.
Figure 5.. Interactions between transcription factor (TF) paralogs may increase network fragility.
(A) Paralogs’ contribution to mutation robustness or fragility: Following paralog deletion, a TF may gain access to its paralog’s unique sites, potentially compensating for the loss (‘robustness’, blue line: gained paralog target). Alternatively, paralogs may become interdependent and loose common targets after paralog deletion (‘fragility’, dashed orange line: lost common target). At the genome level, these interactions can be summarized by comparing a TF’s binding preferences in wild-type (x-axis) or paralog-deleted (y-axis) backgrounds to those of the paralog. (B) Strong paralog interactions are rare: the effect of paralog deletion on promoter-binding preferences was measured for 55 of 60 TFs in our dataset. Shown is the effect of paralog deletion on binding preferences for each TF. Note that most deletions were of little effect and that large effects were asymmetric. Also indicated are substantial effects (TFs written in black) and TFs that completely lost binding specificity (orange, see Materials and methods; N/A: not profiled). (C–D) Paralog interactions within individual families: (C) robustness/fragility analysis, as in (A) for all tested paralog pairs, divided into families (*: paralog completely lost binding specificity). (D) Shown are individual examples of the depicted correlations (see Figure 5—figure supplement 1 for all tested pairs). Note that Stp2 and Dal80 loose binding to some of their paralog’s targets upon paralog deletion (‘fragility’), whereas Pdr3 gains binding to Pdr1 targets (e.g. SNQ2) upon the latter’s deletion (‘robustness’).
Figure 5—figure supplement 1.
Figure 5—figure supplement 1.. Paralog deletion indicates gene-specific paralog-paralog interactions.
(A) Mapping transcription factor (TF)-binding profiles in paralog-deletion background: Experimental scheme for profiling of paralog-deletion mutants. (B–D) Paralog deletion mostly affects binding to individual genes: Shown are the direct comparison of a TF’s promoter-binding preferences in wild-type versus mutant background, the correlation (right square) between promoter (bottom triangle) or 7-mer binding preferences (top triangle), separated by DNA-binding domain (DBD) families. Each row/column corresponds to an individual repeat, with the total number of biological repeats indicated in parenthesis. Shown on the bottom is the relative binding change following paralog deletion (log2 fold change, dot color and size indicate a TF’s and its paralog’s promoter binding signal (pbs), respectively, and Materials and methods).
Figure 6.
Figure 6.. Asymmetric sequence evolution in whole-genome duplication (WGD) transcription factor (TF) paralog pairs.
(A) Models of functional divergence after WGD: Paralogs could diverge by one-sided acquisition of new preferences (neo-functionalization) or by splitting ancestral preferences (sub-functionalization). (B–C) Sequence evolution of indicated paralog pairs. (B) Sequence variations among Ixr1/Abf2, a strongly diverged paralog pair. Top: Sequence conservation between the Kluyveromyces lactis ortholog and the non-WGD consensus sequence, or each Saccharomyces cerevisiae paralogs and the K. lactis ortholog along the respective protein length. Conservation score is the smoothened amino acid (AA) substitution score of the respective residue in a pairwise sequence alignment (see Materials and methods). Bottom: Phylogenetic comparison of non-DNA-binding domain sequences, indicating distance from the last common ancestor (LCA) to the conserved paralog (purple line, DP1), and the distance difference between the paralogs, that is, evolutionary rate asymmetry (blue line, ∆DP1,P2, see Materials and methods for details). (C) As in (B) for the indicated paralog pairs with different levels of evolutionary rate asymmetry (see Figure 6—figure supplement 1 for all pairs). (D) Evolutionary rate asymmetry (∆DP1,P2), evolutionary rate of the conserved paralog (DP1), and correlation in promoter-binding signals (pbs) for all paralog pairs. Paralogs chosen for further experimental analysis are highlighted in bold (*: lacking K. lactis ortholog).
Figure 6—figure supplement 1.
Figure 6—figure supplement 1.. Asymmetric sequence evolution in whole-genome duplication (WGD) transcription factor (TF) paralog pairs.
(A)Schematic representation of the phylogeny of the genus Saccharomyces. Genomic sequences of indicated species were used in the phylogenetic analysis to assess sequence divergence rate. (B) Sequence similarity and evolutionary rate differs between paralog pairs. For each paralog pair, sequence of one non-WGD ortholog (K. lactis or Zygosaccharomyces rouxii as indicated) was compared against the non-WGD consensus (top left, number in parenthesis indicates protein length) and against the sequences of both S. cerevisiae paralogs (bottom, color indicates the amino acid conservation score of the respective residue). Rate of non-DNA-binding domain sequence divergence was derived from phylogenetic analysis of non- and post-WGD orthologs (right, reduced phylogeny is shown with dots indicating different orthologs; black: K. lactis, white: Z. rouxii, colored: paralogs of the Saccharomyces strictu lineage corresponding to similar colored S. cerevisiae proteins, compare Figure 6B).
Figure 7.
Figure 7.. Evolution of binding preferences between Kluyveromyces lactis and Saccharomyces cerevisiae transcription factor (TF) orthologs.
(A–C) Mapping and comparing non-whole-genome duplication K. lactis ortholog binding profiles within S. cerevisiae: Experimental scheme (left) and promoter-binding signal (pbs) for Ixr1/Abf2 K. lactis ortholog compared with S. cerevisiae Ixr1, in wild-type (x-axis) and ABF2-deletion background (color, right). (B) Pbs and correlations of binding preferences (bottom triangle: promoters, top triangle: 7-mers) between the K. lactis ortholog and S. cerevisiae paralogs in wild-type and paralog-deletion backgrounds, for the same example pairs shown in Figure 6 (r: Pearson’s correlation, red: percentage of new among strong targets). (C) For all paralog pairs with profiled orthologs, correlation between S. cerevisiae and K. lactis orthologs (y-axis) shown as a function of the correlation between S. cerevisiae paralogs (x-axis). Correlations were measured in paralog-deletion background, with paralogs’ correlation in wild-type background shown in shade. Also shown are the sequence evolutionary rate (spot size; large spots reflect paralog with slower evolutionary rate, Figure 6) and difference in pbs correlation of the S. cerevisiae paralogs with their K. lactis ortholog (divergence asymmetry, defined as |corr(P1,ortholog)-corr(P2,ortholog)|, gray vertical lines). Note the strong similarity of binding preferences between each K. lactis TF with at least one of the S. cerevisiae paralogs, commonly the one experiencing slower sequence evolution. The dashed line indicates the divergence cut-off used in (D). (D) Evolution through biased neo/sub-functionalization: Diverged paralog pairs (with corr(P1, P2)<0.8 as indicated by dashed line in (C)) are positioned according to the divergence asymmetry of their correlation with the K. lactis ortholog (x-axis, (C)). Color indicates the percentage of new, among strong targets acquired by the less conserved paralog, and spot size indicates divergence of promoter-binding preferences between the paralogs (Figure 7—figure supplement 1 for all tested paralog pairs).
Figure 7—figure supplement 1.
Figure 7—figure supplement 1.. Kluyveromyces lactis orthologs represent possible binding preferences of the pre-duplication ancestor and suggest biased neo/sub-functionalization as the dominant divergence principle.
(A) Reproducible and distinct binding profiles of Kluyveromyces lactis orthologs profiled in Saccharomyces cerevisiae. Distribution of pairwise promoter-binding signal (pbs) correlations between all samples (light blue) and biological repeats (purple) of the K. lactis transcription factor (TF) orthologs. (B) K. lactis orthologs reflect paralogs’ binding preferences: For each paralog pair, comparing pbs of K. lactis ortholog to each S. cerevisiae TF pbs in paralog-deletion background revealed the binding preference conservation (left, r: Pearson’s correlation, percentage of new among strong targets aquired by S. cerevisiae paralog is indicated in parenthesis and corresponds to the red-outlined dots, see Materials and methods). Correlations of binding preferences (bottom triangle: promoters, top triangle: 7-mers) between the K. lactis ortholog and S. cerevisiae paralogs in wild-type and paralog-deletion backgrounds, as in Figure 7B for all paralog pairs with an investigated K. lactis ortholog (right, each row/column corresponds to an individual repeat, with the total number of repeats for K. lactis samples indicated in parenthesis). (C) Divergence asymmetry is associated with new-target acquisition in most paralog pairs. For all pairs, the difference between the percentage of newly acquired targets is plotted against the divergence asymmetry. Note that the more diverged paralog (indicated) also acquired more new targets. (D) Evolution through biased neo/sub-functionalization: As Figure 7C for all paralog pairs with an investigated K. lactis ortholog.
Figure 8.
Figure 8.. Divergence of zinc cluster transcription factor (TF) paralogs correlates with changes in motif preferences.
(A) Dimerization and changes in motif preferences may explain divergence of zinc cluster paralogs: Zinc cluster paralogs vary in sequence and localized at different variants of their characteristic motif. Shown on the left with pairwise amino acid (AA) sequence conservation shown as color-code, DNA-binding domain (DBD) position indicated as cyan box, and disorder tendency (Mészáros et al., 2018) shown as black line; motif symbols indicated on the bottom (see Figure 8—figure supplement 1 for motif sequences). For each pair, top-bound promoters were selected, and peak-proximal motifs defined. Shown, as indicated, are promoter-binding signal (pbs, z-score, columns correspond to individual repeats), percentage of total promoter signal 50 bases around the indicated motifs (columns correspond to individual repeats), and binding change upon paralog deletion (log2, mean; *: indicates loss of binding specificity after paralog deletion). Suggested models explaining divergence, and the signal on exemplary promoters (indicated by small gray and black dots next to the pbs panel) are also shown. (B–E) Upc2/Ecm22 diverge through DNA-binding competition: shown in (B) are the disorder tendency (Mészáros et al., 2018) and pairwise sequence conservation of Upc2-Ecm22 along the respective protein length and that of their K. lactis ortholog with Upc2 (Figure 6—figure supplement 1). Promoter-binding preferences in the indicated backgrounds are shown in (C–D). (C) Large dots indicate top 50 K. lactis targets, color-coded by binding signal. Distribution of these targets across the Upc2/Ecm22 binding preferences are shown as histograms (red, gray: all promoters). Note that Upc2 and Ecm22 bind comparably to strong K. lactis targets, while Ecm22 dominates on low-intermediate targets. (D) Large dots indicate Upc2 and Ecm22 top 20 targets (in wild-type background), colors indicate the number of occurrences of the known in vitro motif (TA(T/A)ACGA) and arrows show change in binding relative to the wild-type. (E) Suggested model: Ecm22 and Upc2 bind a common motif, but Upc2 outcompetes Ecm22 on Upc2’s share of ancestral targets.
Figure 8—figure supplement 1.
Figure 8—figure supplement 1.. Homo- and heterodimerization’s role in the binding preferences and divergence of dimer-forming transcription factor (TF) paralog pairs.
(A) Heterodimer formation explains asymmetric dependency in the Skn7/Hms2 paralog pair of the HSF DNA-binding domain (DBD) family: Shown are the amino acid (AA) sequence conservation in color-code, DBD indicated as cyan box, and disorder tendency shown as black line. Peak-proximal motif symbols indicated on the bottom. Also shown is the binding behavior to the top-bound target promoters (binding signal of both TFs and their Kluyveromyces lactis ortholog, percentage of total promoter signal 50 bases around the indicated motifs and log2 change after paralog deletion; columns correspond to individual repeats), and binding signal on representative promoters (compare Figure 8A). *: indicates loss of binding specificity after paralog deletion. (B) Competition shapes the binding profile of the Ecm22/Upc2 paralog pair: as in (A) (Figure 8B–E). (C) Identified motifs in the top promoters of each paralog pair: Shown are the schematic and sequences for the proposed TF motifs found in the respective target promoters.
Figure 9.
Figure 9.. Resolution of paralog interference through competitive binding.
(A–D) Gis1 limits Rph1 binding through DNA-binding domain (DBD)-dependent competition: shown are promoter-binding preferences of Gis1 and Rph1 in wild-type backgrounds (A, as in Figure 8C) and following mutual paralog deletion and DBD-swapping (B, colored by the number of occurrences of the two known motif variants specified in D). The analysis of all top-bound promoters is summarized in (C) (columns correspond to individual repeats) and binding signals on exemplary promoters are shown in (D) (as described in Figure 8A). Note the increased binding of Rph1 to Gis1 target promoters (e.g. GSY2) upon GIS1 deletion or DBD-swapping (in wild-type background), and reduced Gis1 binding to its target promoter after DBD-swapping (e.g. HAP5). (E) Gis1’s loss of demethylase activity preceded variation in Rph1’s DBD: The conserved JmjC domain providing Rph1 a histone demethylase activity is mutated in Gis1 orthologs of all post-WGD species. The respective DBDs differ in only four positions, at one of which a conserved glutamine is replaced by lysine specifically in Rph1 and its closest orthologs (Figure 9—figure supplement 1). This suggests that the divergence was triggered by the loss of demethylase function and DBD-independent acquisition of new targets by Gis1, and a final mutation in Rph1-DBD to reduce residual Rph1-binding interference at the newly acquired Gis1 sites (blue box: JmjC domain, red box: DBD, dashed box: mutated domain). (F) Resolution of paralog interference among diverging transcription factor (TF) paralogs: A model for the resolution of paralog interference through competitive binding. The TF inhibiting its paralog’s binding is denoted as ‘competitive’, while the TF whose binding preferences better resemble those of the Kluyveromyces lactis ortholog is denoted as ‘ancestral’. In addition to Gis1/Rph1, other diverging paralogs whose K. lactis orthologs were profiled appear to conform to this general model (Figure 9—figure supplement 1). Note that in most cases (indicated), divergence in promoter binding is driven by variations outside the DBD, with competition only refining, but not driving this divergence of target preferences.
Figure 9—figure supplement 1.
Figure 9—figure supplement 1.. The role of competition and paralog interference in the divergence of transcription factor (TF) paralogs.
(A) Sequence conservation of JmjC domain and DNA-binding domain (DBD) in the Rph1/Gis1 paralog pair: Shown is the part of the multiple sequence alignment between all Rph1/Gis1 orthologs containing the discussed changes in the JmjC domain and the first C2H2 zinc finger (highlighted in bold colors). (B) The impact of competition and DBD specificity on the divergence of TF paralog pairs outside the zinc cluster family: Shown as in Figure 9A-C, are the comparisons between the promoter-binding preferences of both paralogs and the Kluyveromyces lactis ortholog (left, color indicates K. lactis binding signal) as well as the impact of paralog-deletion (middle) and DBD-swapping (right) and the quantification for the top targets, for each paralog pair discussed in Figure 9F (m1/2: paralog deletion mutants, S1/2: DBD-swapped variants, columns correspond to individual repeats).

References

    1. Anand R, Memisoglu G, Haber J. Cas9-mediated gene editing in Saccharomyces cerevisiae. Protocol Exchange. 2017;1:e21. doi: 10.1038/protex.2017.021a. - DOI
    1. Baker CR, Hanson-Smith V, Johnson AD. Following gene duplication, paralog interference constrains transcriptional circuit evolution. Science. 2013;342:104–108. doi: 10.1126/science.1240810. - DOI - PMC - PubMed
    1. Baker Brachmann C, Davies A, Cost GJ, Caputo E, Li J, Hieter P, Boeke JD. Designer deletion strains derived from Saccharomyces cerevisiae S288C: A useful set of strains and plasmids for PCR-mediated gene disruption and other applications. Yeast (Chichester, England) 1998;14:115–132. doi: 10.1002/(SICI)1097-0061(19980130)14:2<115::AID-YEA204>3.0.CO;2-2. - DOI - PubMed
    1. Berger MF, Badis G, Gehrke AR, Talukder S, Philippakis AA, Peña-Castillo L, Alleyne TM, Mnaimneh S, Botvinnik OB, Chan ET, Khalid F, Zhang W, Newburger D, Jaeger SA, Morris QD, Bulyk ML, Hughes TR. Variation in homeodomain DNA binding revealed by high-resolution analysis of sequence preferences. Cell. 2008;133:1266–1276. doi: 10.1016/j.cell.2008.05.024. - DOI - PMC - PubMed
    1. Birchler JA, Riddle NC, Auger DL, Veitia RA. Dosage balance in gene regulation: biological implications. Trends in Genetics. 2005;21:219–226. doi: 10.1016/j.tig.2005.02.010. - DOI - PubMed

Publication types