. 2022 Apr 11:11:e72805.
doi: 10.7554/eLife.72805.

A B-cell actomyosin arc network couples integrin co-stimulation to mechanical force-dependent immune synapse formation

Affiliations

A B-cell actomyosin arc network couples integrin co-stimulation to mechanical force-dependent immune synapse formation

Jia C Wang et al. Elife. .

Abstract

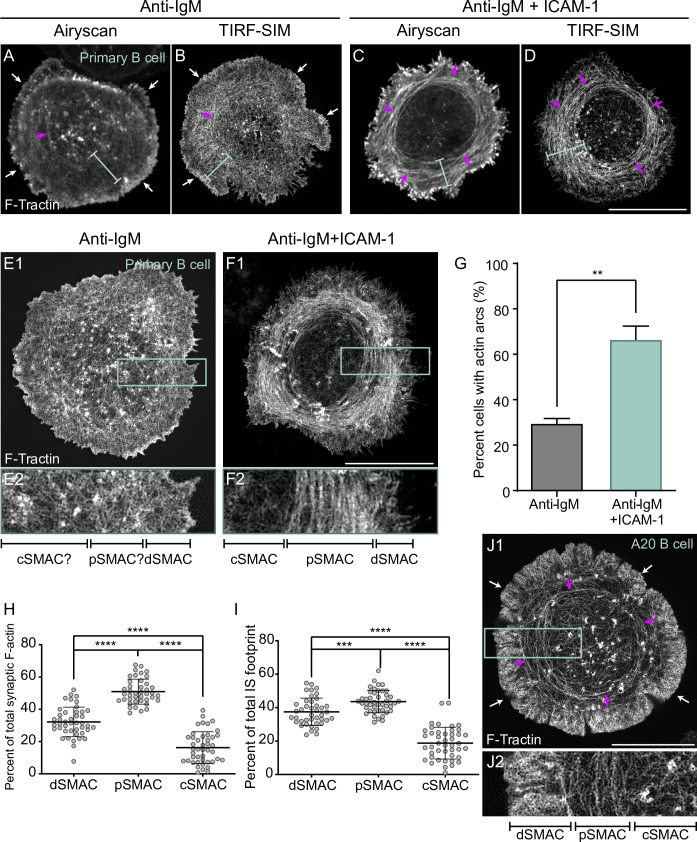
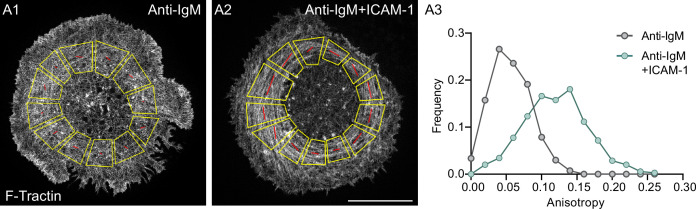
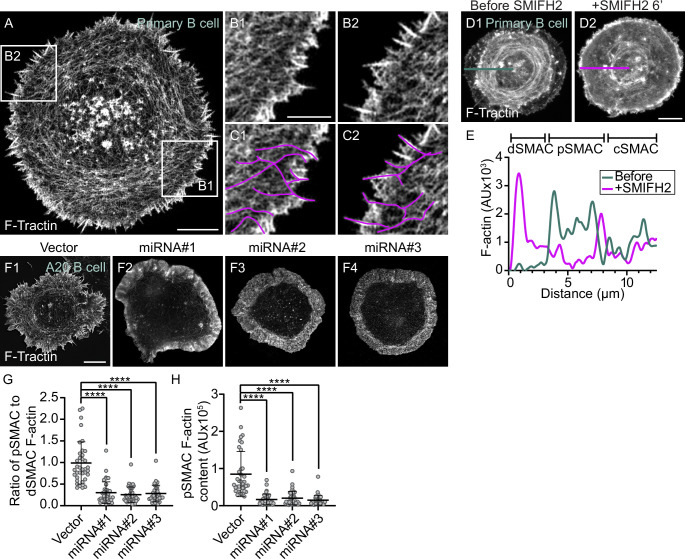
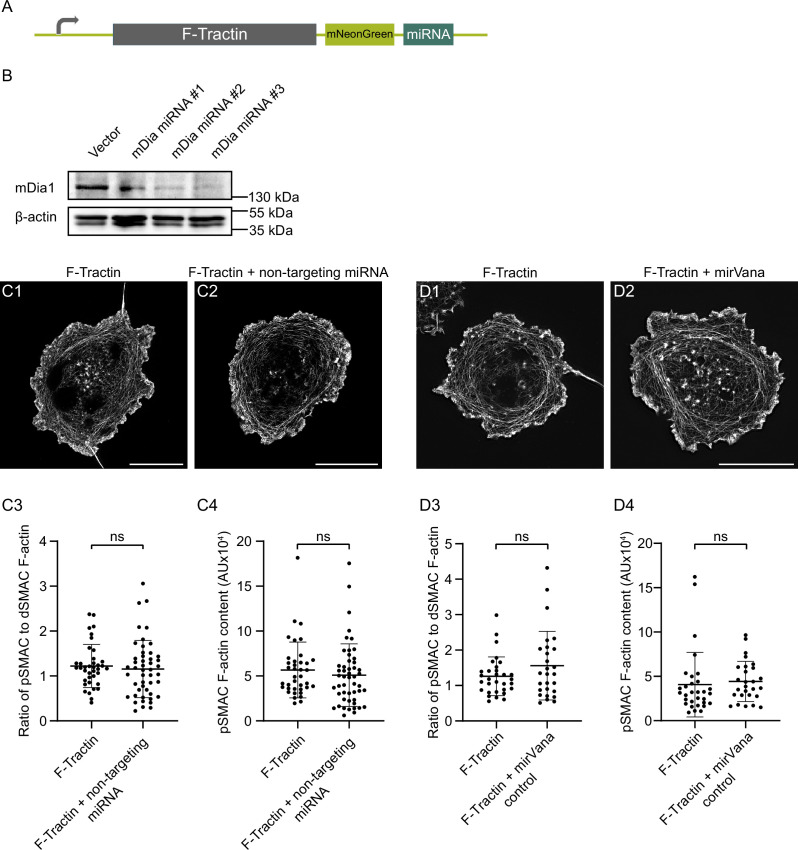
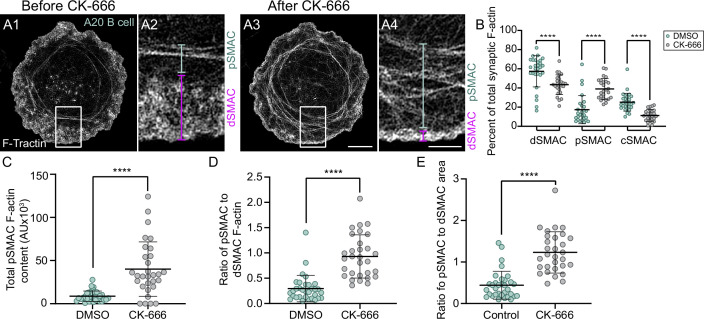
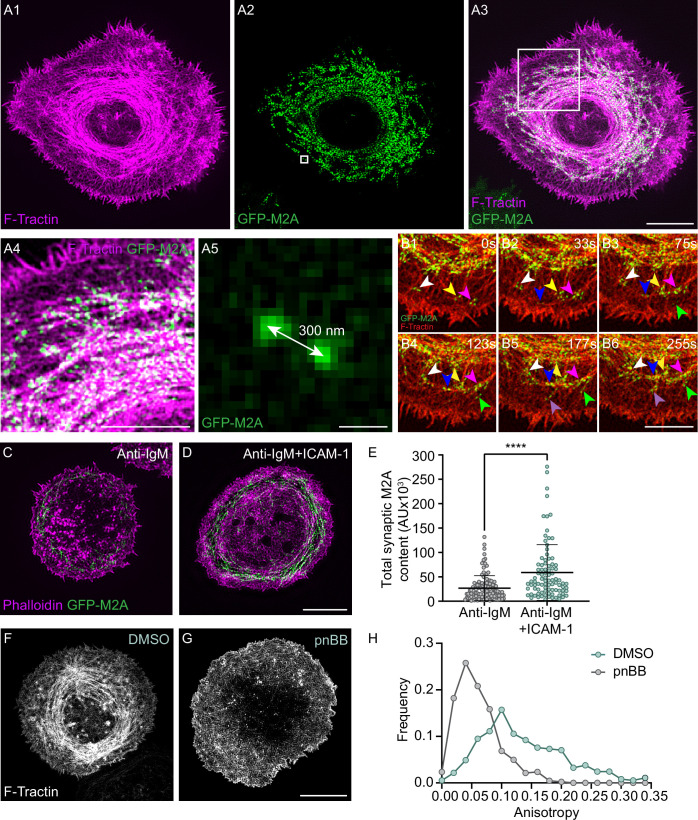
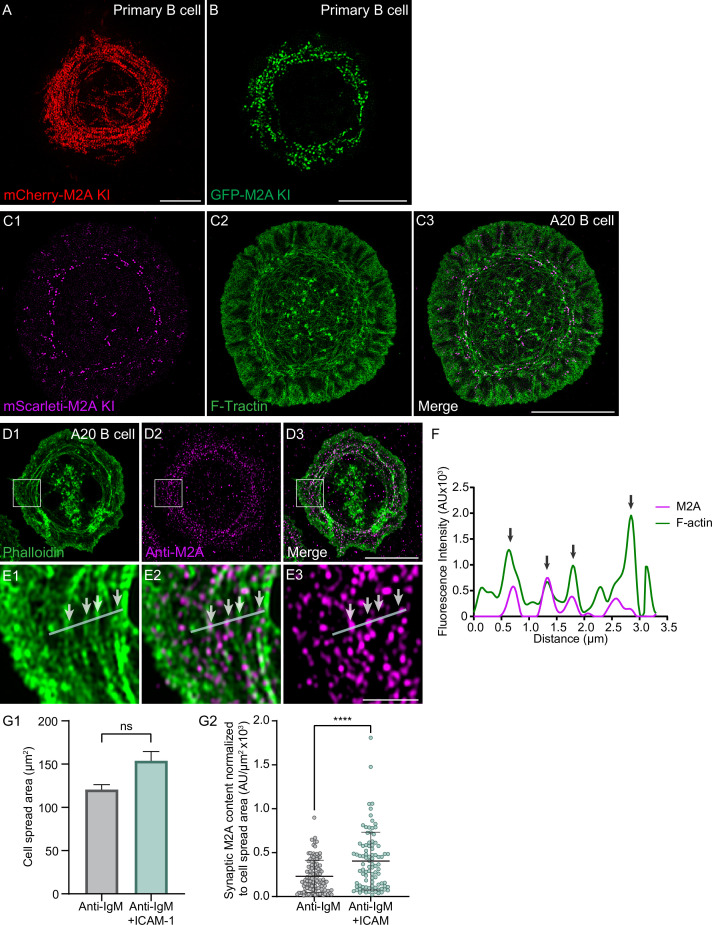
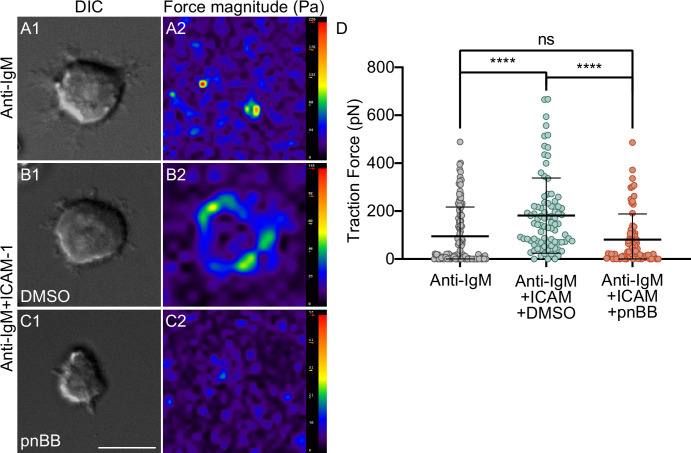
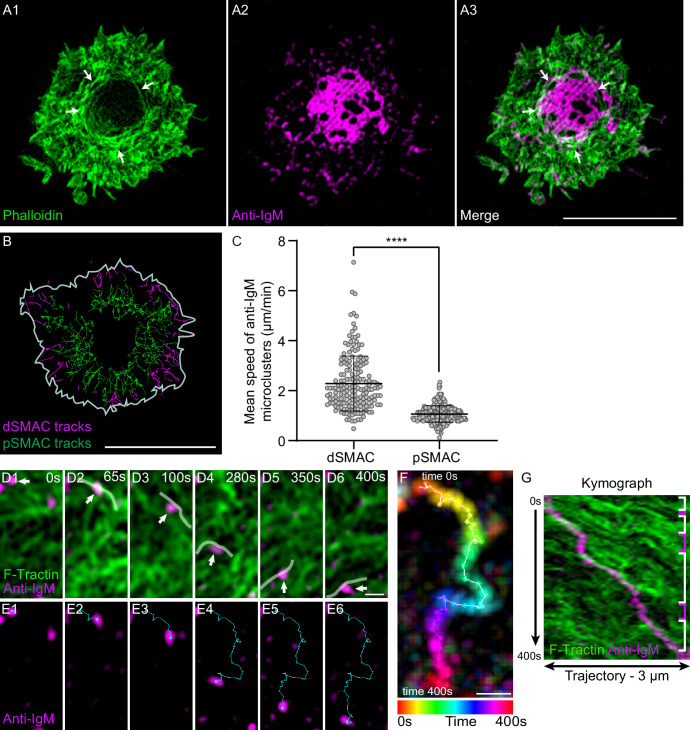
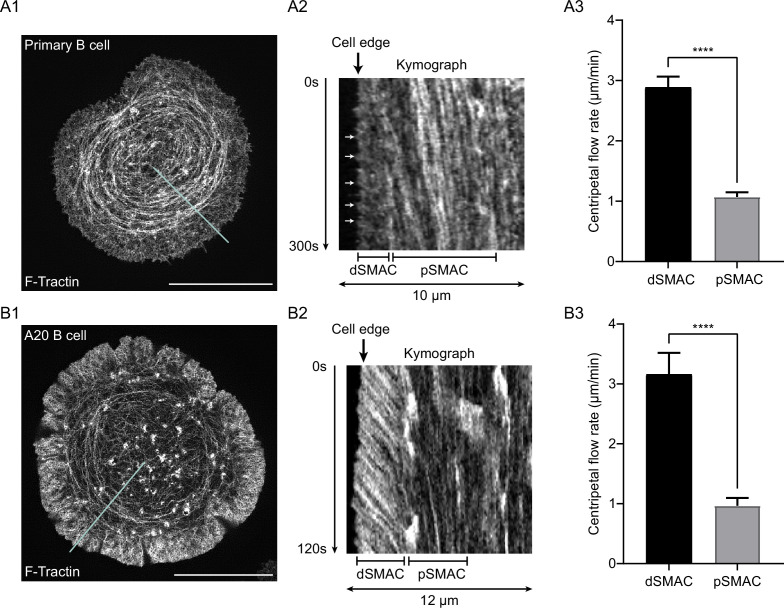
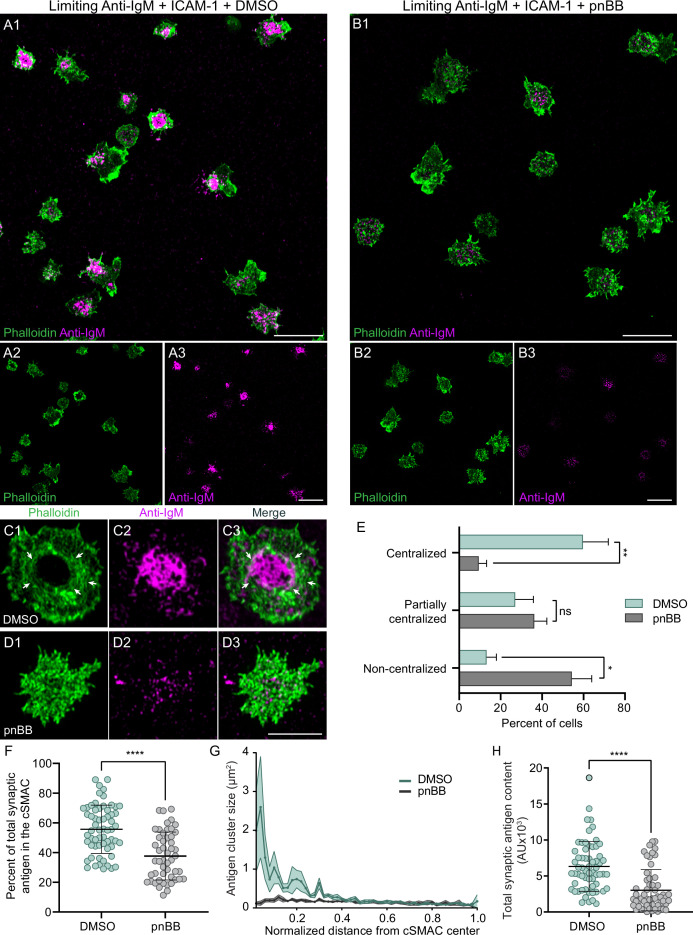
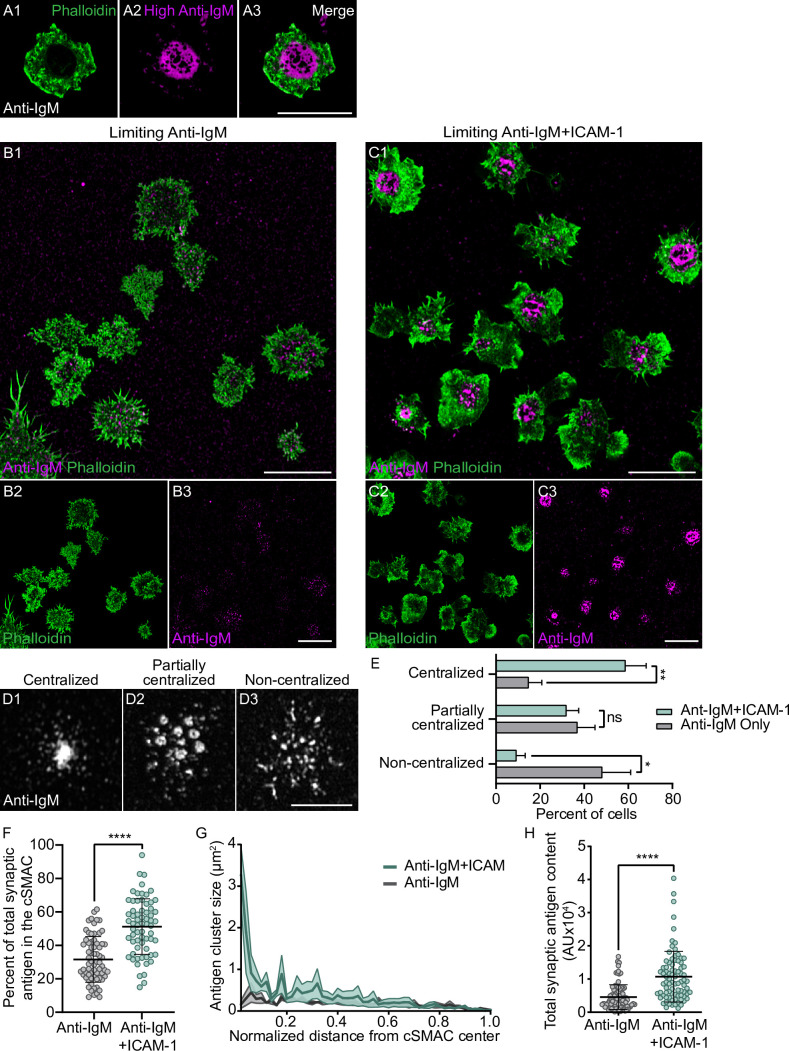
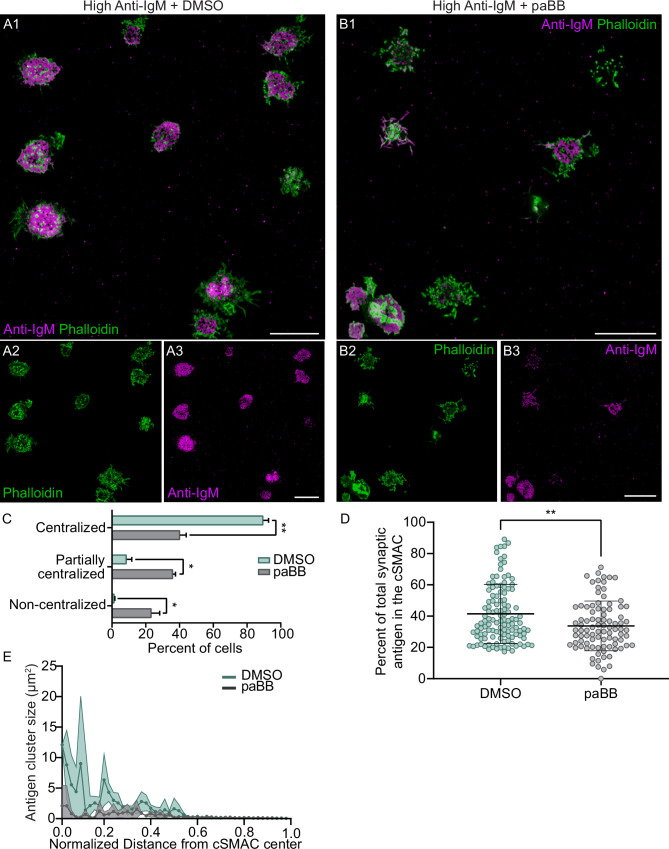
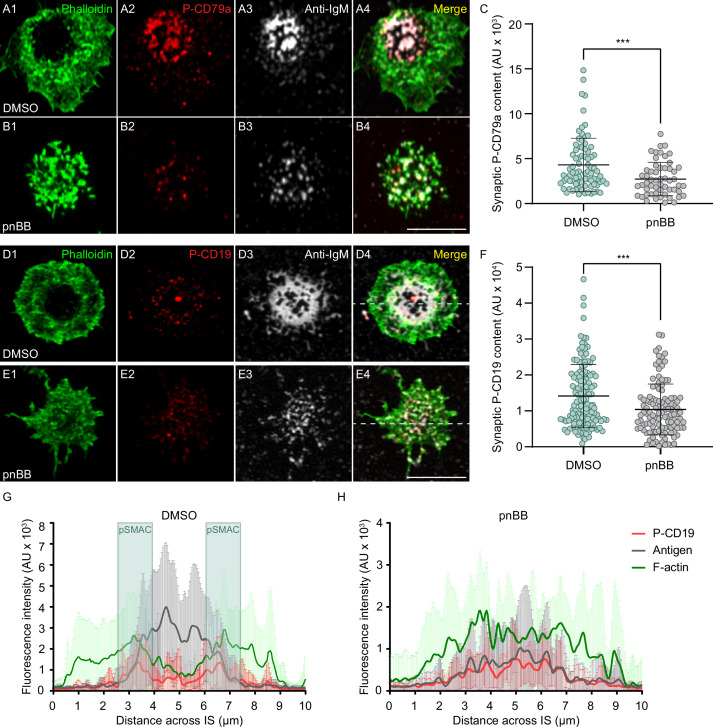
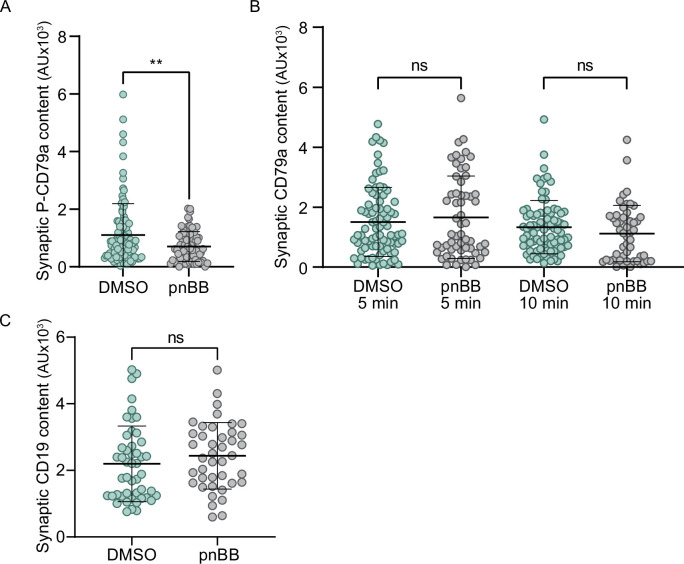
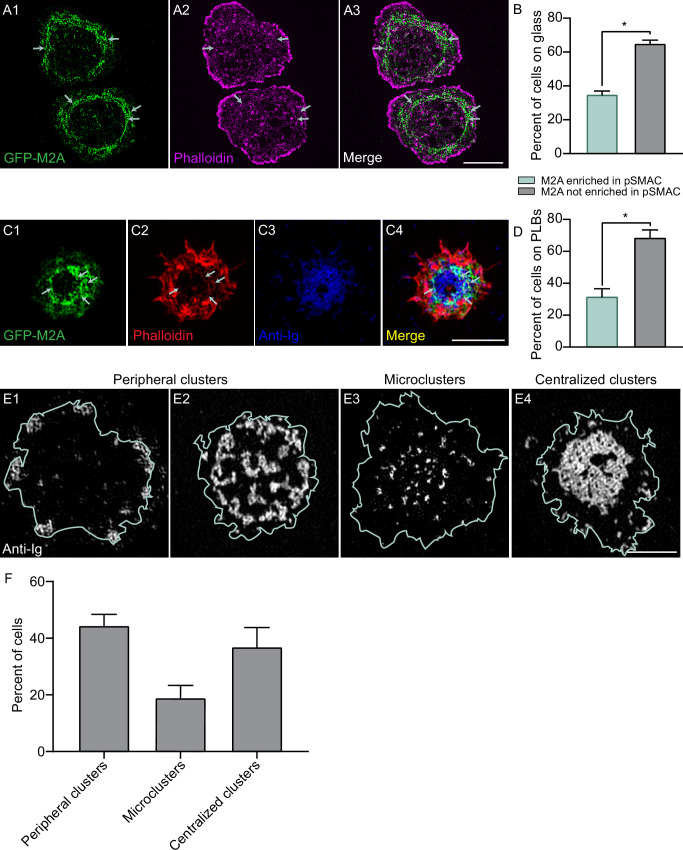
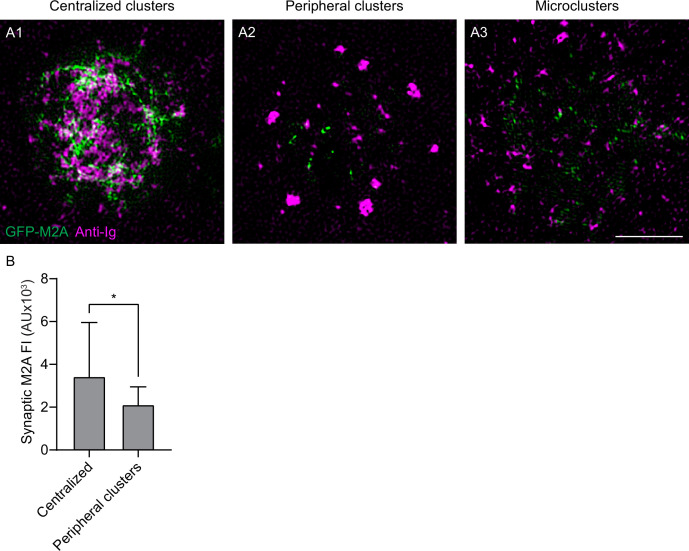
B-cell activation and immune synapse (IS) formation with membrane-bound antigens are actin-dependent processes that scale positively with the strength of antigen-induced signals. Importantly, ligating the B-cell integrin, LFA-1, with ICAM-1 promotes IS formation when antigen is limiting. Whether the actin cytoskeleton plays a specific role in integrin-dependent IS formation is unknown. Here, we show using super-resolution imaging of mouse primary B cells that LFA-1:ICAM-1 interactions promote the formation of an actomyosin network that dominates the B-cell IS. This network is created by the formin mDia1, organized into concentric, contractile arcs by myosin 2A, and flows inward at the same rate as B-cell receptor (BCR):antigen clusters. Consistently, individual BCR microclusters are swept inward by individual actomyosin arcs. Under conditions where integrin is required for synapse formation, inhibiting myosin impairs synapse formation, as evidenced by reduced antigen centralization, diminished BCR signaling, and defective signaling protein distribution at the synapse. Together, these results argue that a contractile actomyosin arc network plays a key role in the mechanism by which LFA-1 co-stimulation promotes B-cell activation and IS formation.

Keywords: B cell; actin; cell biology; immune synapse; immunology; inflammation; integrin; mouse; myosin.

Plain language summary

The immune system has the ability to recognize a vast array of infections and trigger rapid responses. This defense mechanism is mediated in part by B cells which make antibodies that can neutralize or destroy specific disease-causing agents. When pathogens (such as bacteria or viruses) invade the body, a specialized immune cell called an ‘antigen presenting cell’ holds it in place and presents it to the B cell to examine. Receptors on the surface of the B cell then bind to the infectious agent and launch the B cell into action, triggering the antibody response needed to remove the pathogen. This process relies on B cells and antigen presenting cells making a close connection called an immune synapse, which has a bulls-eye pattern with the receptor in the middle surrounded by sticky proteins called adhesion molecules. A network of actin filaments coating the inside of the B cell are responsible for arranging the proteins into this bulls-eye shape. Once fully formed, the synapse initiates the production of antibodies and helps B cells to make stronger versions of these defensive proteins. So far, most studies have focused on the role the receptor plays in B cell activation. However, when there are only small amounts of the pathogen available, these receptors bind to the antigen presenting cell very weakly. When this happens, adhesion molecules have been shown to step in and promote the formation of the mature synapse needed for B cell activation. But it is not fully understood how adhesion molecules do this. To investigate, Wang et al. looked at mouse B cells using super resolution microscopes. This revealed that when B cells receive signals through both their receptors and their adhesion molecules, they rearrange their actin into a circular structure composed of arc shapes. Motors on the actin arcs then contract the structure inwards, pushing the B cell receptors into the classic bullseye pattern. This only happened when adhesion molecules were present and signals through the B cell receptors were weak. These findings suggest that adhesion molecules help form immune synapses and activate B cells by modifying the actin network so it can drive the re-patterning of receptor proteins. B cells are responsible for the long-term immunity provided by vaccines. Thus, it is possible that the findings of Wang et al. could be harnessed to create vaccines that trigger a stronger antibody response.


Conflict of interest statement

JW, YY, XW, VJ, AC, CW, JK, JH No competing interests declared

Figures

Figure 1.
Figure 1.. ICAM-1 co-stimulation promotes the formation of actin arcs at the B-cell immune synapse.
(A–F) GFP-F-Tractin-expressing primary B cells on glass coated with anti-IgM alone (A, B, E1, E2) or with anti-IgM + ICAM-1 (C, D, F1, F2) and imaged using Airyscan (A, C) or TIRF-SIM (B, D, E1, E2, F1, F2). The white arrows in (A) and (B) indicate the thin outer rim of dendritic actin in the dSMAC. The blue bars in (A–D) indicate the pSMAC. (E2) and (F2) correspond to the boxed regions in (E1) and (F1), respectively. Of note, the cell shown in (E1/E2) is representative of ~70% of anti-IgM-stimulated cells, while the cell shown in (F1/F2) is representative of ~70% of anti-IgM + ICAM-1-stimulated cells. (G) Percent of cells with pSMAC actin arcs (N > 67 cells/condition from three experiments). (H, I) Percent of total synaptic F-actin (H) and percent of total IS footprint (I) contained within the dSMAC, pSMAC, and cSMAC portions of the synapse for primary B cells on anti-IgG/ICAM-1-coated glass (N = 44 cells/condition from six experiments). (J1, J2) GFP-F-Tractin-expressing A20 B cell on anti-IgG/ICAM-1-coated glass. (J2) corresponds to the boxed region in (J1). The magenta arrows in (A–D) and (J1) indicate actin arcs. Scale bars: 10 µm.
Figure 1—figure supplement 1.
Figure 1—figure supplement 1.. Degree of alignment between the actin filaments in the pSMAC of B cells stimulated with anti-IgM alone versus anti-IgM and ICAM-1.
(A1, A2) Shown are examples of how FibrilTool (Boudaoud et al., 2014) was used to measure pSMAC actin arc anisotropy by dividing the radially symmetric pSMAC into 10–12 trapezoid-shaped regions of interest (ROIs) of similar size so as to ‘linearize’ it (A1, stimulated with anti-IgM alone; A2, stimulated with anti-IgM and ICAM-1) (see also Murugesan et al., 2016). FibrilTool measures how well structures of interest (here actin filaments) within a given ROI (here the pSMAC) are arranged in parallel. Anisotropy values range from 0 when the orientation of the structures is completely random to 1.0 when all of the structures are perfectly aligned/parallel to each other. The red lines indicate the average orientation of actin in the ROI. Scale bar: 10 µm. All panels: TIRF-SIM. (A3) Frequency of measured anisotropy values. N = 267–358 ROIs from 22 to 23 cells from three experiments.
Figure 2.
Figure 2.. The actin arcs are created by the formin mDia1 acting at the outer edge of the immune synapse.
(A) GFP-F-Tractin-expressing primary B cell on anti-IgG/ICAM-1-coated glass. (B1, B2) Boxed regions in (A). (C1, C2) B1 and B2 with magenta lines applied to highlight linear actin filaments/bundles arising from surface spikes at the IS edge that are contiguous with actin arcs in the pSMAC. (D1, D2) GFP-F-Tractin-expressing primary B cell on anti-IgG/ICAM-1-coated glass before (D1) and 6 min after SMIFH2 addition (D2). (E) F-actin intensity profiles corresponding to the line scans in (D1) (blue, before SMIFH2 addition) and (D2) (magenta, after SMIFH2 addition). (F1–F4) F-Tractin mNeonGreen-expressing A20 B cells transfected with vector only or the indicated mDia1 miRNA constructs and activated on anti-IgG/ICAM-1-coated glass. (G) Ratio of pSMAC to dSMAC F-actin (N > 20 cells/condition from two experiments). (H) pSMAC F-actin content (N = 20–26 cells/condition from two experiments). (A–C, F) TIRF-SIM images; (D) Airyscan images. Scale bars: 5 µm in (A, D2, F1); 2 µm in (B1).
Figure 2—figure supplement 1.
Figure 2—figure supplement 1.. miRNA-mediated knockdown (KD) of mouse mDia1 in A20 B cells.
(A) Diagram of the plasmid in which mDia1 miRNA sequences are C-terminal to F-Tractin mNeonGreen. The target sequences used to generate the three mDia1 miRNA KD plasmids are indicated in Appendix 1. Positive transfectants were identified based on the expression of F-Tractin-mNeonGreen and used in subsequent quantitative analyses. (B) Immunoblot of the entire population of A20 B cells that had undergone AMAXA nucleofection with either the F-Tractin-mNeonGreen vector control or with the indicated mDia1 miRNA plasmids. Of note, while the lysates used for immunoblotting were made from samples containing both positive and negative transfectants, only positive transfectants (i.e., mNeonGreen-positive cells) were used for the quantitation presented in Figure 2. (C1, C2) Representative F-actin images show F-Tractin mNeonGreen-expressing A20 B cells transfected with vector only (C1) or with a non-targeting miRNA (C2) and activated on anti-IgG/ICAM-1-coated glass. (C3) Ratio of pSMAC to dSMAC F-actin (N > 38 cells/condition from two experiments). (C4) pSMAC F-actin content (N > 38 cells/condition from two experiments). (D1, D2) Representative F-actin images show F-Tractin-expressing A20 B cells transfected with vector only (D1) or with a non-targeting mirVana-negative control (D2) and activated on anti-IgG/ICAM-1-coated glass. (D3) Ratio of pSMAC to dSMAC F-actin (N > 27 cells/condition from two experiments). (D4) pSMAC F-actin content (N > 27 cells/condition from two experiments). Scale bars: 10 µm in (C1, C2, D2).
Figure 2—figure supplement 2.
Figure 2—figure supplement 2.. Arp2/3 inhibition shifts the balance between the dSMAC branched actin network and the pSMAC actin arc network.
(A1–A4) TIRF-SIM images of GFP-F-Tractin-expressing A20 cells on anti-IgG/ICAM-1-coated glass before (A1, A2) and 5 min after CK-666 addition (A3, A4). (A2) and (A4) correspond to the boxed regions in (A1) and (A3), respectively. The magenta and blue bars in (A2) and (A4) correspond to the dSMAC and pSMAC portions of the synapse, respectively. (B–E) Percent of total synaptic F-actin within each SMAC (B), total pSMAC F-actin content (C), ratio of pSMAC to dSMAC F-actin (D), and ratio of pSMAC to dSMAC area (E) for DMSO-treated and CK-666-treated A20 B cells (N > 30 cells/condition from three experiments). Scale bar: 2 µm in (A4).
Figure 3.
Figure 3.. Myosin 2A decorates the actin arcs and is required for their concentric organization.
(A1–A5) Td-Tomato-F-Tractin-expressing primary B cell from the M2A-GFP knockin mouse on anti-IgM/ICAM-1-coated glass. (A4) and (A5) correspond to the boxed regions in (A1) and (A2), respectively. (B1–B6) Still images at the indicated time points taken from a region within Video 7 of a Td-Tomato-F-Tractin-expressing primary B cell from the M2A-GFP knockin mouse. Different color arrowheads mark the formation and centripetal movement of individual M2A bipolar filaments (see text for details). (C, D) Phalloidin-stained primary B cell from the M2A-GFP knockin mouse on glass coated with anti-IgM alone (C) or with anti-IgM + ICAM-1 (D). (E) Total synaptic M2A content (N = 91–115 cells/condition from three experiments). (F, G) GFP-F-Tractin-expressing primary B cells that had been pretreated with DMSO (F) or pnBB (G) for 30 min and activated on anti-IgM/ICAM-1-coated glass. (H) Anisotropy of the actin filaments/bundles present within the pSMAC (N = 369–423 regions of interest [ROIs] from 30 to 37 cells from three experiments). All panels: TIRF-SIM images. Scale bars: 5 µm in (A3, D, G); 3 µm in (A4, B6); 250 nm in (A5).
Figure 3—figure supplement 1.
Figure 3—figure supplement 1.. Endogenous M2A decorates the actin arcs in both primary B cells and A20 B cells.
(A) Primary B cell isolated from an mCherry-M2A KI mouse. (B) Primary B cell in which GFP was knocked in at the N-terminus of the M2A heavy chain using ex vivo CRISPR. (C1–C3) GFP-F-Tractin-expressing A20 B cell in which mScarleti was knocked in at the N-terminus of M2A heavy chain using CRISPR. (D1–D3) A20 B cell that was stained with phalloidin and an antibody to the C-terminus of myosin 2A. (E1–E3) Enlargements of the boxed regions in (D1–D3). The position of the line scan used to generate the intensity profile in (F) is shown in white. The white arrows mark the positions in the image that are marked by the black arrows in (F). (F) Fluorescence intensity profile for endogenous M2A and F-actin across the line scan shown in (E1–E3). The black arrows point to regions of marked overlap between the signals for endogenous M2A and actin arcs. (G1, G2) Shown is the cell spread area (G1) and the synaptic content of M2A normalized for cell spread area (G2) for primary B cells isolated from the GFP-M2A KI mouse (N = 91–115 cells/condition from three experiments). (A, B, C1–C3, H) TIRF-SIM images. (D1–D3) Airyscan images. All of the cells shown or quantified in (A–H) were activated on glass coated with anti-IgM and ICAM-1. Scale bars: 5 µm in (A, B, C3); 10 µm in (D3, H); 2 µm in (E3).
Figure 3—figure supplement 2.
Figure 3—figure supplement 2.. Integrin-dependent traction forces exerted by primary B cells require M2A contractility.
(A1, A2) Representative primary B cell engaged with a PAA gel coated with anti-IgM (A1) and its force magnitude plot (A2). (B1, B2) Representative, DMSO-treated primary B cell engaged with a PAA gel coated with anti-IgM and ICAM-1 (B1) and its force magnitude plot (B2). (C1, C2) Representative, pnBB-treated primary B cell engaged with a PAA gel coated with anti-IgM and ICAM-1 (C1) and its force magnitude plot (C2). (D) Traction forces exerted by B cells under these three conditions (N = 72–121 cells/per condition from three experiments). Scale bar: 10 µm.
Figure 4.
Figure 4.. Actin arcs sweep antigen clusters centripetally.
(A1–A3) Phalloidin-stained (green) primary B cell 15 min after engagement with a PLB containing unlabeled ICAM-1 and limiting anti-IgM (magenta). The white arrows in (A1) and (A3) mark the actin arcs. (B) Tracks of single anti-IgM microclusters traveling centripetally across the dSMAC (magenta tracks) and pSMAC (green tracks) acquired from Video 9. The white line indicates the outer edge of this cell. (C) Mean speed of single anti-IgM microclusters moving centripetally across the dSMAC and pSMAC (N = 180–273 tracks from three well-spread cells). (D1–D6) Still images at the indicated time points from Video 10 showing the centripetal movement of actin arcs and a representative anti-IgM microcluster (white arrows) (the center of the synapse is directly below the images). Transparent white lines highlight the actin arcs that moved the microcluster centripetally. (E1–E6) Same as (D1–D6) except showing only the anti-IgM microcluster and indicating its centripetal path in blue. (F) Temporally pseudo-colored, projected image of the anti-IgM microcluster in (D) and (E). (G) Kymograph of the 3-µm-long paths taken by the microcluster and the actin arcs in (D) and (E) over a period of 400 s. The white brackets on the right indicate where actin arcs overlapped with and moved the microcluster, while the magenta brackets indicate where the movement of the microcluster stalled. (A) Airyscan images; (D–G) TIRF-SIM images. Scale bars: 5 µm in (A3, B); 300 nm in (D6, F).
Figure 4—figure supplement 1.
Figure 4—figure supplement 1.. Centripetal actin flow rates across the dSMAC and pSMAC portions of synapses made by primary B cells and A20 B cells.
(A1–A3) Shown is a representative, GFP-F-Tractin-expressing primary B cell (A1), a kymograph showing the centripetal flow of F-actin in the dSMAC and pSMAC portions of this cell’s synapse over 300 s (A2; reconstructed from the blue line in A1; the white arrowheads mark several of the faint diagonals within the dSMAC used to calculate its flow rate), and the average rates of centripetal F-actin actin flow in the dSMAC and pSMAC (A3; approximately seven measurements per cell for each SMAC from 21 cells over three experiments, presented as standard error of the means). (B1–B3) Same as (A1–A3) except using A20 B cells (N = 14 cells from three experiments). In every case, the cells were activated using glass coated with anti-Igs and ICAM-1. All panels:TIRF-SIM. Scale bars: 10 µm.
Figure 5.
Figure 5.. Integrin ligation-dependent immune synapse (IS) formation requires myosin 2A contractility.
(A1–A3) DMSO-treated, phalloidin-stained primary B cells 15 min after engagement with a PLB containing ICAM-1 and limiting anti-IgM. (B1–B3) Same as (A1–A3) except the B cells were treated with pnBB. (C1–C3) Images of a representative, DMSO-treated primary B cell (white arrows mark actin arcs). (D1–D3) Images of a representative, pnBB-treated primary B cell. (E) Percent of cells exhibiting centralized, partially centralized, and noncentralized antigen (see Figure 5—figure supplement 1D1–D3 for representative examples of these three types of antigen distribution) (N = 126–144 cells/condition from three experiments). (F) Percent of total synaptic antigen in the cSMAC (N = 81–86 cells/condition from three experiments). (G) Antigen cluster size as a function of normalized distance from the cSMAC center (N = 113–144 cells/condition from three experiments). (H) Total synaptic antigen content (N = 56–62 cells/condition from three experiments). All panels: Airyscan images. Scale bars: 10 µm in (A1, B1, A3, B3); 5 µm in (D3).
Figure 5—figure supplement 1.
Figure 5—figure supplement 1.. ICAM-1 co-stimulation promotes antigen centralization and immune synapse (IS) formation when antigen is limiting.
(A1–A3) Representative, phalloidin-stained primary B cell 15 min after engagement with a PLB containing fluorescent anti-IgM at high density. (B1–B3) Phalloidin-stained primary B cells 15 min after engagement with a PLB containing a limiting amount of anti-IgM. (C1–C3) Same as (B1–B3) except the PLB also contained ICAM-1. (D1–D3) Representative images of centralized, partially centralized, and noncentralized antigen. (E) Percent of cells exhibiting the three types of antigen distribution shown in (D1–D3) (N = 151 cells/condition from four experiments). (F) Percent of total synaptic antigen in the cSMAC (N = 66–68 cells/condition from three experiments). (G) Antigen cluster size as a function of normalized distance from the cSMAC center (N = 62–69 cells/condition from three experiments). (H) Total synaptic antigen content (N = 83–87 cells/condition from three experiments). All panels: Airyscan images. Scale bars: 10 µm.
Figure 5—figure supplement 2.
Figure 5—figure supplement 2.. M2A contractility potentiates antigen centralization even when antigen density is high.
(A1–A3) Phalloidin-stained, DMSO-treated primary B cells 15 min after engagement with a PLB containing high-density anti-IgM. (B1–B3) Same as (A1–A3) except the cells were treated with paBB. (C) Percent of cells exhibiting centralized, partially centralized, and noncentralized antigen (N = 137–198 cells/condition from three experiments). (D) Percent of total synaptic antigen in the cSMAC (N = 91–121 cells/condition from three experiments). (E) Antigen cluster size as a function of normalized distance from the cSMAC center (N = 86–130 cells/condition from three experiments). All panels: Airyscan images. Scale bars: 10 µm.
Figure 6.
Figure 6.. Myosin 2A contractility promotes B-cell receptor (BCR) signaling.
(A1–A4) DMSO-treated primary B cell 10 min after engagement with a PLB containing ICAM-1 and limiting anti-IgM, and stained for F-actin and P-CD79a. (B1–B4) Same as (A1–A4) except the B cell was treated with pnBB. (C) Synaptic P-CD79a content (N = 55–81 cells/condition from three experiments). (D1–D4) DMSO-treated primary B cell 10 min after engagement with a PLB containing ICAM-1 and limiting anti-IgM, and stained for F-actin and P-CD19. (E1–E4) Same as (D1–D4) except the cell was treated with pnBB. (F) Synaptic P-CD19 content (N = 115–140 cells/condition from three experiments). (G) Fluorescence intensities across synapses for P-CD19 (red), antigen (gray), and F-actin (green) in B cells treated with DMSO (N = 22 cells from two experiments). The position of the pSMAC is highlighted in blue. (H) Same as (G) except the cells were treated with pnBB (N = 16 cells from two experiments). All panels: Airyscan images. Scale bars: 5 µm in (B4); 3 µm in (E4).
Figure 6—figure supplement 1.
Figure 6—figure supplement 1.. Myosin 2A contractility promotes B-cell receptor (BCR) signaling.
(A) Synaptic content of P-CD79a in DMSO-treated or pnBB-treated primary B cells 5 min after engaging PLBs containing ICAM-1 and a limiting amount of anti-IgM. (B) Same as (A) except showing the synaptic content of CD79a at 5 and 10 min. (C) Same as (A) except showing the synaptic content of CD19 at 10 min. N = 41–53 cells/condition from three experiments.
Figure 7.
Figure 7.. Germinal center B cells make actomyosin arcs.
(A1–A3) Phalloidin-stained primary GC B cell from the M2A-GFP knockin mouse on anti-IgM/anti-IgG/ICAM-1-coated glass. White arrows mark the actomyosin arcs. (B) Percent of cells on glass that did or did not show M2A enrichment in the pSMAC (N = 140 cells from four experiments). (C) Phalloidin-stained primary GC B cell from the M2A-GFP knockin mouse 15 min after engagement with a PLB containing anti-IgM, anti-IgG, and ICAM-1. (D) Percent of cells on PLBs that did or did not show M2A enrichment in the pSMAC (N = 89 cells from four experiments). (E1–E4) Representative images of the three types of anti-Ig distribution exhibited by GC B cells 15 min after engagement with a PLB containing anti-IgG and ICAM-1 (cell outlines are shown in blue). (F) Percent of GC cells displaying the three types of anti-Ig distribution shown in (E1–E4) (N = 157 cells from six experiments). All panels: TIRF-SIM images. Scale bars: 5 µm in (A3); 3 µm in (C4, E4).
Figure 7—figure supplement 1.
Figure 7—figure supplement 1.. Distribution of GFP-M2A in synapses formed by PLB-engaged germinal center B cells.
(A1–A3) Shown are images of the distribution of GFP-M2A (green) and anti-Igs (magenta) in GC B cell synapses exhibiting centralized antigen clusters (A1), peripheral antigen clusters (A2), or microclusters (A3). The distribution of GFP-M2A shown in (A1) is representative of 16 out of 21 cells with centralized antigen. The distribution of GFP-M2A shown in (A2) is representative of 20 out of 22 cells with peripheral antigen clusters. The distribution of GFP-M2A shown in (A3) is representative of 12 out of 13 cells with microclusters. See also Videos 12 and 13. All panels: TIRF-SIM images. Scale bars: 5 µm. (B) The synaptic content of M2A-GFP in GC B cells engaged with PLBs for 10 min that exhibited centralized antigen or peripheral antigen clusters (N > 20 cells).

Similar articles

Cited by

References

    1. Alexander CJ, Hammer JA. Optimization of cerebellar purkinje neuron cultures and development of a plasmid-based method for purkinje neuron-specific, miRNA-mediated protein knockdown. Methods in Cell Biology. 2016;131:177–197. doi: 10.1016/bs.mcb.2015.06.004. - DOI - PMC - PubMed
    1. Babich A, Burkhardt JK. Lymphocyte signaling converges on microtubules. Immunity. 2011;34:825–827. doi: 10.1016/j.immuni.2011.06.004. - DOI - PubMed
    1. Basu R, Whitlock BM, Husson J, Le Floc’h A, Jin W, Oyler-Yaniv A, Dotiwala F, Giannone G, Hivroz C, Biais N, Lieberman J, Kam LC, Huse M. Cytotoxic T Cells Use Mechanical Force to Potentiate Target Cell Killing. Cell. 2016;165:100–110. doi: 10.1016/j.cell.2016.01.021. - DOI - PMC - PubMed
    1. Batista FD, Iber D, Neuberger MS. B cells acquire antigen from target cells after synapse formation. Nature. 2001;411:489–494. doi: 10.1038/35078099. - DOI - PubMed
    1. Batista FD, Treanor B, Harwood NE. Visualizing a role for the actin cytoskeleton in the regulation of B-cell activation. Immunological Reviews. 2010;237:191–204. doi: 10.1111/j.1600-065X.2010.00943.x. - DOI - PubMed

Publication types

MeSH terms