. 2022 May 2;221(5):e202108018.
doi: 10.1083/jcb.202108018. Epub 2022 Apr 9.

CPAP insufficiency leads to incomplete centrioles that duplicate but fragment

Affiliations

CPAP insufficiency leads to incomplete centrioles that duplicate but fragment

Alejandra Vásquez-Limeta et al. J Cell Biol. .

Abstract

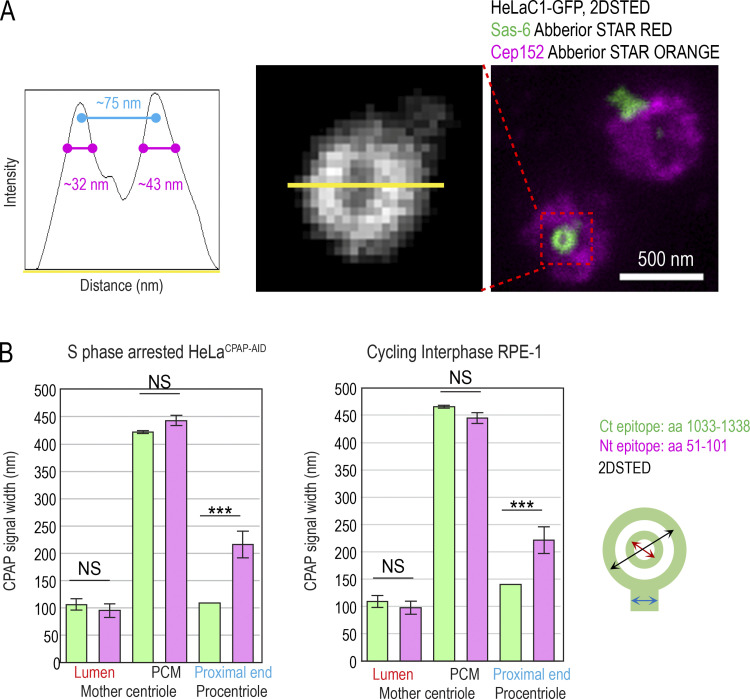
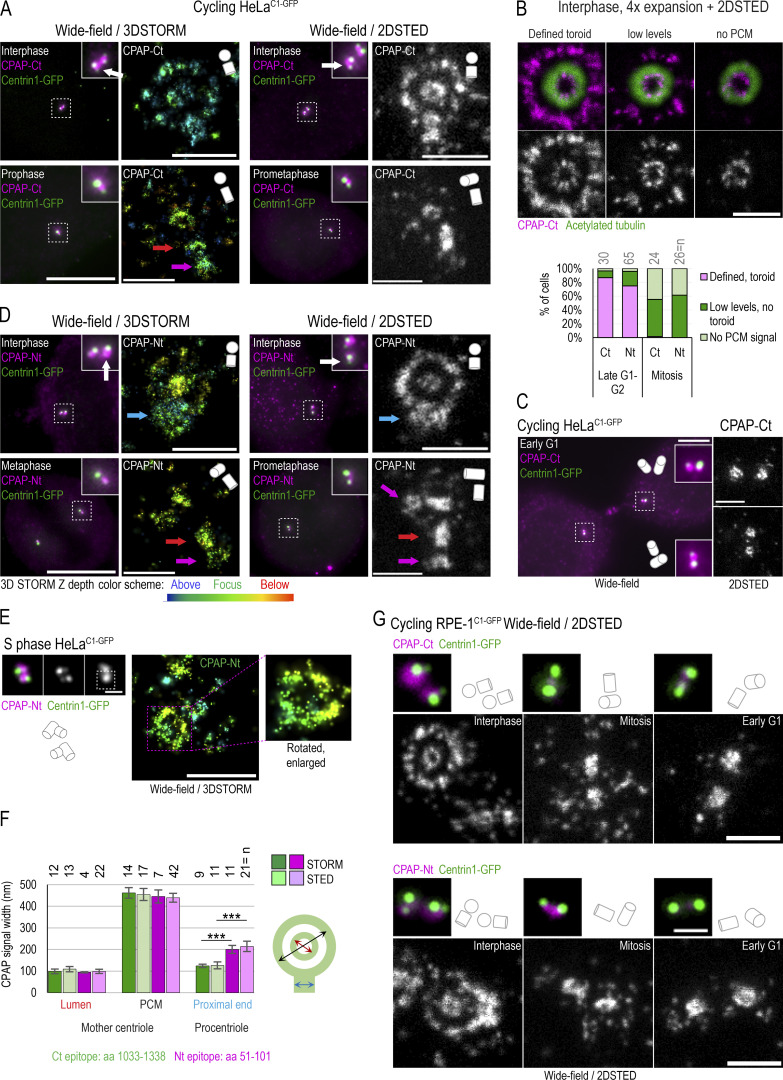
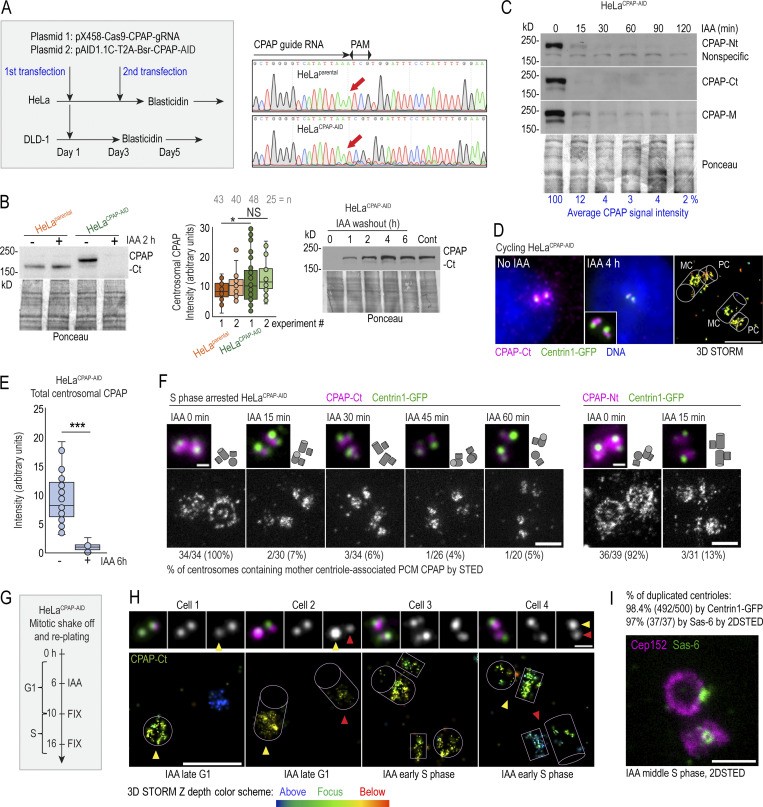
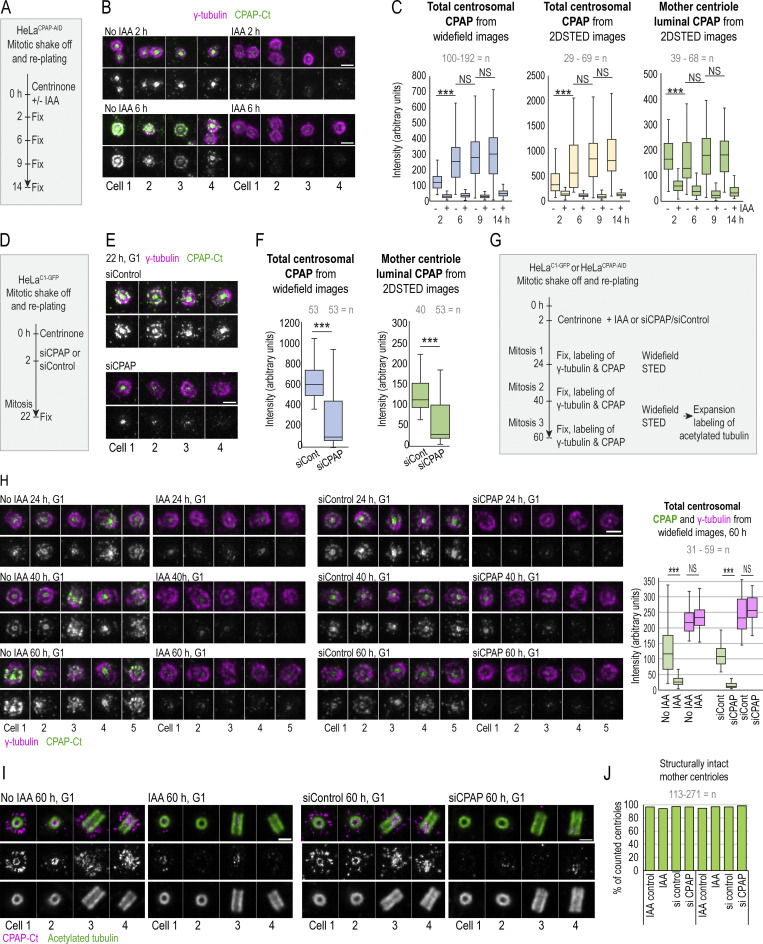
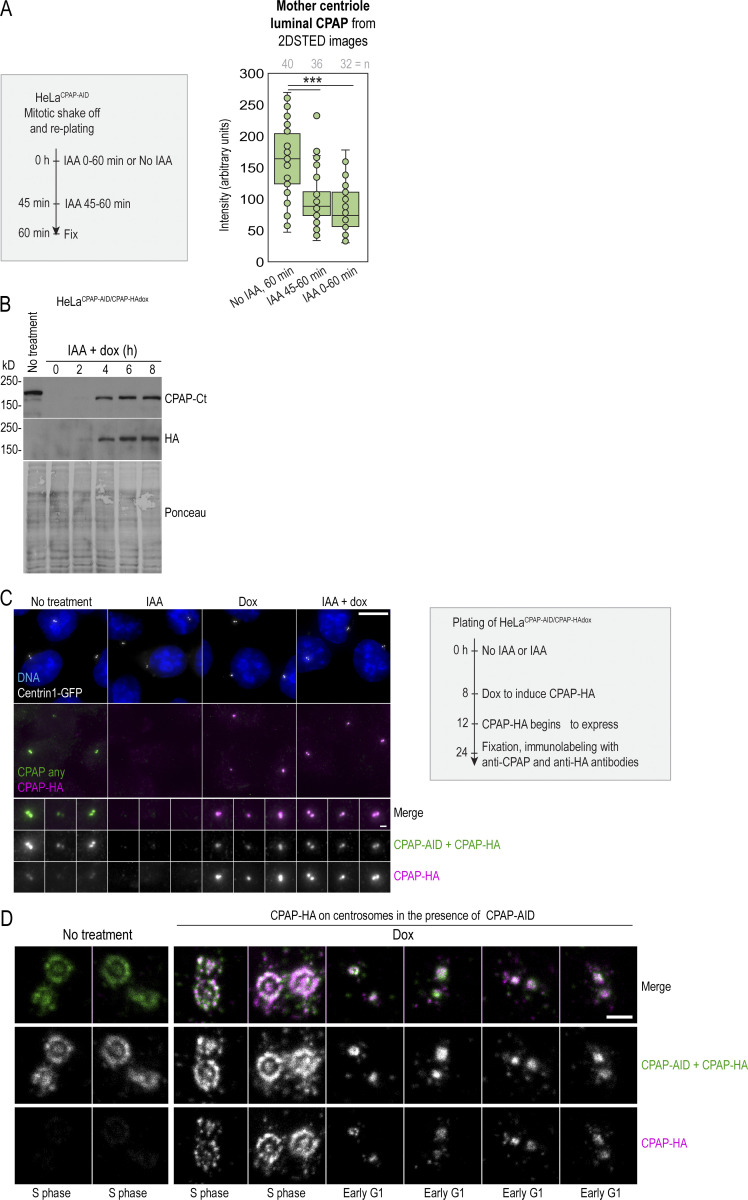
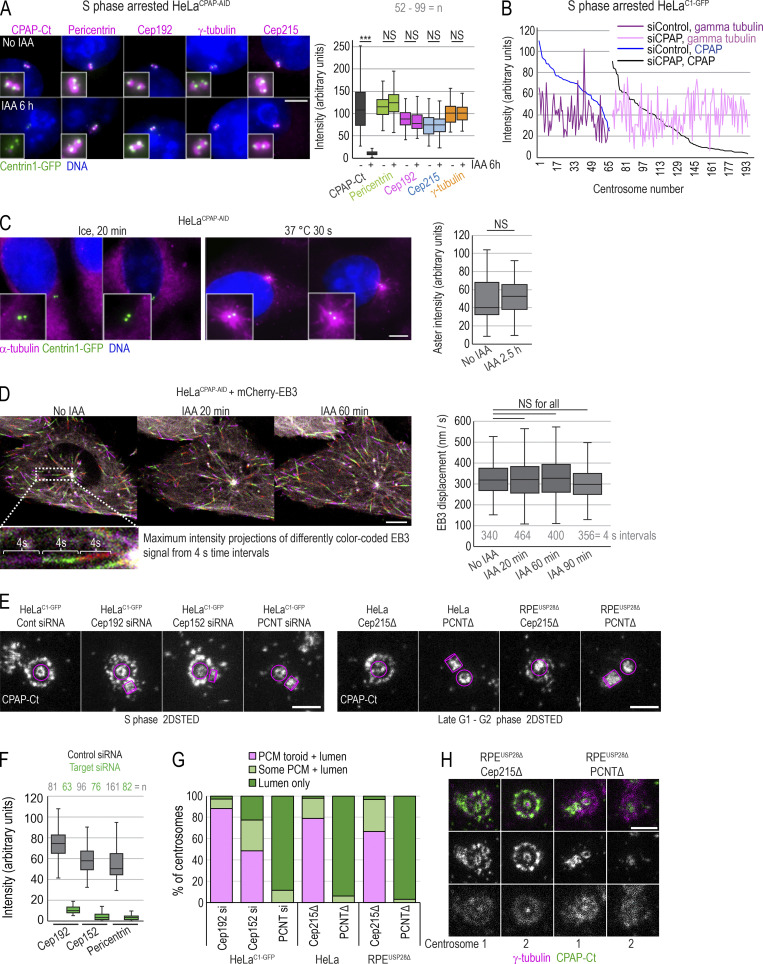
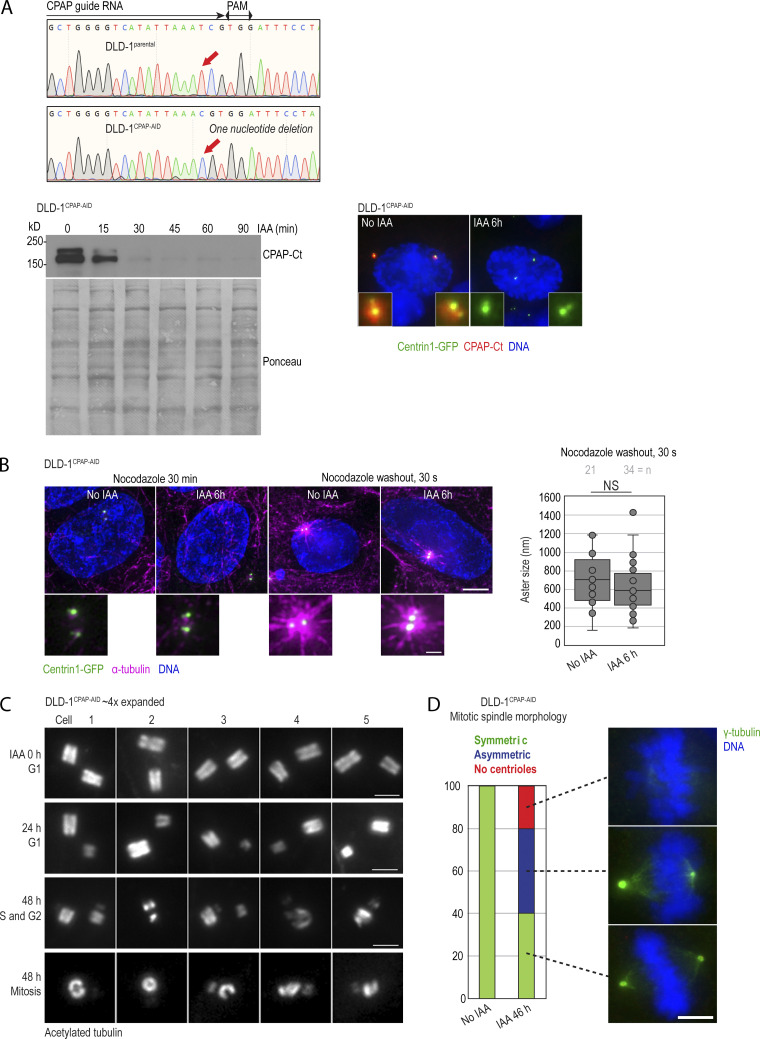
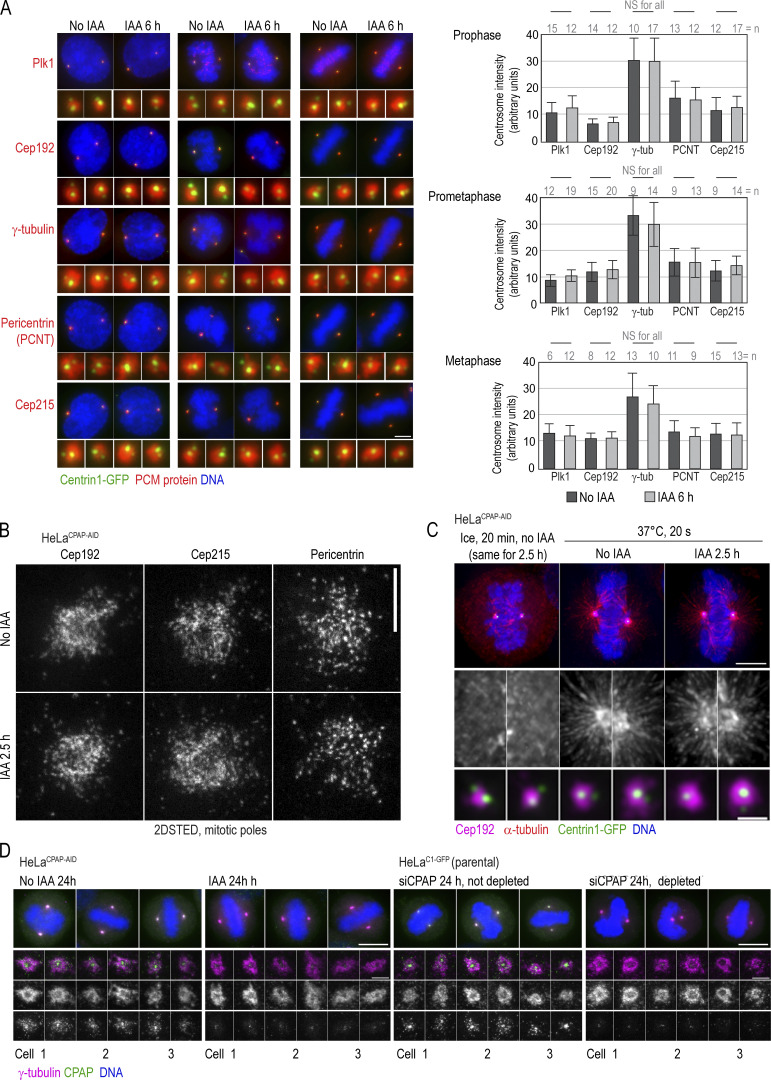
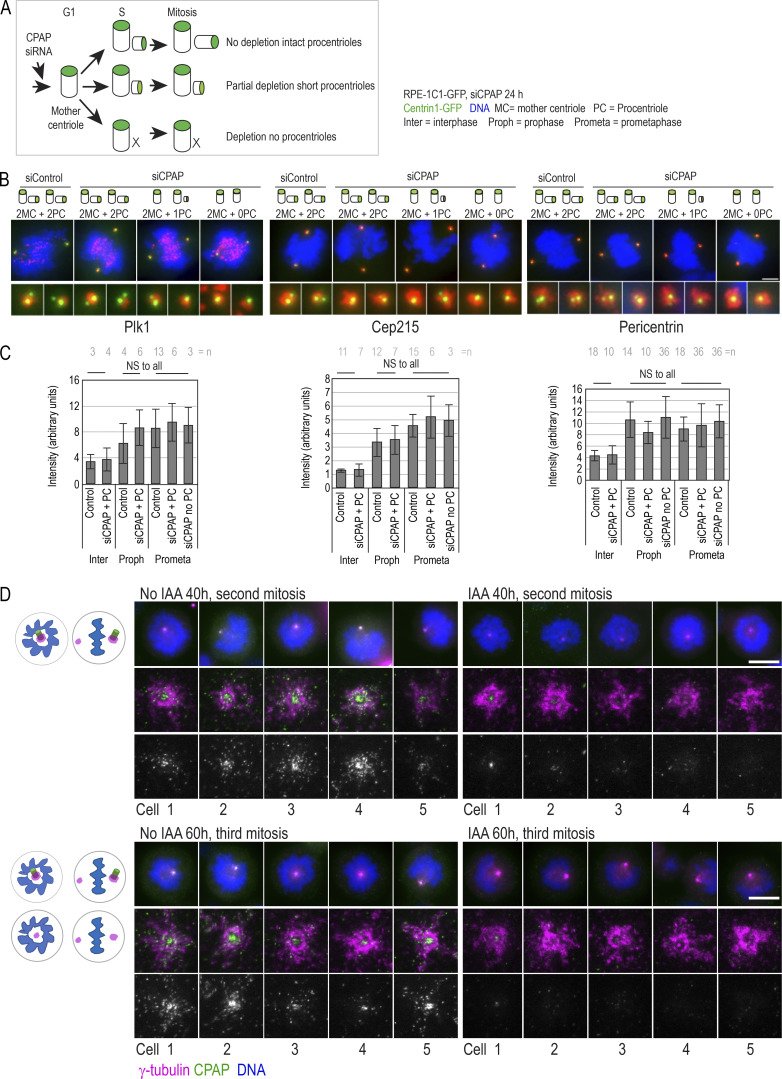
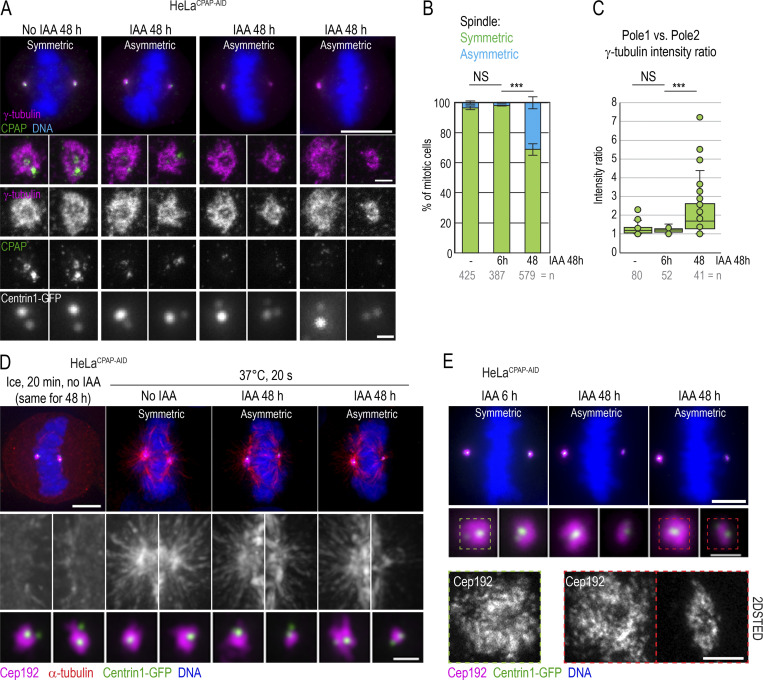
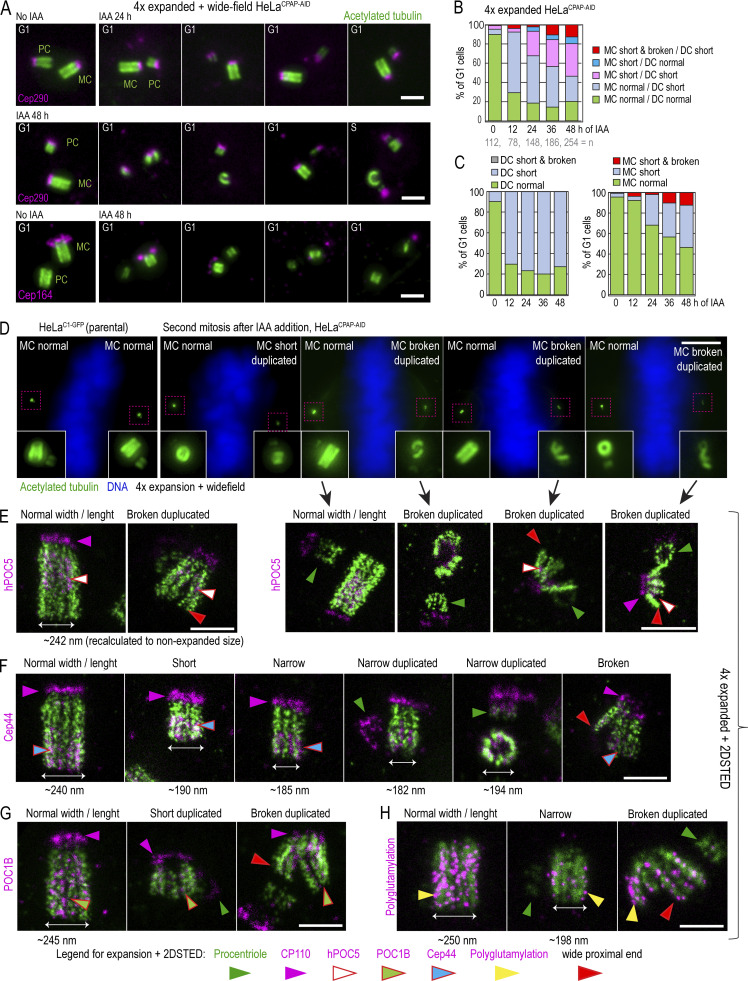
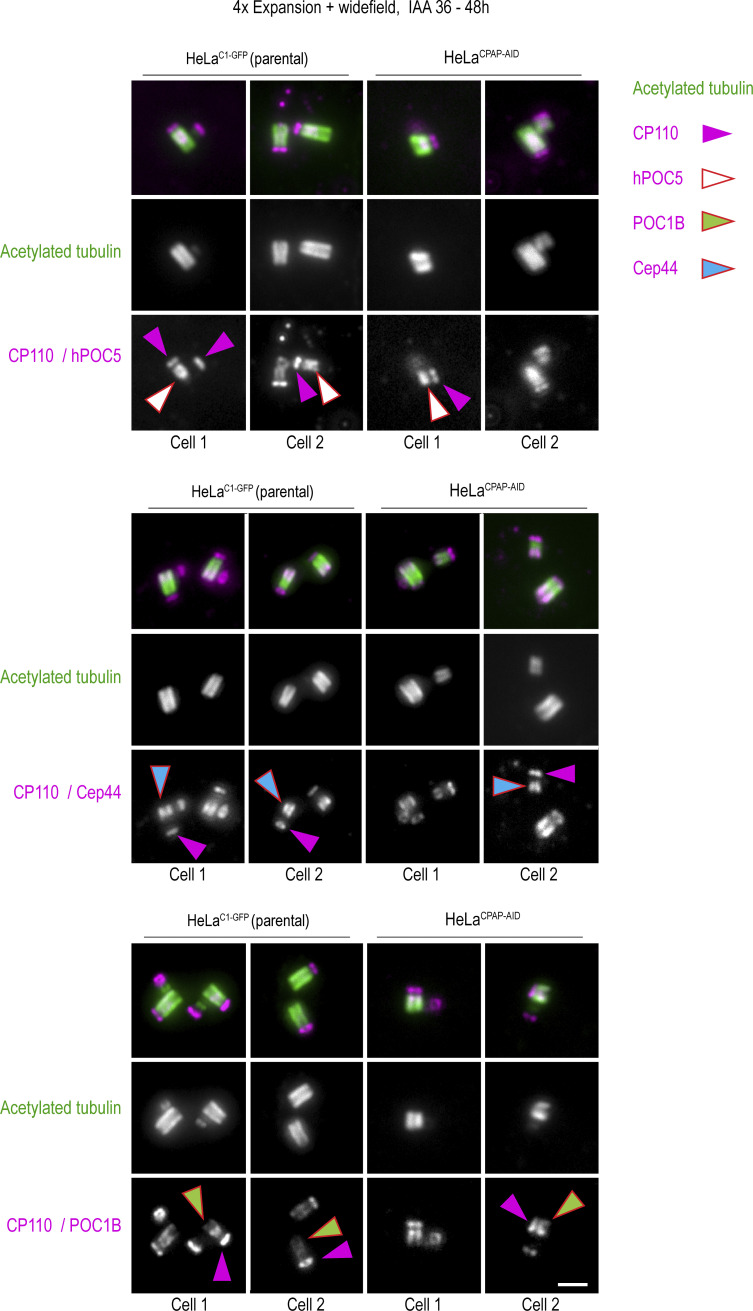
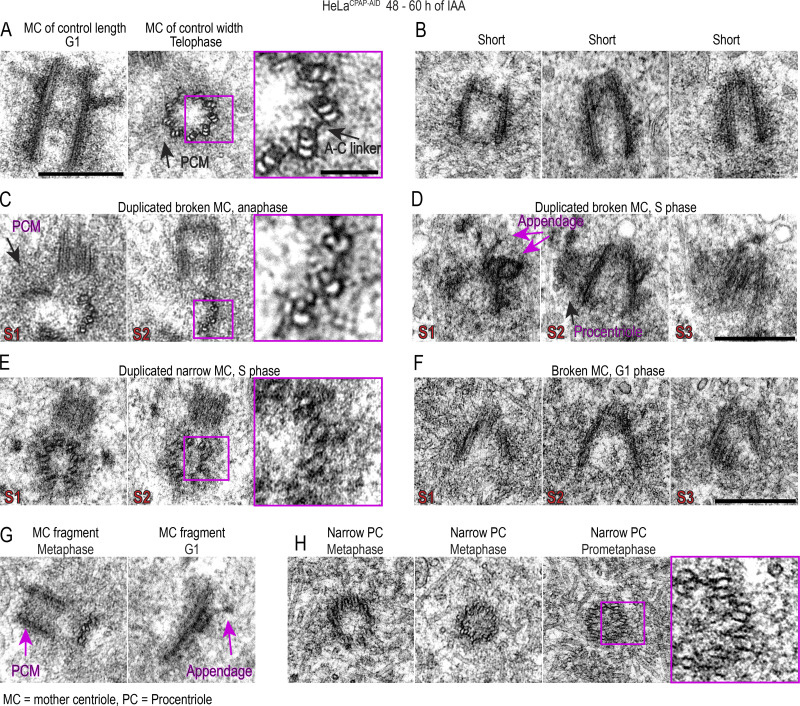
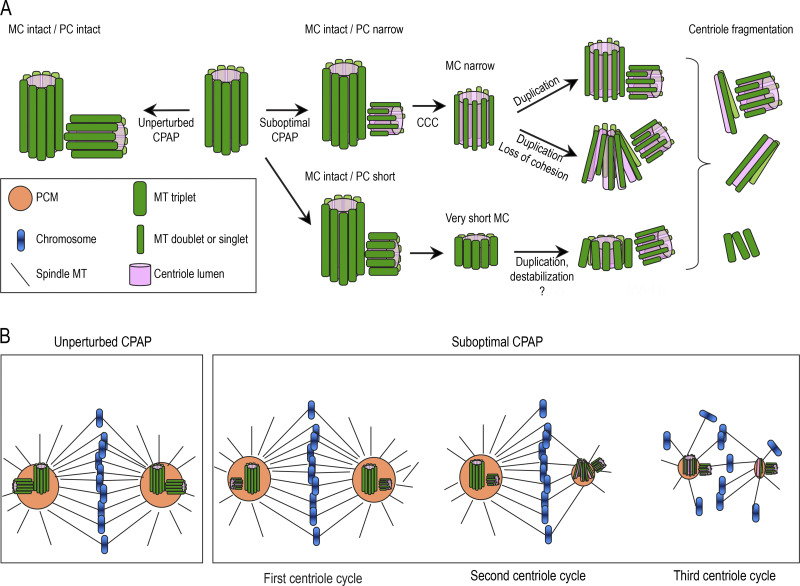
Centrioles are structures that assemble centrosomes. CPAP is critical for centrosome assembly, and its mutations are found in patients with diseases such as primary microcephaly. CPAP's centrosomal localization, its dynamics, and the consequences of its insufficiency in human cells are poorly understood. Here we use human cells genetically engineered for fast degradation of CPAP, in combination with superresolution microscopy, to address these uncertainties. We show that three independent centrosomal CPAP populations are dynamically regulated during the cell cycle. We confirm that CPAP is critical for assembly of human centrioles, but not for recruitment of pericentriolar material on already assembled centrioles. Further, we reveal that CPAP insufficiency leads to centrioles with incomplete microtubule triplets that can convert to centrosomes, duplicate, and form mitotic spindle poles, but fragment owing to loss of cohesion between microtubule blades. These findings further our basic understanding of the role of CPAP in centrosome biogenesis and help understand how CPAP aberrations can lead to human diseases.


Figures

Figure S1.
Figure S1.
Resolution of 2DSTED and quantification of CPAP signals. (A) Mother centriole–specific PCM protein Cep152 and procentriole-specific protein Sas-6 were immunolabeled and imaged with 2DSTED. Sas-6 forms a small toroid within proximal procentriole lumina, which can be resolved using 2DSTED. Intensity plot through the Sas-6 toroid is shown. The length of the Sas-6 signal at half width at half maxima indicates resolution of 2DSTED of ≥32–43 nm (magenta). (B) Quantification of CPAP signal dimensions from superresolution images in S phase–arrested HeLaCPAP-AID and cycling RPE-1C1-GFP, using criteria illustrated by the cartoon. n = centrosome number. Scale bar in A. 0.5 µm. ***, P ≤ 0.001.
Figure 1.
Figure 1.
Centrosomal localization of CPAP and its cell cycle dynamics. Cycling cells were immunolabeled with antibodies recognizing Ct or Nt of endogenous CPAP, and the centrosomal distribution of CPAP signals was analyzed using 3DSTORM and 2DSTED. Low-magnification images of corresponding cells and centrosomes, in which brighter Centrin1-GFP signals correspond to mother centrioles and dimmer signals to procentrioles, are shown next to superresolved images. Centriole schemes depicting approximate centriole orientation are included to facilitate image interpretation. (A) Analysis of CPAP distribution in interphase and mitotic cells using anti CPAP-Ct antibody. (B) Image: Illustration of three typical PCM CPAP configurations. Centrioles were expanded fourfold, immunolabeled for CPAP and centriole MT marker acetylated tubulin, and imaged by 2DSTED (only CPAP is superresolved). Graph: Quantification of centrosomes based on three observed PCM CPAP configurations. n = centrosomes analyzed by 2DSTED, no expansion. (C) A pair of early G1 cells with centrioles containing luminal CPAP. (D) Analysis of CPAP distribution in interphase and mitotic cells using CPAP-Nt antibody. Magenta and red arrows in A and D point to CPAP signal on centriole’s distal and proximal ends, respectively. Blue arrows point to procentriole-associated Nt CPAP signal. (E) 3DSTORM analysis of procentriole-associated CPAP Nt signal, to illustrate its toroidal organization. (F) Quantification of CPAP signal dimensions from superresolution images using criteria illustrated by the cartoon. Histogram shows the average width of CPAP signal ± SD, n = centriole number. (G) 2DSTED analysis of CPAP signal in RPE-1C1-GFP cells using CPAP-Ct and -Nt antibody. Scale bars: 5 µm (wide-field), 0.5 µm for 3DSTORM and 2DSTED, 0.2 µm for rotated 3DSTORM (E), and 1 µm for cropped centrosomes in E. ***, P ≤ 0.001. Source data are available for this figure: SourceData F2.
Figure 2.
Figure 2.
Fast degradation of CPAP fused to an AID. (A) Left: The transfection and selection strategy (described in Materials and methods) used to generate HeLa and DLD-1 cell lines expressing CPAP fused to an AID (HeLaCPAP-AID and DLD-1CPAP-AID). Right: Sequencing result confirming the inactivation of CPAP alleles in HeLaCPAP-AID cells by a point mutation (red arrows). (B) Left and middle: Immunoblot and quantification of centrosomal CPAP in parental and HeLaCPAP-AID cells with and without IAA treatment. n = centrosome number. Right: Re-accumulation of CPAP-AID after IAA washout by immunoblot. (C) The efficiency and dynamics of CPAP-AID degradation after IAA addition. Antibodies recognizing Ct, Nt, and the middle (M) region of CPAP were used for detection. The residual levels of CPAP (shown in blue) represent an average signal intensity from the above blots. (D) Centrosomal CPAP levels and localization after 4 h of IAA treatment. Centrosome-associated CPAP is reduced, and residual CPAP signal is localized to centriole’s lumina and is absent from PCM. (E) Quantification of centrosomal CPAP from wide-field images before and after 6 h of IAA treatment. (F) 2DSTED analysis of centrosome-associated CPAP within first 60 min of IAA treatment. The wide-field images of corresponding superresolved centrioles are shown in insets. Centriole schemes depicting approximate centriole orientation are included. (G) Experimental strategy used in H and I. (H) 3DSTORM analysis of mother centrioles (MC) in late G1 (left) and in early S (right) in IAA-treated cells. CPAP signals analyzed by 3DSTORM are indicated by yellow and red arrows. (I) Centrosomes were labeled for mother centriole–specific protein Cep152 and procentriole-specific protein Sas-6. The percentage of duplicated mother centrioles was determined by scoring the number of MC-PC Centrin1-GFP pairs, and additionally by the presence of Sas-6 signal in association with Cep152 ring from 2DSTED recordings. Scale bars: 5 µm (wide-field); 0.5 µm (2DSTED and 3DSTORM); 1 µm (cropped centrosomes in F and H). *, P ≤ 0.05; ***, P ≤ 0.001.
Figure 3.
Figure 3.
Centriole-associated CPAP is dynamic, and its loss does not destabilize already-assembled mother centrioles. (A) Experimental strategy used to explore the dynamics of mother centriole luminal CPAP in IAA-treated cells in B and C. Cells were treated with IAA to degrade CPAP and with centrinone to prevent centriole duplication. CPAP and γ-tubulin were immunolabeled, and centrosomes were imaged by wide-field and 2DSTED. (B) Centrosomes in IAA-treated samples have reduced or undetectable CPAP and normal γ-tubulin levels. (C) Quantification of CPAP signals. (D) Experimental strategy used to explore the dynamics of mother centriole luminal CPAP in CPAP siRNA–treated cells in E and F. (E) Centrosomes in CPAP siRNA–treated samples have reduced or undetectable CPAP and normal γ-tubulin levels. (F) Quantification of CPAP signals. (G) Experimental strategy used to explore long-term stability of mother centrioles after CPAP removal by IAA or siRNA used in H–J, Fig. 5 D, and Fig. S4 D. (H) Centrosomes in IAA or siRNA-treated samples have reduced or undetectable CPAP and normal γ-tubulin levels. (I) Expansion/2DSTED analysis of G1 centrioles after 60 h of IAA or siRNA treatment. Acetylated tubulin labels centriole MT walls. Acetylated tubulin is not superresolved. (J) Quantification of mother centriole phenotypes from expanded samples after 40 and 60 h of IAA and siRNA treatment. Scale bars: 0.5 µm (B, E, and H); 1 µm (I). n = centrosome number. *, P ≤ 0.05; ***.
Figure S2.
Figure S2.
Centriole-associated CPAP can be degraded from centriole lumen and is dynamically associated with centrioles. (A) Loss of the luminal CPAP from G1 centrioles in HeLaCPAP-AID cells after 15 min and 1 h of IAA treatment. Scheme depicts experimental strategy. Mitotic cells were shaken off and replated, and some cells were immediately treated with IAA to degrade CPAP. The second sample of cells was left untreated, and the third sample was treated for the last 15 min before fixation. All samples were fixed 60 min after shake-off, immunolabeled for CPAP and γ-tubulin, and imaged using 2DSTED. The intensity of luminal CPAP was determined from 2DSTED images. γ-tubulin was used as a marker for centriole orientation and centriole identification during imaging. The analysis shows that centriole-associated CPAP (which in early G1 consists of only luminal CPAP, as the PCM CPAP population is absent from early G1 centrioles; Fig. 1 C) is already reduced in IAA-treated cells after 15 min of IAA treatment. (B–D) Characterization of HeLaCPAP-AID/CPAP-HAdox cell line that expresses CPAP-AID constitutively and CPAP-HA inducibly, after doxycycline (dox) addition. (B) Immunoblot showing CPAP-AID levels and expression dynamics of CPAP-HA after dox addition. Newly synthesized CPAP-HA is expressed in cells 4 h after dox addition. (C) Cells were treated as depicted by the scheme. Wide-field images of centrosomal total CPAP (detected by anti CPAP-Ct antibody) and newly synthesized CPAP-HA (detected by anti HA antibody) are shown. (D) 2D STED images of centrosomes showing incorporation of CPAP-HA to centrosomes of all ages. Note that the faint CPAP-HA signal visible in untreated samples in S2D is due to the cross talk of STARORANGE and STARRED dies used to detect total CPAP and HA by STED. Scale bars: 10 µm (C); 1 µm (inset in C); 0.5 µm (D). ***, P ≤ 0.001. Source data are available for this figure: SourceData FS2.
Figure 4.
Figure 4.
Acute removal of CPAP does not perturb centrosome PCM recruitment or MT nucleation in interphase. (A) S phase–arrested cells were treated or not with IAA for 6 h, immunolabeled for indicated PCM proteins, and imaged. Plot: Quantification of PCM proteins is shown in box-and-whiskers plot. n = cell number. (B) Cells were treated with CPAP siRNA, arrested in S phase for 26 h, immunolabeled for γ-tubulin and CPAP, and imaged. The levels of CPAP and γ-tubulin were determined and plotted for each centrosome. No correlation between centrosome-associated CPAP and γ-tubulin was observed after plotting. (C) MT nucleation recovery after cold treatment. IAA treatment for 2.5 h does not change the intensity of MT asters, labeled by α-tubulin, after recovery. n = number of asters. (D) Cells expressing mCherry-EB3 were imaged every second over 1 min to record the position of growing MT tips. Maximum-intensity projections of four 1-s frames were generated and color coded (as shown in inset). Displacement of mCherry-EB3 in 4-s intervals was measured for MTs showing linear growth. Box-and-whiskers plot represents displacement of mCherry-EB3 signals within the same cell before and after 20, 60, or 90 min of IAA treatment. n = number of measured 4-s intervals. (E) CPAP was detected by immunofluorescence in HeLaC1-GFP cells depleted for Cep192, Cep152, or pericentrin (PCNT) and in RPE1-USP28Δ cells knocked out for pericentrin or Cep215. CPAP signal was imaged by 2DSTED. Removal of pericentrin results in the loss of the PCM CPAP population. Magenta lines delineate centriole’s position and orientation. (F) Levels of indicated protein on centrosomes of cells transfected with control and targeting siRNA. (G) Plot: Characterization of CPAP phenotypes observed from 2DSTED recordings. (H) Interphase centrosomes in Cep215 and pericentrin knockouts associate with γ-tubulin. n = centrosome number. Scale bars: 5 µm (A, C, and D); 0.5 µm (E and H). ***, P ≤ 0.001.
Figure S3.
Figure S3.
Characterization of DLD-1CPAP-AID cells and the effect of CPAP degradation on centriole structure in this cell line. (A) Sequencing result confirming the inactivation of endogenous CPAP alleles in DLD-1CPAP-AID cells by a point mutation (red arrows). Immunoblot represents the efficiency and dynamics of CPAP-AID degradation in DLD-1CPAP-AID cells after IAA addition. Microscopy image shows decreased centrosomal CPAP levels after 6 h of IAA treatment. Centrosome-associated CPAP-AID signal is significantly reduced in IAA-treated cells. (B) MT nucleation recovery after nocodazole washout. IAA treatment for 6 h does not change the size of MT asters after nocodazole washout. (C) Examples of expanded centrioles from control and IAA-treated DLD-1CPAP-AID cells. Cycling cells were treated with IAA for 24 and 48 h, expanded approximately fourfold, immunolabeled using acetylated tubulin to label centriole MT walls, and imaged using a conventional wide-field microscope. Control G1 cells contain two intact centrioles of similar sizes. After 24 h of IAA treatment, most G1 cells contain one full-length mother centriole and one short and/or narrow daughter centriole. The lower two panels illustrate cells containing short and/or broken duplicated mother centrioles in cells treated with IAA for 48 h. (D) Quantification of mitotic spindle morphology in DLD-1CPAP-AID cells treated with IAA for 46 h and immunolabeled for γ-tubulin. Graph shows percentage of cells. Examples of symmetric, asymmetric, and acentrosomal mitoses are shown. Scale bars: 5 µm (B); 0.5 µm (inset in B); 2 µm (C); 5 µm (D). Source data are available for this figure: SourceData FS3.
Figure 5.
Figure 5.
Acute removal of CPAP does not perturb centrosome PCM recruitment or organization of PCM components during mitosis. (A) Cells were treated with IAA for 6 h and immunolabeled for indicated PCM proteins. Imaging and quantification of the intensities of PCM proteins show comparable centrosomal levels in control and IAA-treated cells. Histograms show the average intensity ± SD, n = centrosome number. (B) 2DSTED imaging shows that the patterns of localization of three major components of the mitotic PCM lattice, Cep192, Cep215, and pericentrin, are not changed after 2.5 h of IAA treatment. (C) MT nucleation recovery after cold treatment. IAA treatment for 2.5 h does not change the recovery of MT nucleation or centrosomal levels of Cep192. (D) Structurally intact mother centrioles organize control-looking mitotic spindles. Cells were treated with IAA or depleted by siRNA, and centrinone was added to prevent centriole duplication, as described in Fig. 3 G. Cells were fixed at 24 h when they were undergoing mitosis, immunolabeled for γ-tubulin and CPAP, and imaged by wide-field microscopy; spindle poles were imaged by STED. Scale bars: 5 µm (A); 0.5 µm (B); 5 µm (C); 1 µm (enlarged centrosomes in C); 10 µm (wide-field in D); 1 µm (STED in D).
Figure S4.
Figure S4.
The effect of CPAP removal on recruitment of PCM in mitosis by structurally intact mother centrioles. (A–C) Characterization of PCM recruitment by intact mother centrioles in RPE-1 cells after CPAP depletion. RPE-1 cells were collected by shake-off, replated, and transfected with CPAP siRNA or control non-targeting siRNA ∼2 h later. Cells were fixed 24 h after shake-off, when they were undergoing mitosis. Cells were immunolabeled for PLK1, Cep215, and pericentrin, and analyzed by microscopy. Please note that all cells at the time of fixation harbor structurally intact mother centrioles formed before CPAP depletion. (A) Cartoon depicting the effect of various levels of CPAP depletion by siRNA on centriole duplication. (B) Examples of mitotic cells immunolabeled for indicated PCM proteins after CPAP depletion. Mother centriole duplication status is indicated above the image. Cells with unduplicated mother centrioles were considered depleted for CPAP. The images show that both control and CPAP-depleted mother centrioles contain similar levels of PCM components. (C) Quantification of PCM signals on centrosomes formed by control or CPAP-depleted mother centrioles. (D) Characterization of γ-tubulin recruitment by intact mother centrioles in HeLaCPAP-AID cells after CPAP degradation. HeLaCPAP-AID were shaken off and 2 h later treated with IAA to degrade CPAP and with centrinone to prevent duplication of mother centrioles (see Fig. 3 G). Cells were fixed 40 or 60 h after shake-off, when they were undergoing their second and third mitosis, respectively. Cells were immunolabeled for γ-tubulin and CPAP and imaged by wide-field. Corresponding centriole-containing spindle poles were additionally imaged using 2DSTED. Images show examples of mother centriole-containing spindle poles. In IAA-treated cells, mother centriole-associated CPAP is reduced or undetectable. However, γ-tubulin is accumulated to mitotic spindle poles at levels comparable to the controls. Cartoons depict mitotic figures present in the population at indicated times. n = centrosome number. Scale bars: 5 µm (B); 10 µm (D); 1 µm (enlarged centrioles in D).
Figure 6.
Figure 6.
Asymmetric mitotic spindle poles with reduced PCM in cells after prolonged CPAP degradation. Asynchronous cells were treated with IAA for the indicated time, fixed, and immunolabeled for γ-tubulin + CPAP or α-tubulin + Cep192. (A) Examples of asymmetric spindle poles with decreased recruitment of γ-tubulin after 48 h of IAA treatment. Cells were imaged by wide-field microscopy, and the spindle poles were additionally imaged by 2DSTED. (B) Quantification of mitotic cells harboring mitotic spindle asymmetry. n = cell number. (C) Calculated γ-tubulin intensity ratios between two poles of the same mitotic spindle reveals poles of similar intensity in control cells but of asymmetric intensity in cells treated with IAA for 48 h. n = cell number. (D) MT nucleation recovery after cold treatment. In mitotic cells treated with IAA for 48 h, spindle poles associated with lower amounts of PCM protein Cep192 recover smaller MT asters after cold treatment. (E) The pattern of Cep192 localization on mitotic spindle poles in cells treated with IAA for 6 or 48 h, as analyzed by 2DSTED. CPAP degradation does not affect the pattern of Cep192 (compare to Fig. 5 B). Scale bars: 10 µm (A); 0.5 µm (centrosomes in A); 5 µm (D); 1 µm (centrosomes in D); 5 µm (E); 0.5 µm (centrosomes in E). ***, P ≤ 0.001.
Figure 7.
Figure 7.
CPAP removal leads to the assembly of structurally defective centrioles that destabilize on proximal ends. Cells were synchronized by mitotic shake-off (t = 0 h) and treated with IAA 6 h after shake-off. Cells were fixed when noted, expanded approximately fourfold, immunolabeled using acetylated tubulin to label centriole MT walls (green) and various centrosomal proteins (magenta), and imaged. (A) Examples of centriole configurations in control and IAA-treated cells. (B and C) Characterization of the phenotypes of MC-DC pairs in G1 cells at indicated times. Phenotypes of MCs and DCs are additionally shown individually in C. (D) Wide-field images of mitotic cells after 48 h of IAA treatment containing one normal-looking and one aberrant mother centriole. 2DSTED high-resolution images of four centrioles indicated by arrows are shown below. (E–H) Examples of expanded centrioles after 36–48 h of IAA treatment, labeled with acetylated tubulin and colabeled with centriole cap protein CP110, centriole distal protein hPOC5 (E), centriole proximal protein Cep44 (F), centriole luminal protein POC1B (G), and polyglutamylated tubulin (H). The panels illustrate mother centrioles that lost cohesion on proximal ends (red arrows) and that have shorter and narrower acetylated tubulin signal than controls. M, mitosis. Scale bars: 2 µm (A); 20 µm (wide-field in D); 2 µm (2DSTED in D); 1 µm (E–H).
Figure S5.
Figure S5.
Localization of centrosomal proteins on expanded HeLaC1-GFP and HeLaCPAP-AID centrioles after 36–48 h of IAA treatment. Cells were treated with IAA for 36–48 h, fixed, expanded, and immunolabeled for indicated centriolar proteins (magenta) and acetylated tubulin (green). Both control centrioles and short centrioles contain indicated centrosomal proteins. Arrows point to individual proteins, to facilitate interpretation. Proximal-distal polarity is preserved on short and narrow centrioles in IAA-treated cells. On short centrioles, proximal and distal portions are both shorter than normal. Scale bar: 2 µm (corresponding to ∼0.25 µm in unexpanded sample). This figure is associated with Fig. 6 of the main text.
Figure 8.
Figure 8.
Prolonged CPAP removal results in centrioles with incomplete MT triplets that can convert to centrosomes and duplicate. CPAP was degraded by addition of IAA to culture medium for 48–60 h. Cells were fixed and analyzed by EM. The figure illustrates various centriolar phenotypes detected during analysis. (A) Examples of normally structured centrioles. (B) Short and narrow centrioles from late G1 cells. (C) Broken mother centriole built of MT doublets instead of MT triplets in anaphase. Mother centriole is associated with a procentriole. (D) Short mother centriole with unparallel MT blades that lost cohesion on proximal end. Mother centriole is associated with a procentriole, and appendage-like structures are visible on its distal end. (E) Duplicated narrow mother centriole in S phase built of MT doublets. (F) A short centriole with unparallel MT blades and widened proximal end. (G) Centriole fragments. Left: Centriole fragment built of MT doublets associated with a normal-looking procentriole. Right: Centriole fragment associated with a distal appendage. (H) Narrower-than-normal mitotic procentrioles with incomplete MT triplets. Scale bars: 0.4 µm; 0.1 µm (insets marked in magenta). S1–S3: the number of a consecutive 80-nm-thick serial section.
Figure 9.
Figure 9.
Schematic summary of the consequences of suboptimal CPAP levels in human cells. The scheme illustrates centrioles and mitotic spindles in human cells with CPAP levels reduced to ∼3% of their original levels using AID system (Fig. 2). (A and B) Unperturbed levels of CPAP result in the assembly of intact centrioles during centriole duplication (A). Suboptimal CPAP levels allow centriole duplication but result in the assembly of shorter and sometimes narrower procentrioles (PC). Instead of nine MT triplets, narrower procentrioles contain some or all MT doublets, and possibly singlets. Although built of incomplete MT triplets, procentrioles can undergo centriole-to-centrosome conversion (CCC), and in the subsequent cell cycle, they can acquire PCM and duplicate. However, structurally aberrant centrioles are unstable, lose cohesion between MT blades, destabilize, and fragment. MC, mother centriole. Consequences of acute and prolonged CPAP levels on mitotic spindles (B). In cells with unperturbed CPAP levels, mitotic spindles are largely symmetric. Reduction of CPAP within one centriole cycle affects the assembly of nascent centrioles but does not affect the accumulation of PCM on mitotic spindle poles by previously assembled and structurally intact MCs. Reduction of CPAP levels for longer than one centriole cycle results in asymmetric mitotic spindle poles with reduced levels of PCM, which are organized by structurally defective centrioles or centriole fragments.

Similar articles

Cited by

References

    1. Alieva, I.B., Zemskov E.A., Smurova K.M., Kaverina I.N., and Verin A.D.. 2013. The leading role of microtubules in endothelial barrier dysfunction: Disassembly of peripheral microtubules leaves behind the cytoskeletal reorganization. J. Cell. Biochem. 114:2258–2272. 10.1002/jcb.24575 - DOI - PMC - PubMed
    1. Atorino, E.S., Hata S., Funaya C., Neuner A., and Schiebel E.. 2020. CEP44 ensures the formation of bona fide centriole wall, a requirement for the centriole-to-centrosome conversion. Nat. Commun. 11:903. 10.1038/s41467-020-14767-2 - DOI - PMC - PubMed
    1. Azimzadeh, J., Hergert P., Delouvée A., Euteneuer U., Formstecher E., Khodjakov A., and Bornens M.. 2009. hPOC5 is a centrin-binding protein required for assembly of full-length centrioles. J. Cell Biol. 185:101–114. 10.1083/jcb.200808082 - DOI - PMC - PubMed
    1. Balestra, F.R., von Tobel L., and Gönczy P.. 2015. Paternally contributed centrioles exhibit exceptional persistence in C. elegans embryos. Cell Res. 25:642–644. 10.1038/cr.2015.49 - DOI - PMC - PubMed
    1. Basto, R., Brunk K., Vinadogrova T., Peel N., Franz A., Khodjakov A., and Raff J.W.. 2008. Centrosome amplification can initiate tumorigenesis in flies. Cell. 133:1032–1042. 10.1016/j.cell.2008.05.039 - DOI - PMC - PubMed

Publication types

Substances

Grants and funding