. 2022 May 2;219(5):e20210562.
doi: 10.1084/jem.20210562. Epub 2022 Apr 11.

Monocytes transition to macrophages within the inflamed vasculature via monocyte CCR2 and endothelial TNFR2

Affiliations

Monocytes transition to macrophages within the inflamed vasculature via monocyte CCR2 and endothelial TNFR2

Vijayashree Mysore et al. J Exp Med. .

Abstract

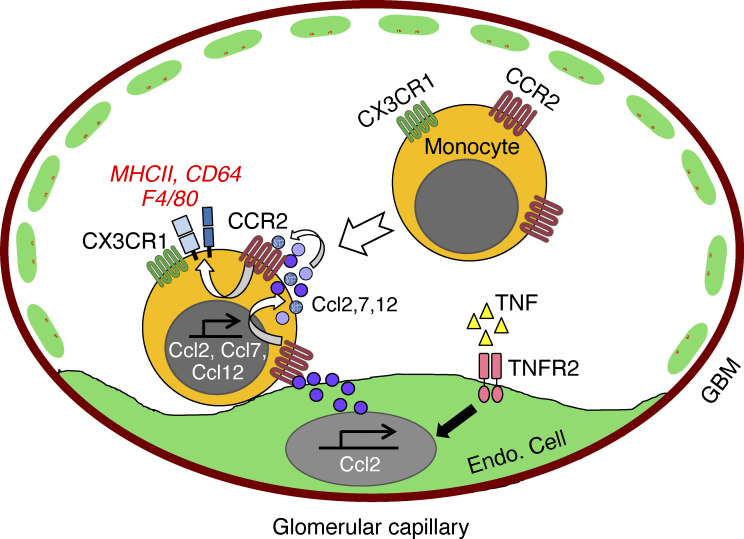
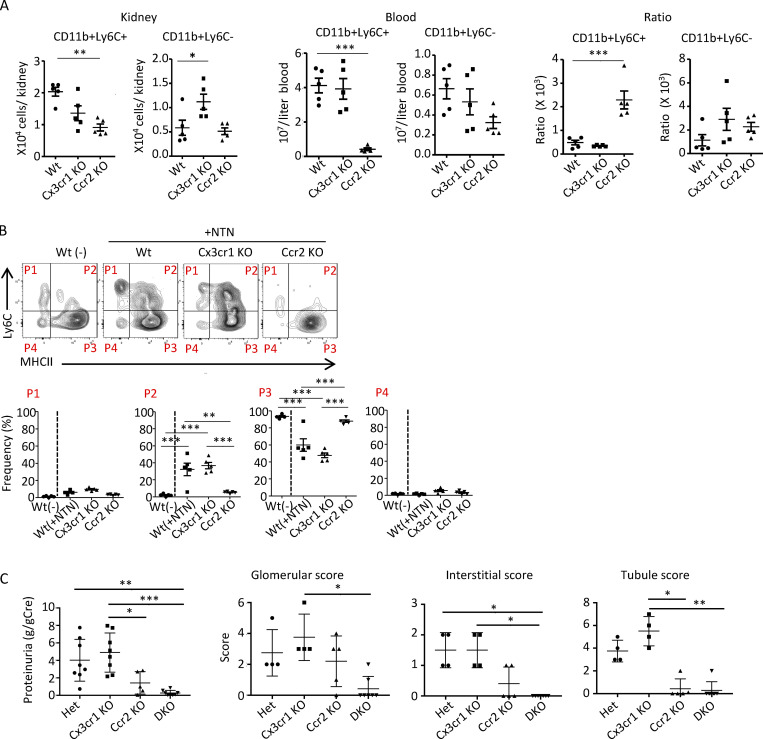
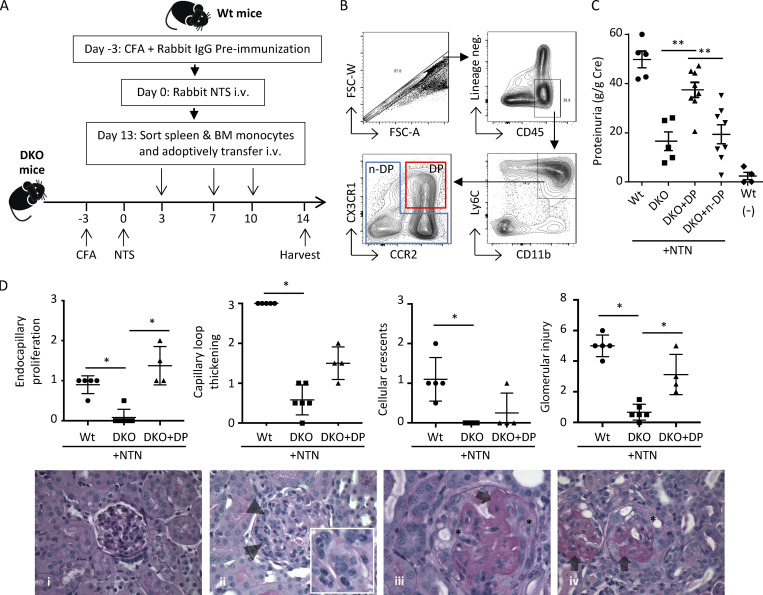
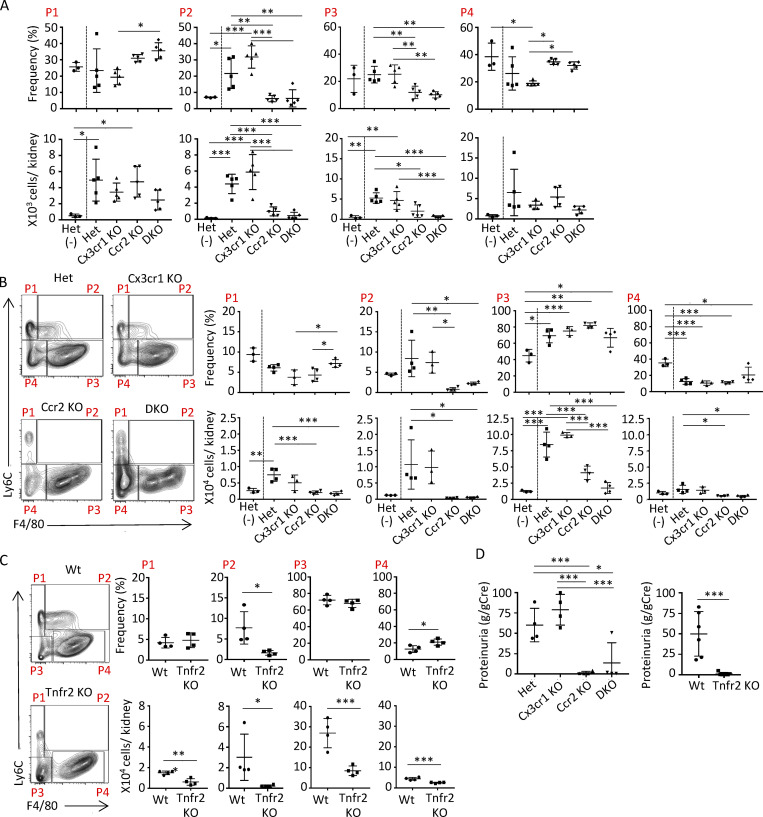
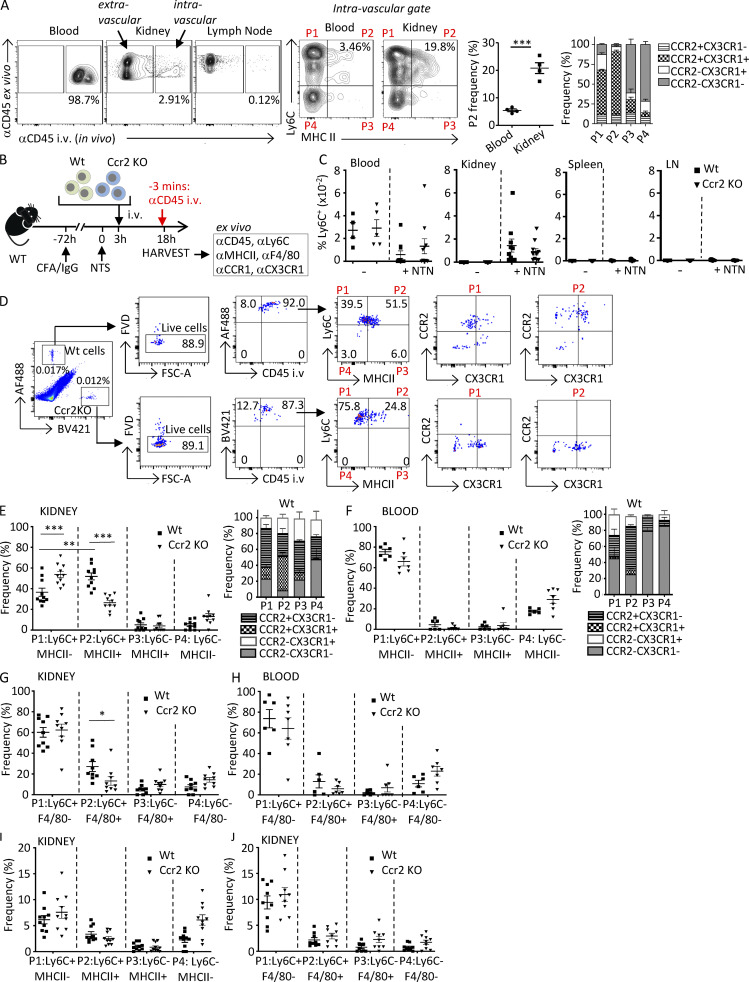
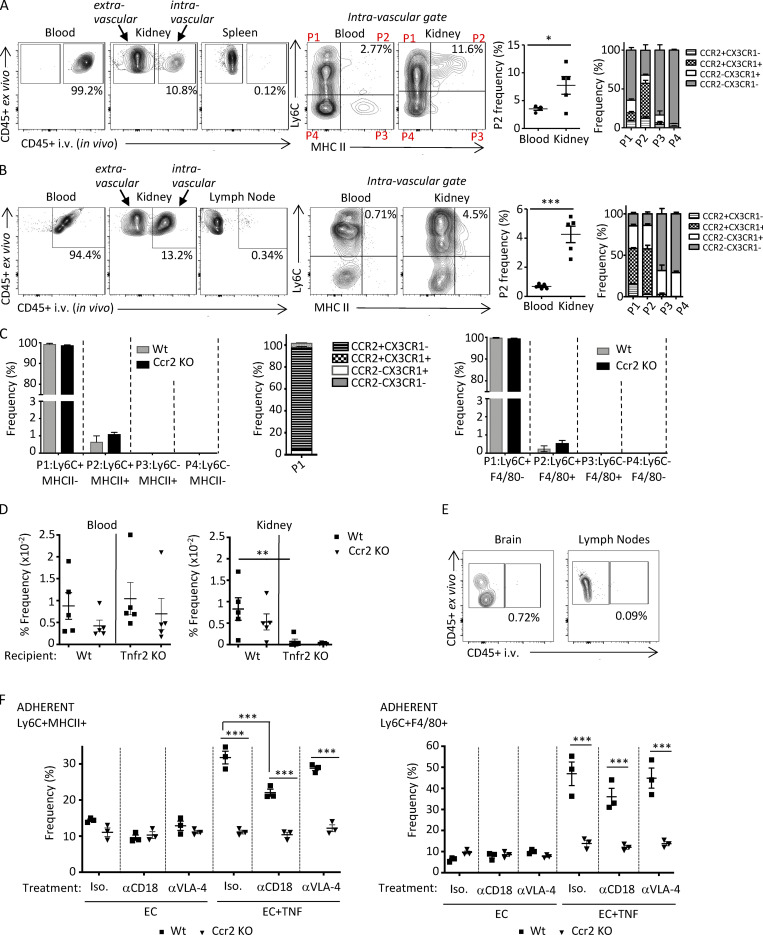
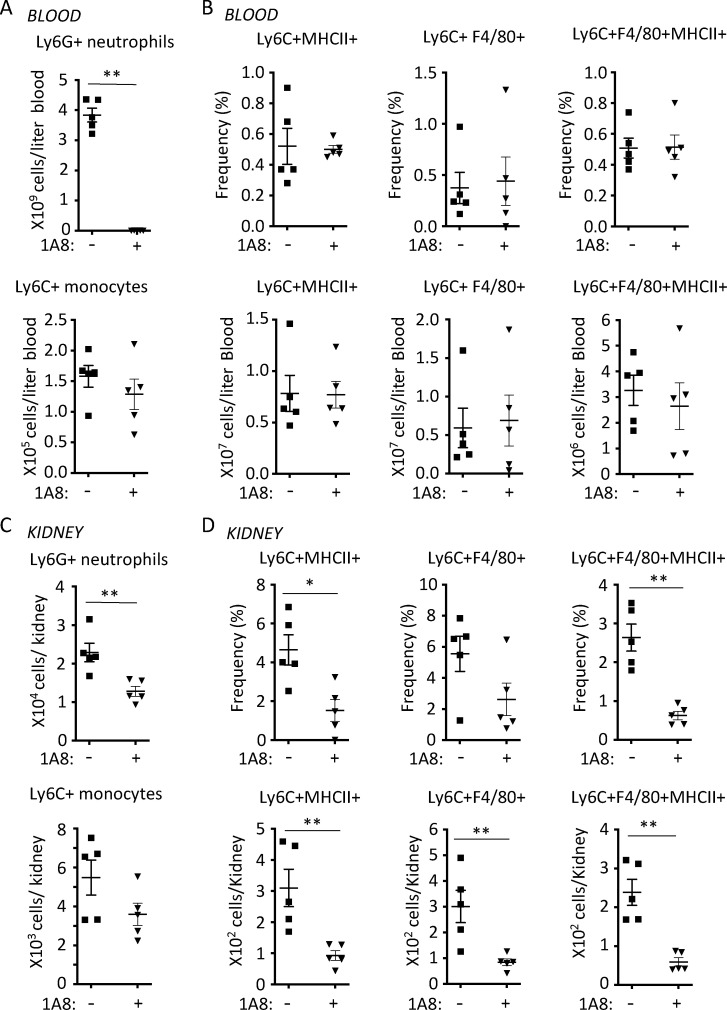
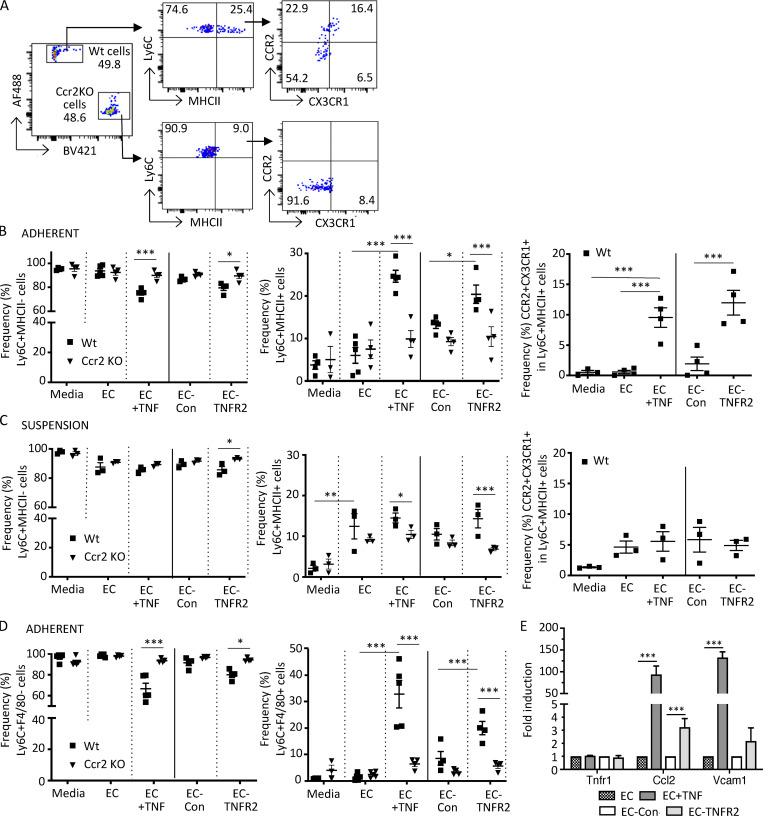
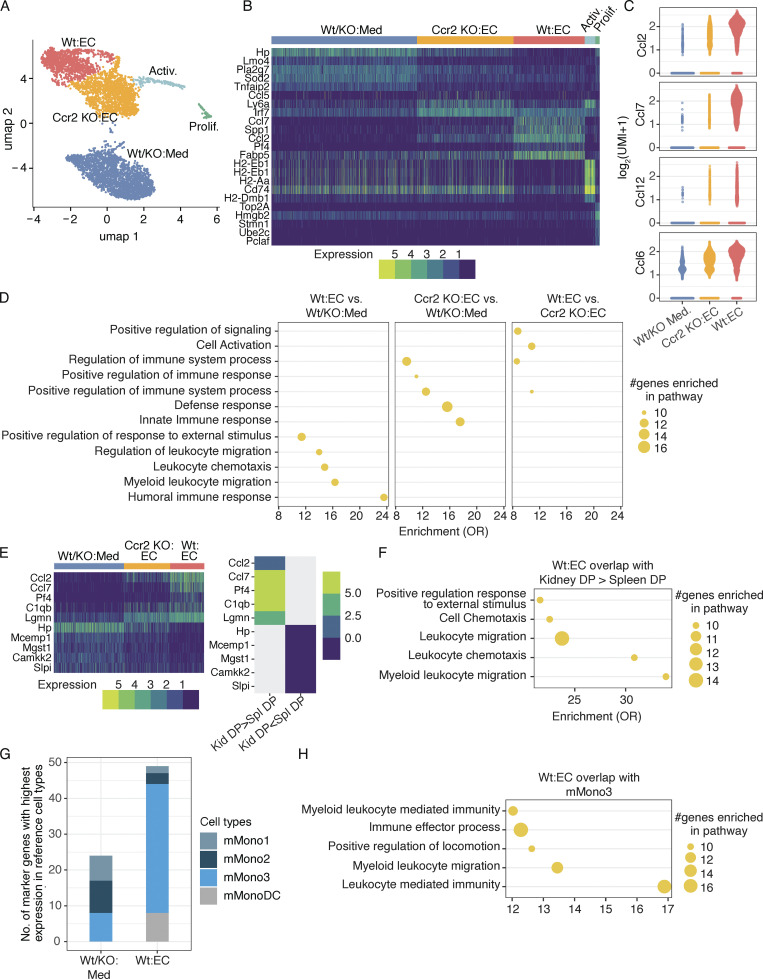
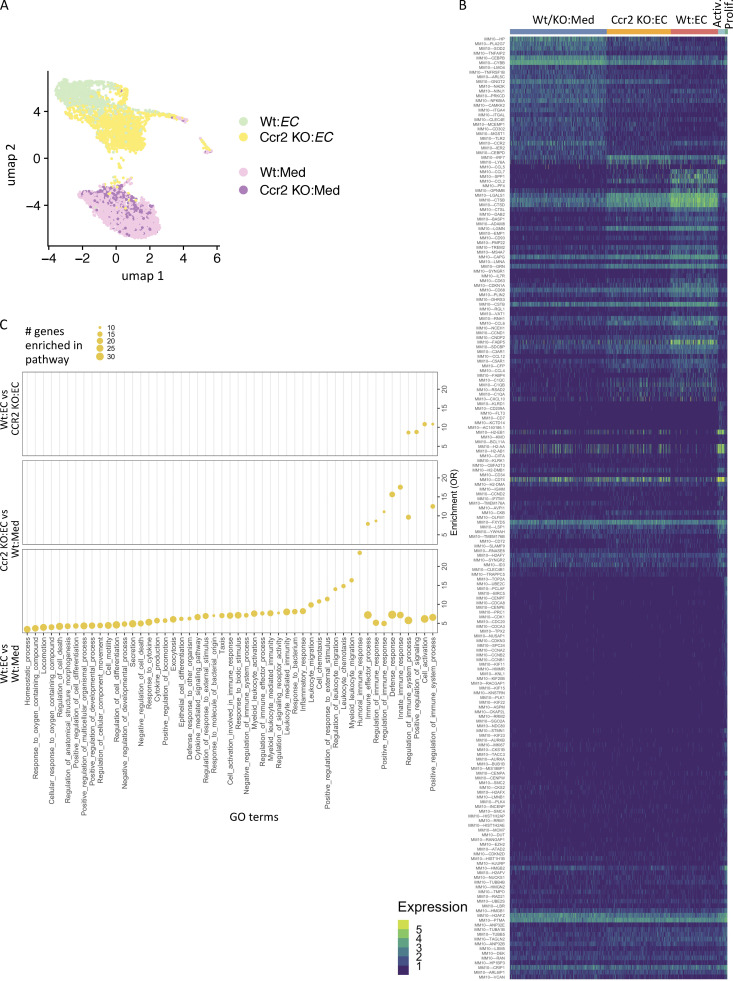
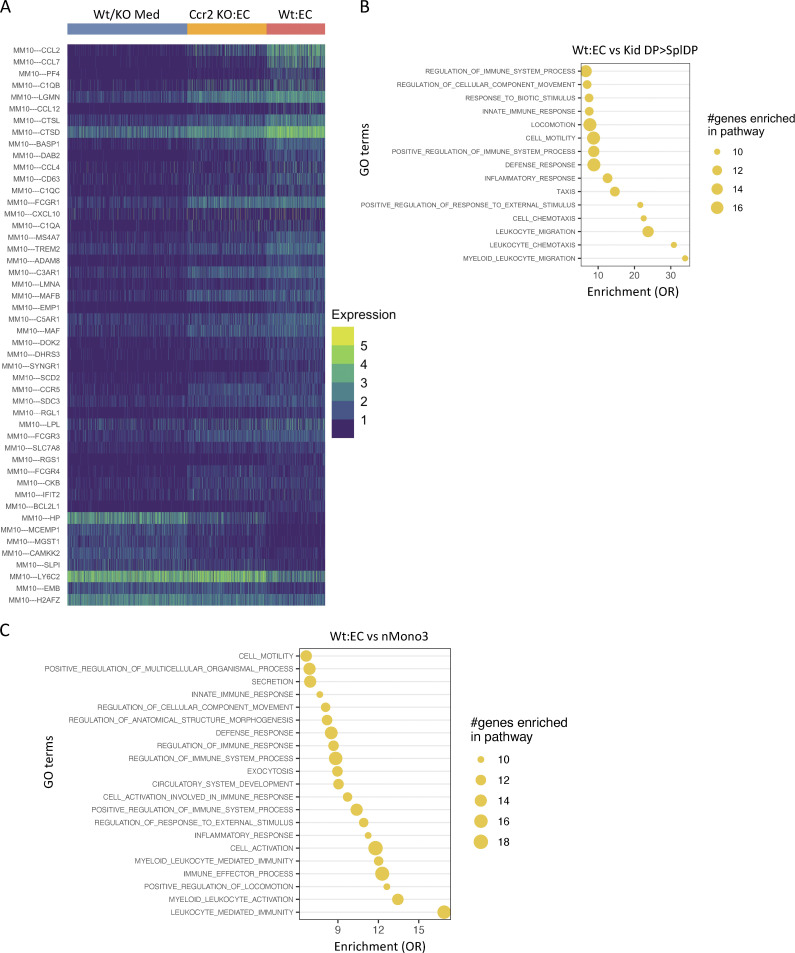
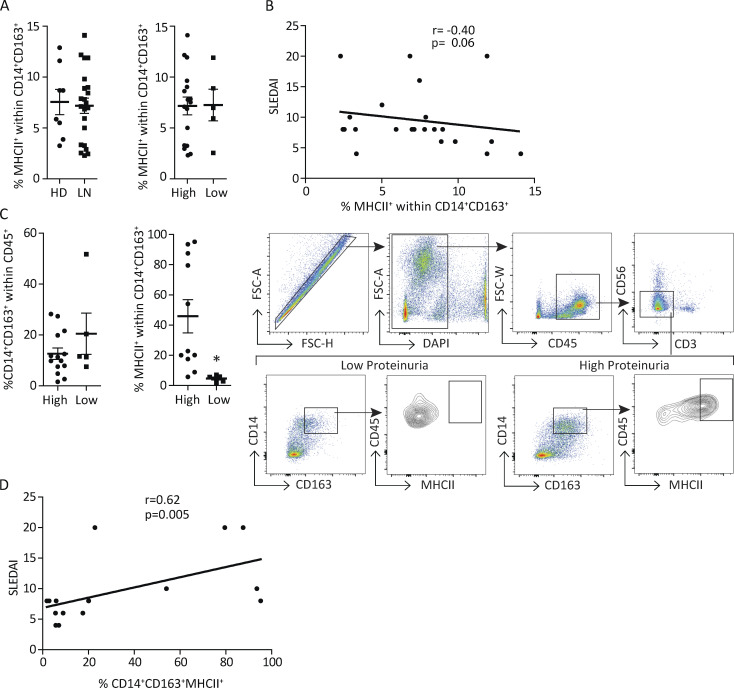
Monocytes undergo phenotypic and functional changes in response to inflammatory cues, but the molecular signals that drive different monocyte states remain largely undefined. We show that monocytes acquire macrophage markers upon glomerulonephritis and may be derived from CCR2+CX3CR1+ double-positive monocytes, which are preferentially recruited, dwell within glomerular capillaries, and acquire proinflammatory characteristics in the nephritic kidney. Mechanistically, the transition to immature macrophages begins within the vasculature and relies on CCR2 in circulating cells and TNFR2 in parenchymal cells, findings that are recapitulated in vitro with monocytes cocultured with TNF-TNFR2-activated endothelial cells generating CCR2 ligands. Single-cell RNA sequencing of cocultures defines a CCR2-dependent monocyte differentiation path associated with the acquisition of immune effector functions and generation of CCR2 ligands. Immature macrophages are detected in the urine of lupus nephritis patients, and their frequency correlates with clinical disease. In conclusion, CCR2-dependent functional specialization of monocytes into macrophages begins within the TNF-TNFR2-activated vasculature and may establish a CCR2-based autocrine, feed-forward loop that amplifies renal inflammation.


Conflict of interest statement

Disclosures: The authors declare no competing interests exist.

Figures

None
Graphical abstract
Figure S1.
Figure S1.
Gating strategies, CCR2, and CX3CR1 antibody specificity and the analysis of CCR2 and CX3CR1 on blood monocytes. (A) Representative FACS plot of the gating strategy for the analysis of Ly6C and MHCII in monocyte/macrophage populations in the kidney 14 d after NTN induction. Live, CD45+ cells (not depicted) were analyzed under the Singlets+Ly6GCD3CD11cNKCD11b+ gate. Monocyte/macrophage populations were distinguished by Ly6C and MHCII. FSC, forward scatter; SSC, side scatter. (B) Specificity of monoclonal antibodies against CX3CR1 (1:100 dilution) and CCR2 (1:20 dilution) were confirmed by staining blood samples isolated from Wt, Cx3cr1 KO (Cx3cr1gfp/gfp), Ccr2 KO (Ccr2rfp/rfp), and DKO (Ccr2rfp/rfpCx3cr1gfp/gfp) mice. A representative FACS plot is shown. CX3CR1 and CCR2 expression assessed by antibodies and GFP and RFP were analyzed under a CD45+CD11b+ gate. (C) Blood was collected from Wt mice on day 14 after NTN induction and analyzed by flow cytometry. Blood leukocytes were divided based on CD45+CD11b+ and CD45+CD11b gates and further stained for CX3CR1 and CCR2; monocyte markers Ly6C and CD115; and lineage-negative, CD11c, Ly6G, and CD3. Histogram plots (right) show that all CCR2+CX3CR1+ DP populations express Ly6C and CD115. None of the DP populations express CD11c, Ly6G, or CD3.
Figure 1.
Figure 1.
Renal accumulated monocytes in nephritic mice express macrophage markers and are DP for CCR2 and CX3CR1. Mice were either untreated (−) or subjected to NTN (+NTN) and analyzed on day 14. CD11b+ lineage-negative cells were evaluated for Ly6C and MHCII or Ly6C and F4/80 as indicated. The defined P1–P4 populations were further analyzed for CD64 or CCR2 and CX3CR1. (A) Representative FACS plots of four subsets of monocytes in the kidney of Wt mice defined by Ly6C and MHCII distinguishes four populations (P1–P4; left). The frequency and absolute counts of the Ly6C+MHCII+ (P2) population (right) are shown. (B) Populations P1–P4 defined in A were further analyzed for CD64. Representative FACS profiles (left), histogram representation (right upper) and frequency graph (right lower) of CD64 in P1–P4 populations are shown. SSC, side scatter. (C) Representative FACS plots of Ly6C and F4/80 in Ccr2rfp+/−Cx3cr1gfp+/− reporter mice. The frequencies and absolute counts of the Ly6C+F4/80+ (P2) population are shown. (D and E) Representative FACS profiles, frequencies, and absolute counts of Ly6C+MHCII+ (P2) cells in blood (D) and spleen (E). (F) Representative FACS plots for P1–P4 populations defined for Ly6C and MHCII in nephritic mice in A and further analyzed for CCR2 and CX3CR1. The frequency of renal subpopulations defined by CCR2 and CX3CR1 in Ly6C and MHCII parent P1–P4 populations (A, +NTN) and Ly6C and F4/80 parent P1–P4 populations (C, +NTN), are shown in grouped bar graphs. (G) Analysis of radiation chimeras of Wt recipients reconstituted with bone marrow from Ccr2rfp+/−Cx3cr1gfp+/− reporter mice with or without NTN induction. Representative profiles of Ly6C monocytes evaluated for F4/80 expression (left) and the frequencies and absolute counts of the P2 (Ly6C+F4/80+) populations (right) are given. In bottom panels, frequency of populations P1–P4 further analyzed for CCR2 and CX3CR1 (as shown in the representative FACs plot) are shown in a grouped bar graph. (H) Histological analysis of three monocyte populations in kidney sections of radiation chimeric Wt recipients reconstituted with Ccr2rfp+/−Cx3cr1gfp+/− bone marrow identified by CCR2rfp and CX3CR1gfp in the glomerulus, intratubular and renal interstitial compartment on days 7 and 14 after NTN induction. Representative image of monocytes in glomeruli (asterisks) and juxtaglomerular regions (white arrows) are shown. Scale bar = 50 μm. Cells expressing CCR2 (red), CX3CR1 (green), or both fluorophores (yellow) are indicated by arrowheads. Enlarged areas of the glomerulus, interstitium, and intratubular space are shown. The number of cells in each of these compartments was determined. Two independent experiments were performed for A–H. Data are mean ± SEM. For A–E, G, and H, unpaired two-tailed t test (two data sets comparison) and one-way ANOVA (Tukey’s multiple comparison test) were performed. *, P < 0.05; **, P < 0.01; ***, P < 0.005 vs. normal basal values.
Figure 2.
Figure 2.
Renal accumulated Ly6C+CCR2+CX3CR1+ monocytes exhibit an increase in intravascular dwell time within glomerular capillaries and have a proinflammatory transcriptional profile. (A–C) Radiation chimeric Wt and Tnfr2 KO recipient mice reconstituted with Ccr2rfp/+Cx3cr1gfp/+ (red signal, CCR2-rfp; green signal, CX3CR1-gfp) reporter bone marrow were analyzed on day 10 after NTN induction. (A) Two-photon IVM of glomeruli was undertaken, and images were acquired every 30 s for 20 min. The frequency of monocyte subpopulations among recruited cells, defined as a cell adherent for two frames (60 s) and a representative image of a glomerulus with cells positive for RFP (CCR2rfp), GFP (CX3CR1gfp), or both fluorophores (CCR2rfpCX3CR1gfp), is shown. Three to five mice per group and three to four glomeruli were imaged per mouse across six independent experiments. (B) Blood taken before (−) and after induction of NTN in Wt chimeras and after NTN in Tnfr2 KO chimeras were analyzed by flow cytometry. (C) The dwell time of individual monocytes within glomeruli analyzed in A is given. One-way ANOVA (Tukey’s multiple comparison test) was performed. *, P < 0.005; **, P < 0.0001. (D) FACS sorting strategy for isolating Ly6C+ monocytes expressing both CCR2 and CX3CR1 using lineage-negative markers to exclude T cells, dendritic cells, and NK cells and gating remaining cells for CD11b and Ly6C and then CCR2 and CX3CR1. CCR2 and CX3CR1 DP cells were collected. FSC, forward scatter; SSC, side scatter. (E) Haemopedia cell type fingerprint heatmap. Shown are the mean row-normalized log2 CPM values for the indicated gene sets, clustered by gene set for the renal DP population. (F) Heatmap of DEGs in renal DP cells vs. spleen DP cells. Shown are row-normalized log2 CPM values. (G) Top 20 GO terms enriched in the DEGs of E. Data are from three biological replicates, with each replicate containing sorted kidney and spleen/bone marrow cells from 10 mice.
Figure S2.
Figure S2.
NTN-induced monocyte recruitment per se is not affected, but proteinuria and histological evidence of renal injury are reduced in CCR2-deficient mice. (A) The number of CD11b+Ly6C+ and CD11b+Ly6C cells in the kidney and blood of Wt, Cx3cr1 KO, and Ccr2 KO mice 60 min after NTS injection (in the absence of priming with CFA). As CCR2 KO mice had a reduction in circulating blood monocytes, a ratio of monocytes in kidney vs. blood was calculated as an index of monocyte recruitment. (B) NTN was induced in Wt, Cx3cr1 KO, and Ccr2 KO mice and analyzed along with untreated Wt (−) animals. Representative FACS plots using Ly6C and MHCII to distinguish mononuclear populations P1–P4 and frequencies in each population are shown. (C) Proteinuria in radiation chimeras of Wt recipients reconstituted with Het (Ccr2rfp/+Cx3cr1gfp/+, n = 8), Cx3cr1 KO (Cx3cr1gfp/gfp, n = 8), Ccr2 KO (Ccr2rfp/rfp, n = 5), or DKO (Ccr2rfp/rfpCx3cr1gfp/gfp, n = 8) bone marrow on day 14 after NTN induction. Histological scores for glomerular, interstitial, and tubular injury in Het (n = 4), Cx3cr1 KO (n = 4), Ccr2 KO (n = 5), and DKO (n = 7) on day 14 after NTN induction. Two independent experiments were performed. *, P < 0.05, **, P < 0.01, ***, P < 0.005 (Tukey’s multiple comparison test).
Figure 3.
Figure 3.
Adoptively transferred Ly6C+CCR2+CX3CR1+ monocytes promote glomerular injury. (A) Schematic for adoptive transfer of cells and induction of NTN. Spleen/bone marrow monocytes were sorted from cohorts of Wt donor mice on day 13 after induction of NTN and injected at indicated days into Ccr2 and Cx3cr1 DKO recipient mice that had been immunized with CFA and NTS to induce NTN. Urine samples and both kidneys of DKO recipient mice were harvested on day 14 for analysis of proteinuria and histological scoring of GN. (B) Flow cytometry gating strategy for sorting CD45+, lineage-negative (CD3NKLy6GCD11c), CD11b+Ly6C+CX3CR1+CCR2+ DP (red box), and the remaining non-DP fractions (n-DP, blue box). FSC, forward scatter. (C) Proteinuria in Wt mice with (n = 5) and without (n = 4) NTN, DKO mice (n = 5), and recipient DKO mice transferred with DP (n = 8) or n-DP (n = 8) cells. Two independent experiments were performed. (D) Histological scores for endocapillary proliferation, capillary loop thickening, cellular crescents, and glomerular injury in Wt, DKO, and DKO + DP cells on day 14 after NTN induction. Representative histological images of periodic acid–Schiff-stained slides are shown. (i) A normal glomerulus with normal glomerular capillary loops (thickness) and normocellular without evidence of an active glomerulitis (i.e., endocapillary proliferation or cellular crescents). (ii) A glomerulus with global endocapillary proliferation, with inflammatory cells within the glomerular capillary loops indicated by arrowheads. (iii and iv) Glomeruli with severe glomerular capillary loop thickening (indicated with arrows) and extracapillary proliferation of cellular crescents (indicated with asterisks). Original magnifications for i, ii, and iv, 600×; for iii, 400×. Data are mean ± SEM. *, P < 0.05; **, P < 0.01.
Figure 4.
Figure 4.
CCR2 on hematopoietic lineages and TNFR2 on parenchymal cells are required for the generation of immature macrophages and kidney injury. (A) NTN was induced in mice heterozygous for CCR2 and CX3CR1 (Het), Cx3cr1 KO, Ccr2 KO, or lacking both receptors (DKO) and analyzed along with Het untreated animals (−). On day 14, Ly6C and F4/80 were examined on kidney samples to distinguish P1–P4 monocyte-macrophage populations. (B) NTN was induced in radiation chimeric Wt recipients reconstituted with heterozygous, Cx3cr1 KO, Ccr2 KO, or DKO bone marrow. Representative FACS plots for indicated chimeric mice subjected to NTN and the frequency and absolute counts of P1–P4 populations are shown. (C) NTN was induced in radiation chimeras of Wt or Tnfr2 KO recipients reconstituted with bone marrow heterozygous for CCR2 and CX3CR1 and analyzed as in A. FACS plots and frequencies and absolute counts of P1–P4 populations are shown. (D) Proteinuria evaluated in radiation chimeras examined in B (left) and C (right). Two independent experiments were performed. *, P < 0.05; **, P < 0.01; ***, P < 0.005 (Tukey’s multiple comparison test).
Figure 5.
Figure 5.
Monocytes acquire MHCII and F4/80 within the vasculature following NTN in a CCR2-dependent process. (A) On day 14 after induction of NTN in Wt mice, anti-CD45 was injected i.v. via the tail vein 3 min before harvesting blood, kidney, and lymph nodes to label intravascular cells. Single-cell suspensions of samples were further labeled ex vivo with antibodies to CD45 and monocyte and macrophage markers. Representative images of intravascular (i.e., αCD45 in vivo and ex vivo positive) and extravascular (i.e., αCD45 in vivo negative and ex vivo positive) cells are shown. In vivo–labeled CD45+, lineage-negative (CD3CD11cNK1.1Ly6G) cells further analyzed for Ly6C and MHCII defined four populations (P1–P4). The frequency of Ly6C+MHCII+ (P2) is shown in a scatter plot, and CX3CR1 and CCR2 frequency in P1–P4 populations is shown in a grouped bar graph. n = 4 mice. Significance was determined by two-tailed unpaired t test. (B) Schematic of timeline of adoptive transfer and induction of NTN for C–J. Ly6C+ monocytes purified from bone marrow of Wt and Ccr2 KO mice were labeled with CellTrace CFSE dye (AF488-green) and CellTrace violet dye (BV421-blue), respectively, and adoptively transferred into Wt mice, which were preimmunized with CFA plus rabbit IgG at −72 h and NTS at 0 h to induce NTN. Blood, kidney, spleen, and lymph nodes (LN) were harvested after 18 h. 3 min before harvest, mice were i.v. injected with anti-CD45. Harvested samples were stained ex vivo with indicated antibodies. (C) The frequencies of labeled Wt and Ccr2 KO monocytes in indicated organs of recipient Wt mice that were untreated (−) or subjected to NTN (+NTN) are shown. (D) Gating strategy for Wt and Ccr2 KO monocytes detected by CellTrace tracker dyes in whole-kidney homogenates from Wt recipients subjected to NTN. Cells assessed for in vivo CD45 labeling and then Ly6C and MHCII distinguished four populations (P1–P4) that were further analyzed for CCR2 and CX3CR1, for which representative profiles are only shown for P1 and P2, as they were the predominant populations. FSC, forward scatter. (E and F) Frequency of Ly6C+MHCII (P1), Ly6C+MHCII+ (P2), Ly6CMHCII+ (P3), and Ly6CMHCII (P4) for kidney (E) and blood (F) are shown. Frequency of CX3CR1 and CCR2 in P1–P4 populations are shown in grouped bar graphs. (G and H) Kidney (G) and blood (H) cells were also stained for Ly6C and F4/80 and analyzed as in E and F. (I and J) Frequency of Ly6C and MHCII (I) or F4/80 (J) extravascular populations, which are negative for the in vivo and positive for the ex vivo CD45 antibody, are shown. Two to three independent experiments were performed for all experiments. Data are expressed as mean ± SEM. Statistical significance was determined by one-way ANOVA with Dunnett’s t test correction. *, P < 0.05; **, P < 0.01; ***, P < 0.005.
Figure S3.
Figure S3.
Intravascular monocyte populations following lupus nephritis and acute NTN, analysis of isolated monocytes for adoptive transfer, analysis of renal intravascular monocyte accumulation in Tnfr KO, in vivo CD45 antibody controls, and effect of blocking adhesion on monocyte acquisition of MHCII and F4/80. (A and B) Intravascular monocyte populations were determined in NZB/W lupus-prone mice with accelerated nephritis (A) and Wt mice subjected to acute NTN (B) using approaches described in Fig. 5. (C) Left: Monocytes isolated from the bone marrow of Wt and Ccr2 KO mice were examined for Ly6C and MHCII. All cells were Ly6C+, and >95% were Ly6C+MHCII (P1) and <1.5% were Ly6C+MHCII+ (P2). Middle: The two Ly6C+ populations were further analyzed for CX3CR1 and CCR2. The majority of Ly6C+MHCII (P1) cells were CCR2+ and CX3CR1. Right: Monocytes from isolated bone marrow of Wt and Ccr2 KO were also examined for Ly6C and F4/80. All cells were Ly6C+: >95% were Ly6C+F4/80 and ≤0.5% were Ly6C+F4/80+. (D) Wt and TNFR2-deficient (Tnfr2 KO) mice subjected to NTN received CellTrace CFSE dye (AF488)–labeled Wt and CellTrace violet dye (BV421)–labeled Ccr2 KO monocytes i.v., and the frequencies of the labeled monocytes in blood and kidney were calculated. (E) Intravascular accumulation of leukocytes in lymph nodes and brain of mice subjected to acute NTN. Data are expressed as mean ± SEM. Statistical significance was determined by one-way ANOVA with Dunnett’s t test correction. (F) Monocytes treated with isotype (Iso.) or functional blocking antibody to CD18 (aCD18) or VLA-4 (aVLA-4) were incubated with endothelial cells or endothelial cells treated with TNF (EC + TNF). Adherent monocytes were evaluated for acquisition of MHCII (left) or F4/80 (right). *, P < 0.05; **, P < 0.01; ***, P < 0.005.
Figure 6.
Figure 6.
Neutrophil depletion attenuates the intravascular conversion of monocytes to immature macrophages. Mice were left untreated (−) or given the neutrophil-depleting antibody 1A8 before inducing NTN. 18 h after induction of NTN, anti-CD45 mAb was injected i.v. 3 min before harvesting the blood and kidney. Total neutrophil and monocyte counts (A and C) and the frequency and number of Ly6C+ monocytes expressing MHCII and/or F4/80 (B and D) in the blood (A and B) and kidney (C and D) are given. Data are from a single experiment with n = 5 individual mice per group. Statistical significance was determined by two-tailed Mann–Whitney U test. *, P < 0.05; **, P < 0.01; ***, P < 0.005.
Figure 7.
Figure 7.
Monocytes adherent to TNF-activated or TNFR2-transduced endothelial cells acquire macrophage markers. CellTrace CFSE dye (AF488)–labeled Wt and CellTrace violet dye (BV421)–labeled Ccr2 KO monocytes harvested from mice were incubated for 18 h in medium alone (media); with endothelial cells that were untreated (EC), stimulated with rat TNFα for 6 h and washed (EC + TNF), or transduced with control lentivirus (EC-Con); or with TNFR2 lentivirus (EC-TNFR2). Endothelial adherent and nonadherent (suspension) monocytes were harvested separately and processed for FACS analysis. (A) Flow cytometry gating strategy for detection of differentially labeled Wt and Ccr2 KO monocytes adherent to TNF-activated endothelial cells. Cells were gated for viability and stained for Ly6C and MHCII and the Ly6C+MHCII+ population was further analyzed for CCR2 and CX3CR1. (B and C) Analysis of adherent (B) and nonadherent (C) monocytes. Frequency of Ly6C+MHCII (left) and Ly6C+MHCII+ (middle), and CCR2 and CX3CR1 in the Ly6C+MHCII+ populations (right, only for CellTrace CFSE dye [AF488]–labeled Wt cells), are shown. (D) Adherent cells were analyzed for Ly6C and F4/80 and the frequency of Ly6C+F4/80 (left) and Ly6C+F4/80+ (right) in Wt and Ccr2 KO cells were determined as in B. (E) Analysis of Tnfr1, Ccl2, and Vcam1 message in endothelial cells treated as indicated by quantitative real-time PCR using the indicated gene-specific primers. The normalized fold-change vs. untreated cells (EC) or control virus (EC-Con) was calculated using the ΔΔCt method, with GAPDH as a control gene. Data are mean ± SEM. *, P < 0.05; **, P < 0.01; ***, P < 0.005. Four independent experiments were performed. Statistical significance was determined by multiple t test and one-way ANOVA with Dunnett’s t test correction.
Figure 8.
Figure 8.
scRNA-seq characterizes monocytes in contact with activated endothelial cells. (A) UMAP comprising five clusters of Wt and Ccr2 KO monocytes cultured on TNF-activated endothelial cells (EC) and medium alone containing Wt and Ccr2 KO monocytes (Wt/KO:Med) represented in our data set (n = 5,608 cells). (B) Heatmap of the top markers of identified clusters. The number of UMIs as the expression of markers is shown. Top markers are shown here, and all markers are shown in Fig. S4 B. (C) The expression of chemokines Ccl2, Ccl7, Ccl12, and Ccl6 across monocytes cultured on TNF-activated endothelial cells or medium alone. (D) Gene set enrichment in GO terms related to biological processes (GSEA-GO-Bp) for the genes overexpressed in Wt monocytes cultured with activated endothelial cells in comparison to monocytes cultured in medium, Ccr2 KO monocytes cultured with activated endothelial cells in comparison to monocytes cultured in medium alone, and Wt monocytes in comparison to Ccr2 KO monocytes cultured with activated endothelial cells. Top enriched terms are shown here, and all terms are shown in Fig. S4 C. OR, odds ratio. (E) Heatmap of cluster markers (left) which are overexpressed and underexpressed in nephritic kidney DP (Kid-DP) in comparison to spleen DP cells (Spl-DP; right). Top shared markers are shown here, and all shared markers are shown in Fig. S5 A. (F) GSEA-GO-Bp for those markers of Wt monocytes cultured with activated endothelial cells, which were overexpressed in Kid-DP in comparison to Spl-DP. Only top enriched terms are shown here, and all terms are shown in Fig. S5 B. (G) Number of the markers of Wt monocytes cultured on activated endothelial cells and monocytes cultured in medium alone having highest expression in three monocyte populations (mMono1-3) and monocyte-derived dendritic cell population (mMonoDC) from Zilionis et al. (2019). (H) GSEA-GO-Bp for those markers of Wt monocytes cultured with endothelial cells that had higher expression in mMono3 than mMono1, mMono2, and mDC populations in Zilionis et al. (2019). Only top enriched terms are shown here; all terms are shown in Fig. S5 C.
Figure S4.
Figure S4.
scRNA-seq characterizes monocytes in contact with TNF-activated endothelial cells. (A) UMAP showing the distribution of monocytes which are Wt and Ccr2 KO cultured with TNF-activated endothelial cells (EC) or medium (Med) alone (n = 5,608 cells in total). (B) Heatmap of all markers of identified monocyte clusters. The number of UMIs as the expression of markers is shown. (C) Gene set enrichment in GO terms related to biological processes (GSEA-GO-Bp) for the genes overexpressed in Wt monocytes cultured with activated endothelial cells in comparison to monocytes cultured in medium alone (Wt:EC vs. Wt:Med), Ccr2 KO monocytes cultured with endothelial cells in comparison to monocytes cultured in medium alone (Ccr2 KO:EC vs. Wt:Med), and Wt monocytes in comparison to Ccr2 KO monocytes cultured with activated endothelial cells (Wt:EC vs. Ccr2 KO:EC). OR, odds ratio.
Figure S5.
Figure S5.
Overlap and GO term enrichment of genes with CCR2+CX3CR1+ DP monocytes of the nephritic kidney and genes reported in tumor-associated monocytes. (A) Heatmap of cluster markers overexpressed in kidney DP cells (Kid DP) in comparison to spleen DP (Spl DP) cells plotted across clusters of Wt/KO Med, Ccr2 KO:EC, and Wt:EC. (B) GSEA-GO-Bp for those markers of Wt monocytes cultured on endothelium which were overexpressed in kidney in comparison to spleen DPs (Kid DP > Spl DP). OR, odds ratio. (C) GSEA-GO-Bp for those markers of Wt monocytes cultured with activated endothelial cells, which had higher expression in mMono3 than mMono1, mMono2, and mMonoDC populations identified in Zilionis et al. (2019).
Figure 9.
Figure 9.
MHCII+ monocytes are present in the urine of patients with active lupus nephritis, and their frequency correlates with disease activity. (A) Cumulative percentage of MHCIIhi cells within the CD14+CD163+ population in blood from healthy donors (HD) and patients with active lupus nephritis (LN; left) and lupus patients with high and low proteinuria (right). (B) Correlation of percentage of blood MHCII+ monocytes and disease index activity (SLEDAI). (C) Cumulative data and representative gating strategy showing the percentages of CD14+CD163+ cells within the live CD45+ cells (left panel) and MHCIIhi cells within the CD14+CD163+ population in urine from patients with active LN (right panel), separated based on the level of proteinuria (≥532 mg/24 h = high proteinuria). *, P < 0.05. FSC, forward scatter. (D) The correlation of percentage urine MHCIIhi monocytes and SLEDAI is shown.

References

    1. Al-Lamki, R.S., and Mayadas T.N.. 2015. TNF receptors: Signaling pathways and contribution to renal dysfunction. Kidney Int. 87:281–296. 10.1038/ki.2014.285 - DOI - PubMed
    1. Almaani, S., Meara A., and Rovin B.H.. 2017. Update on lupus nephritis. Clin. J. Am. Soc. Nephrol. 12:825–835. 10.2215/CJN.05780616 - DOI - PMC - PubMed
    1. Anderson, K.G., Mayer-Barber K., Sung H., Beura L., James B.R., Taylor J.J., Qunaj L., Griffith T.S., Vezys V., Barber D.L., and Masopust D.. 2014. Intravascular staining for discrimination of vascular and tissue leukocytes. Nat. Protoc. 9:209–222. 10.1038/nprot.2014.005 - DOI - PMC - PubMed
    1. Artinger, K., Kirsch A.H., Aringer I., Moschovaki-Filippidou F., Eller P., Rosenkranz A.R., and Eller K.. 2017. Innate and adaptive immunity in experimental glomerulonephritis: A pathfinder tale. Pediatr. Nephrol. 32:943–947. 10.1007/s00467-016s0043404-7 - DOI - PMC - PubMed
    1. Babaev, V.R., Runner R.P., Fan D., Ding L., Zhang Y., Tao H., Erbay E., Gorgun C.Z., Fazio S., Hotamisligil G.S., and Linton M.F.. 2011. Macrophage Mal1 deficiency suppresses atherosclerosis in low-density lipoprotein receptor-null mice by activating peroxisome proliferator-activated receptor-gamma-regulated genes. Arterioscler Thromb. Vasc. Biol. 31:1283–1290. 10.1161/ATVBAHA.111.225839 - DOI - PMC - PubMed

Publication types