. 2022 May 2;219(5):e20211631.
doi: 10.1084/jem.20211631. Epub 2022 Apr 11.

CCR2/CCR5 inhibitor permits the radiation-induced effector T cell infiltration in pancreatic adenocarcinoma

Affiliations

CCR2/CCR5 inhibitor permits the radiation-induced effector T cell infiltration in pancreatic adenocarcinoma

Jianxin Wang et al. J Exp Med. .

Abstract

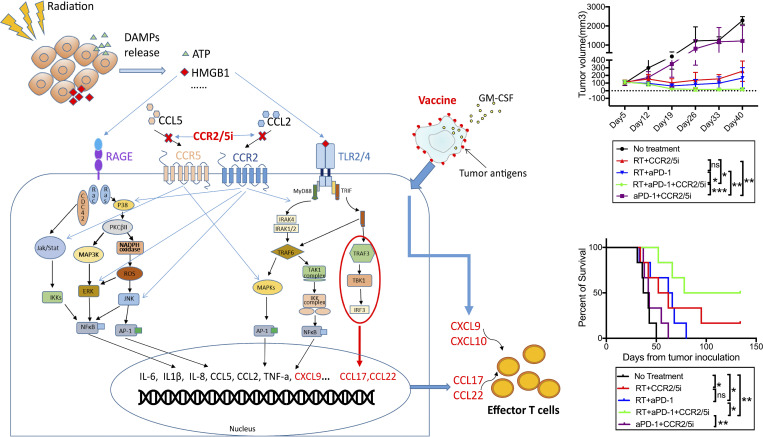
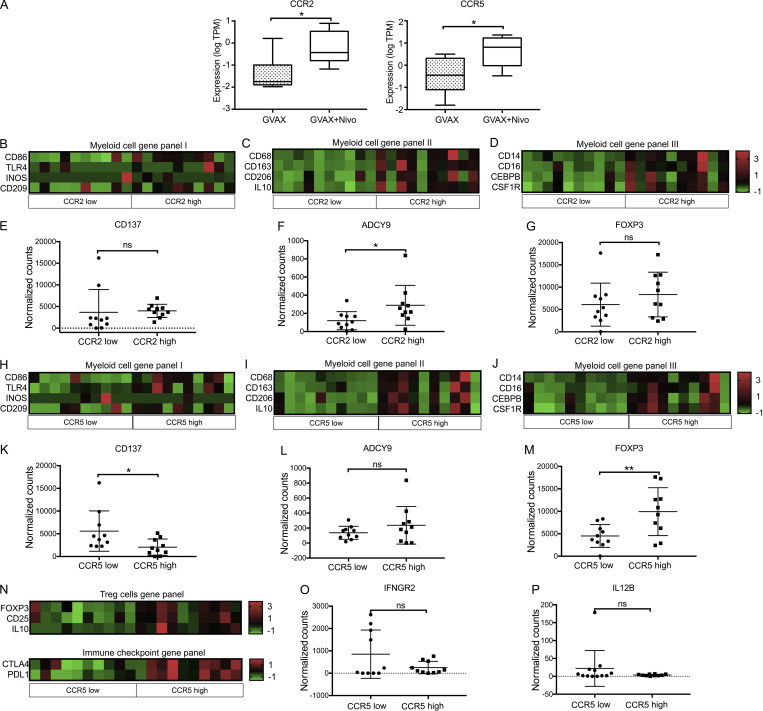
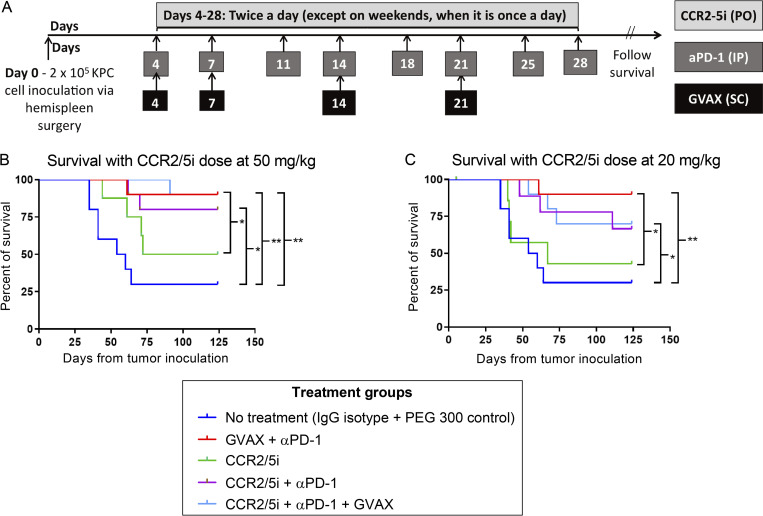
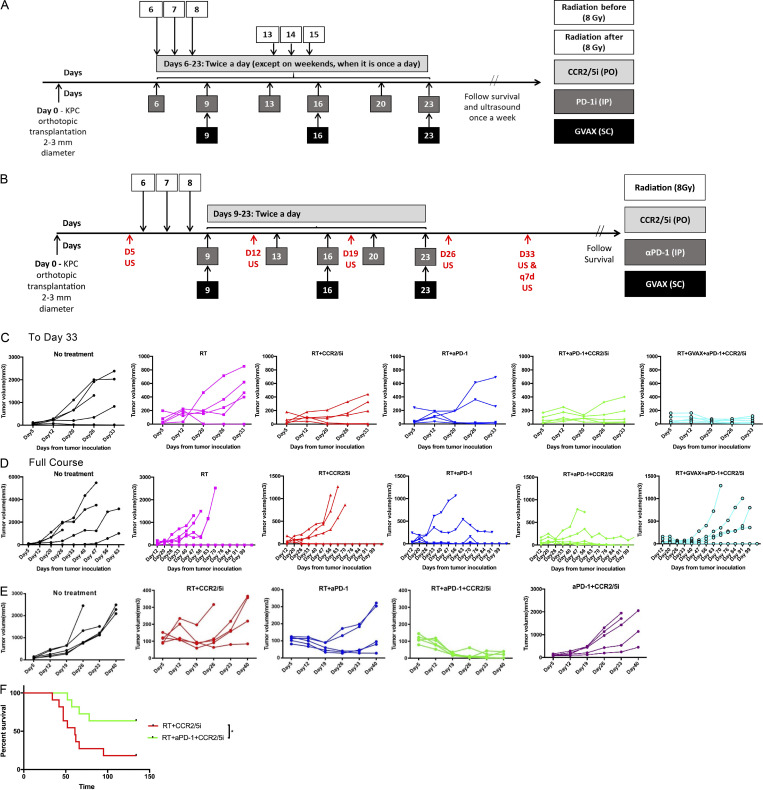
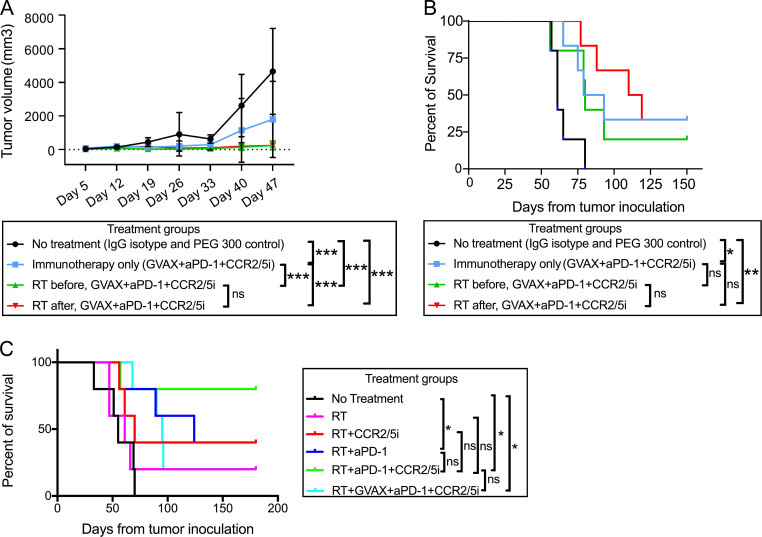
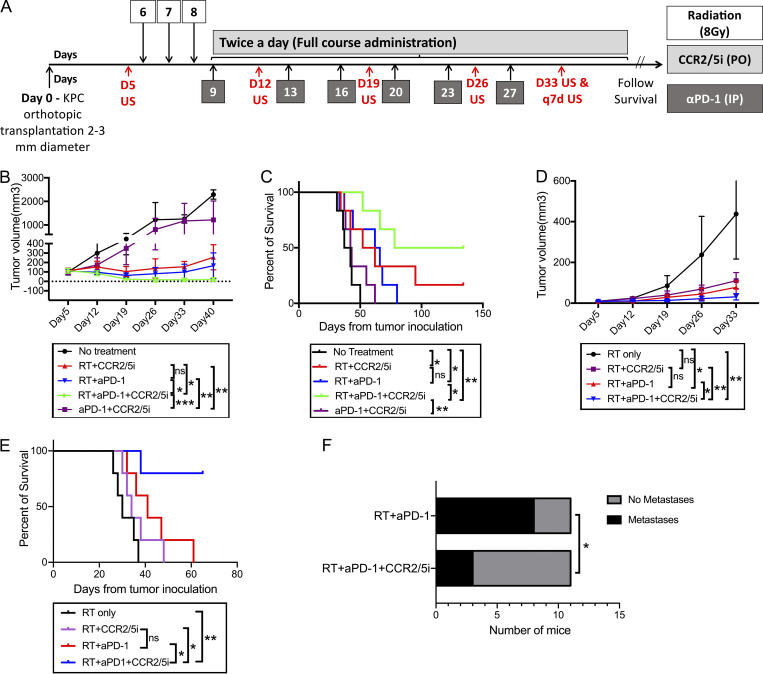
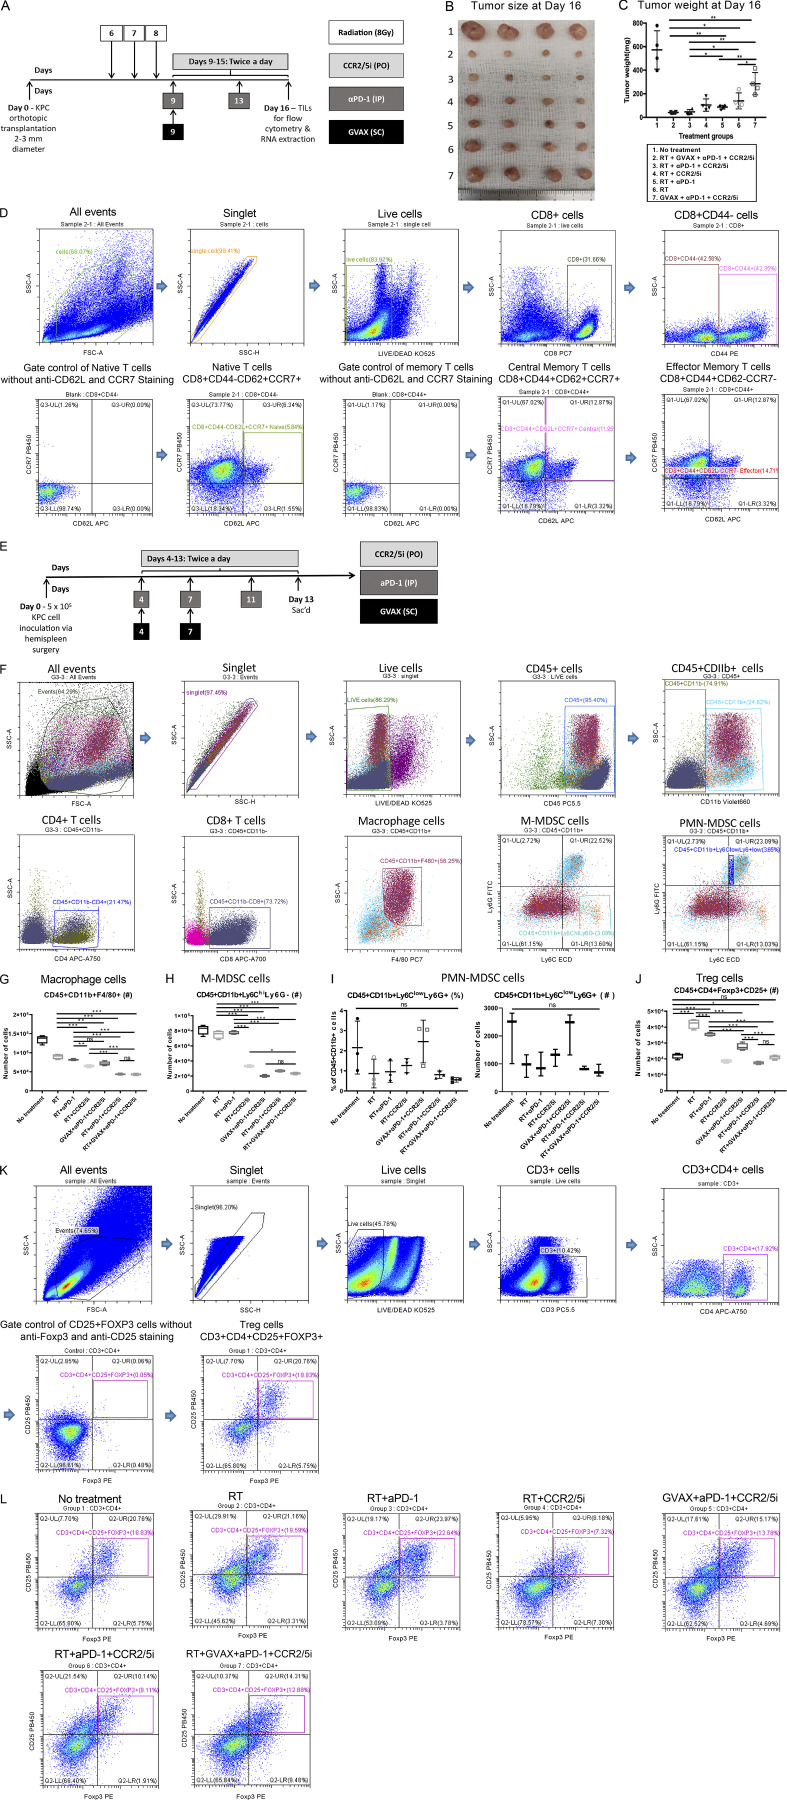
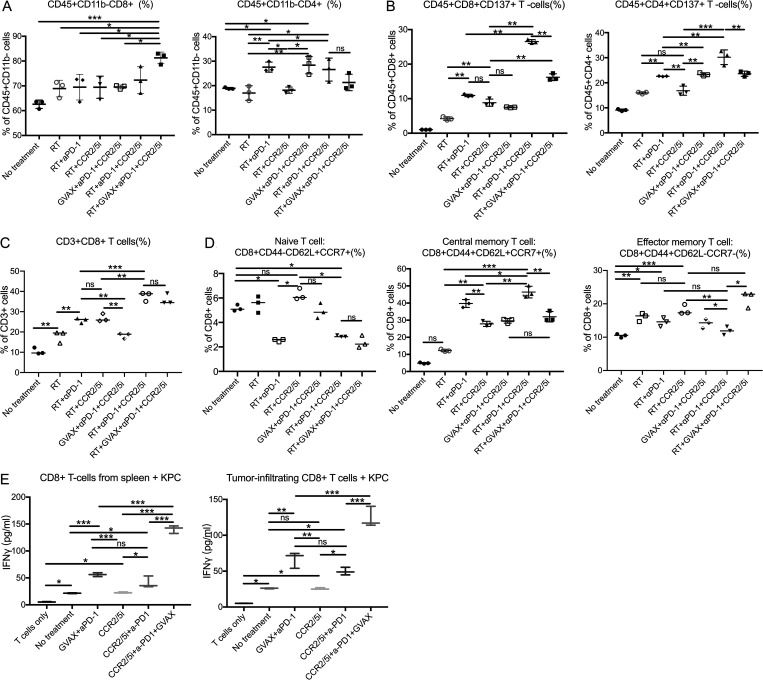
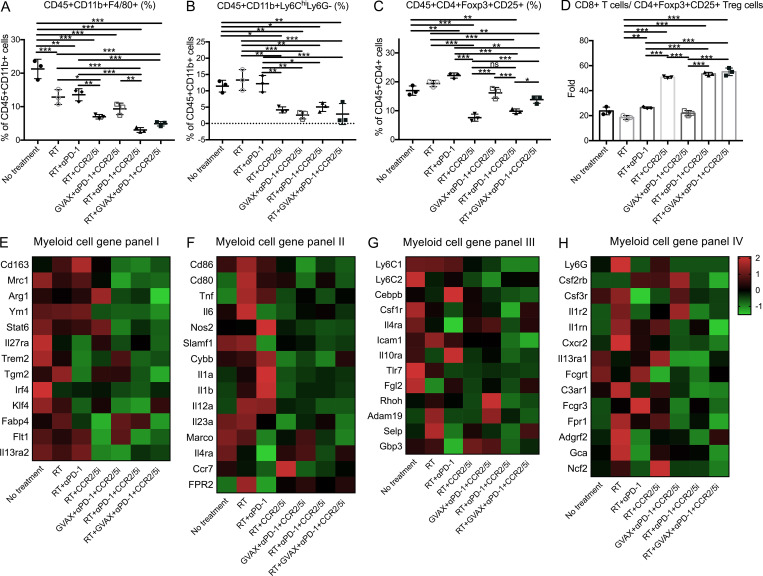
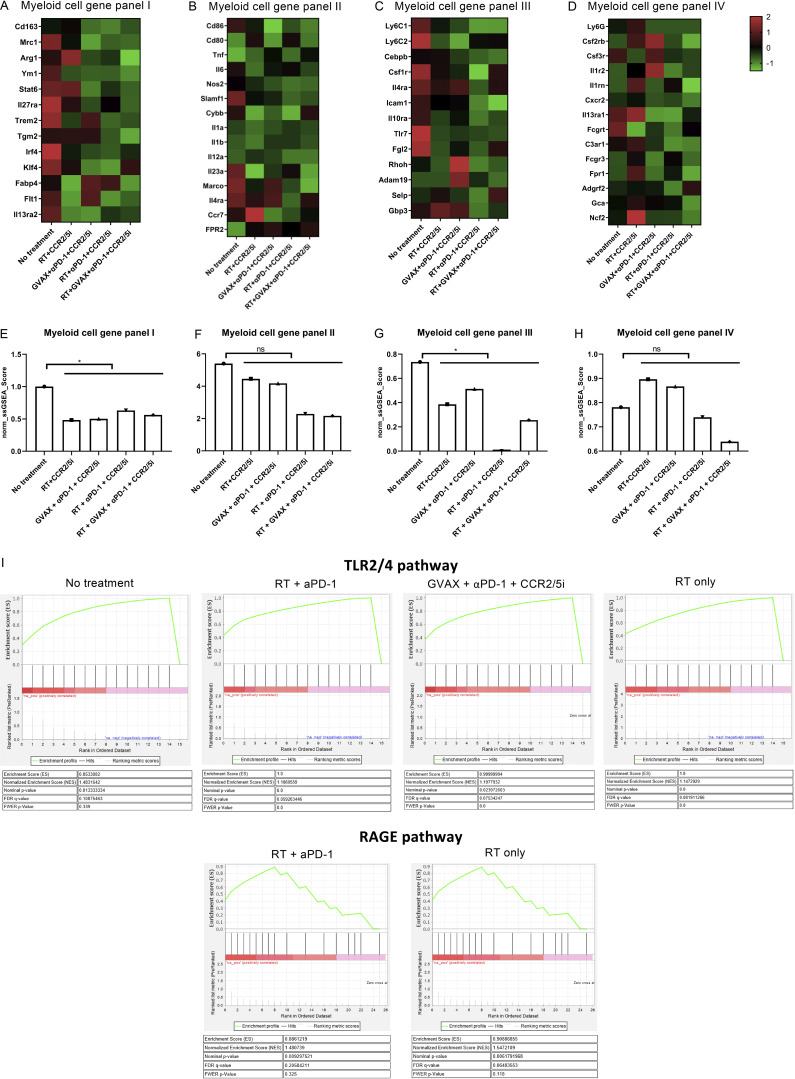
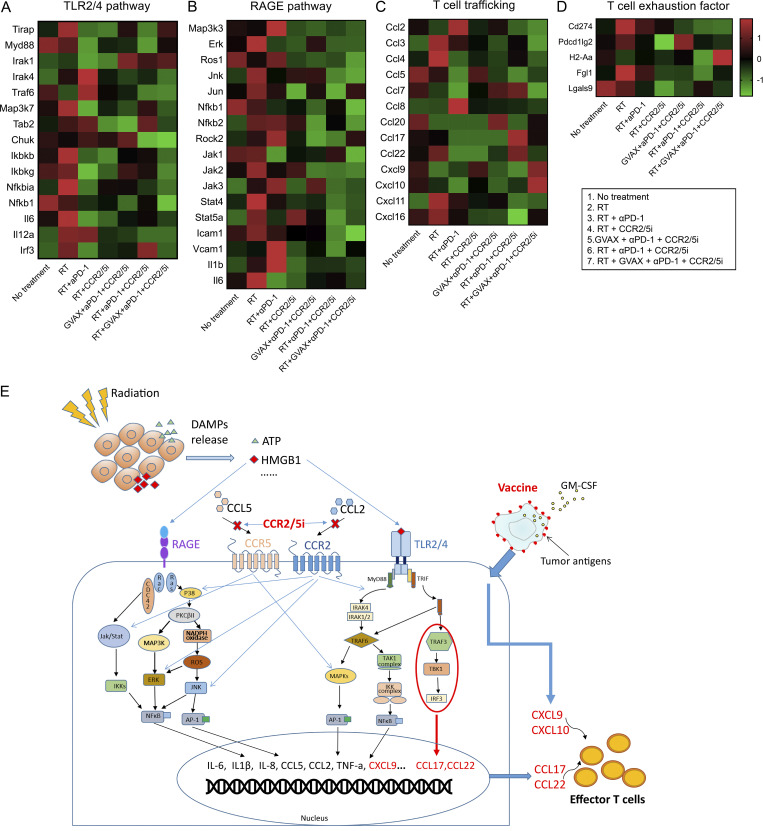
The resistance of pancreatic ductal adenocarcinoma (PDAC) to immune checkpoint inhibitors (ICIs) is attributed to the immune-quiescent and -suppressive tumor microenvironment (TME). We recently found that CCR2 and CCR5 were induced in PDAC following treatment with anti-PD-1 antibody (αPD-1); thus, we examined PDAC vaccine or radiation therapy (RT) as T cell priming mechanisms together with BMS-687681, a dual antagonist of CCR2 and CCR5 (CCR2/5i), in combination with αPD-1 as new treatment strategies. Using PDAC mouse models, we demonstrated that RT followed by αPD-1 and prolonged treatment with CCR2/5i conferred better antitumor efficacy than other combination treatments tested. The combination of RT + αPD-1 + CCR2/5i enhanced intratumoral effector and memory T cell infiltration but suppressed regulatory T cell, M2-like tumor-associated macrophage, and myeloid-derived suppressive cell infiltration. RNA sequencing showed that CCR2/5i partially inhibited RT-induced TLR2/4 and RAGE signaling, leading to decreased expression of immunosuppressive cytokines including CCL2/CCL5, but increased expression of effector T cell chemokines such as CCL17/CCL22. This study thus supports the clinical development of CCR2/5i in combination with RT and ICIs for PDAC treatment.


Conflict of interest statement

Disclosures: K. Fujiwara reported “other” from The Beacon Group, personal fees from Medcase, and grants from Japan Society for the Promotion of Science outside the submitted work. C. Twyman-Saint Victor reported personal fees from Bristol Myers Squibb during the conduct of the study and personal fees from Bristol Myers Squibb outside the submitted work. L. Zheng reported grants from Bristol-Myers Squibb, Merck, Astrazeneca, iTeos, Amgen, NovaRock, Inxmed, and Halozyme, and personal fees from Biosion, Alphamab, NovaRock, Ambrx, Xilio, QED, Natera, Tempus, Pfizer, Johnson and Johnson, Novagenesis, Snow Lake Capitals, BioArdis, and Mingruizhiyao during the conduct of the study. In addition, L. Zheng holds shares at Alphamab and Mingruizhiyao. No other disclosures were reported.

Figures

None
Graphical abstract
Figure 1.
Figure 1.
RNAseq of isolated immune cells from human PDAC tissue. Flow cytometry was used to sort CD4+, CD11b+, and CD8+ cells from immune cells isolated from PDAC resected from patients treated with GVAX or GVAX + nivolumab (nivo; n = 20). RNA was purified from sorted cell types, and RNAseq was performed. Normalized read count is shown. (A) Expression of CCR2 and CCR5 in sorted CD11b+ cells from PDACs belonging to the GVAX and GVAX + nivolumab treatment arms. The median expression level of CCR2 or CCR5 was used as the cutoff to divide the tumors into CCR2-low and CCR2-high subgroups or CCR5-low and CCR5-high subgroups. (B–G) For comparison between tumors with CCR2-low expression in CD11b+ cells vs. those with CCR2-high expression in CD11b+ cells, shown are heatmaps of gene expressions in CD11b+ cells of myeloid cell gene panel I, including the genes whose expression has been described in M1-like macrophages (B), myeloid cell gene panel II, including the genes whose expression has been described in M2-like macrophages (C), and myeloid cell gene panel III, including the genes whose expression has been described in MDSCs (D); shown are expression in CD8+ T cells of CD137 (E) and ADCY9 (F) and in CD4+ T cells of FOXP3 (G). (H–M) For comparison between tumors with CCR5-low expression in CD11b+ cells vs. those with CCR5-high expression in CD11b+ cells, shown are heatmaps of gene expressions in CD11b+ cells of myeloid cell gene panel I, including the genes whose expression has been described in M1-like macrophages (H), myeloid cell gene panel II, including the genes whose expression has been described in M2-like macrophages (I), and myeloid cell gene panel III including the genes whose expression has been described in MDSCs (J); shown are expression in CD8+ T cells of CD137 (K) and ADCY9 (L) and in CD4+ T cells of FOXP3 (M). (N–P) For comparison between tumors with CCR5-low expression in CD4+ T cells vs. those with CCR5-high expression in CD4+ T cells, shown are heatmaps of gene expressions in CD4+ T cells of Treg cell gene panel including the genes whose expression has been described in Tregs and immune checkpoint gene panel including CTLA-4 and PD-L1; shown are gene expression in CD8+ T cells of IFNGR2 (O) and IL12B (P). *, P < 0.05; **, P < 0.01, by unpaired t test.
Figure S1.
Figure S1.
Immunosuppressive cell infiltration was associated with CCR2 and CCR5 expression in human PDAC tissue. Flow cytometry was used to sort CD4+, CD11b+, and CD8+ cells from immune cells isolated from PDACs resected from patients treated with GVAX or GVAX + nivolumab (nivo; n = 20). RNA was purified from sorted cell types, and RNAseq was performed. Normalized read count is shown. The median expression level of CCR2 or CCR5 was used as the cutoff to divide the tumors into CCR2-low and CCR2-high subgroups or CCR5-low and CCR5-high subgroups. (A–D) Shown are comparisons of percentages of CD4+ T cells or CD8+ T cells among CD45+ cells (A and C) or total numbers of CD4+ T cells or CD8+ T cells on flow cytometry when these cells were sorted (B and D). The samples in A and B were subgrouped based on CCR2 or CCR5 expression in CD11b+ cells; those in C and D were subgrouped based on CCR5 expression in CD4+ T cells. (E) Volcano plot for differential gene expression in CD11b+ cells with high vs. low CCR2 expression. (F) Expression of M1 macrophage-associated genes (CD86, TLR4, iNOS, and CD209) in CD11b+ cells with high vs. low CCR2 expression is shown; these genes were not significantly changed in CD11b+ cells with high vs. low CCR2 expression according to the volcano plot in E. Expression of M2 macrophage-associated genes (CD68, CD163, CD206, and IL10) and MDSC-associated genes (CD14, CD16, CEBPB, and CSF1R) in CD11b+ cells with high vs. low CCR2 expression is shown; these genes were among those significantly upregulated in CD11b+ cells with high CCR2 expression according to the volcano plot in E. (G) Tumors were subgrouped by CCR2 expression levels in CD11b+ cells, and expression of selected genes in CCR2hi CD11b+ cells was compared to those in CCR2lo CD11b+ cells. (H) Volcano plot for differential gene expression in CD8+ T cells when tumors were subgrouped by the CCR2 expression levels in CD11b+ cells. (I) Expression of selected genes in CD8+ T cells was compared between tumors with CCR2hi CD11b+ cells vs. those with CCR2lo CD11b+ cells. Expression of CD137 and ADCY9 was also compared within the GVAX and GVAX + Nivo treatment groups, respectively. (J) Volcano plot for differential gene expression in CD4+ T cells when tumors were subgrouped by CCR2 expression levels on CD11b+ cells. (K) Expression of selected genes in CD4+ T cells was compared between tumors with CCR2hi CD11b+ cells vs. those with CCR2lo CD11b+ cells. Expression of Foxp3 was also compared within the GVAX and GVAX + Nivo treatment groups. (L) Volcano plot for differential gene expression in CD11b+ cells with high vs. low CCR5 expression. (M) Expression of M1 macrophage-associated genes (CD86, TLR4, iNOS, and CD209) in CD11b+ cells with high vs. low CCR5 expression is shown; these genes were not significantly changed in CD11b+ cells with high vs. low CCR5 expression according to the volcano plot in L. Expression of M2 macrophage-associated genes (CD68, CD163, CD206, and IL10) and MDSC-associated genes (CD14, CD16, CEBPB, and CSF1R) in CD11b+ cells with high vs. low CCR5 expression is shown; these genes were among those significantly upregulated in CD11b+ cells with high CCR5 expression according to the volcano plot in L. (N) Tumors were subgrouped by the CCR5 expression levels in CD11b+ cells, and expression of selected genes in CCR5hi CD11b+ cells was compared to those in CCR5lo CD11b+ cells. (O) Volcano plot for differential gene expression in CD8+ cells when tumors were subgrouped by CCR5 expression levels in CD11b+ cells. (P) Expression of selected genes in CD8+ T cells was compared between tumors with CCR5hi CD11b+ cells vs. those with CCR5lo CD11b+ cells. Expression of CD137 and ADCY9 was also compared within the GVAX and GVAX + Nivo treatment groups, respectively. (Q) Volcano plot for differential gene expression in CD4+ T cells when tumors were subgrouped by CCR5 expression levels on CD11b+ cells. (R) Expression of select genes in CD4+ T cells was compared between tumors with CCR5hi CD11b+ cells vs. those with CCR5lo CD11b+ cells. Expression of Foxp3 was also compared within the GVAX and GVAX + Nivo treatment groups. (S) Volcano plot for differential gene expression in CD4+ cells when tumors were subgrouped by CCR5 expression levels in CD4+ cells. (T) Expression of Treg cell markers (FOXP3, CD25, and IL10) and immune checkpoints (CTLA4 and PD-L1) in CD4+ T cells with high vs. low CCR5 expression is shown; these genes were among those significantly upregulated in CD4+ T cells with high CCR5 expression according to the Volcano plot in S. (U) Expression of selected genes in CD4+ T cells was compared between tumors with CCR5hi CD4+ T cells vs. those with CCR5lo CD4+ T cells. (V) Volcano plot for differential gene expression in CD8+ T cells when tumors were subgrouped by CCR5 expression levels in CD4+ T cells. (W) Expression of selected genes in CD8+ T cells was compared between tumors with CCR5hi CD4+ T cells vs. those with CCR5lo CD4+ T cells. Expression of IFNGR2 and IL12B was also compared within the GVAX and GVAX + Nivo treatment groups, respectively. *, P < 0.05; **, P < 0.01, by unpaired t test. (X–Z) Shown are the correlation analyses between numbers of tumors associated with overall survival (OS) >2 yr vs. OS <2 yr and subgroups based on CCR2 expression in CD11b+ cells (X), subgroups based on CCR5 expression in CD11b+ cells (Y), or subgroups based on CCR5 expression in CD4+ T cells (Z). χ2 test was used.
Figure S2.
Figure S2.
Adding GVAX to dual-antagonism of CCR2 and CCR5 in combination with αPD-1 does not significantly enhance survival in a murine PDAC model. To test the hypothesis that dual inhibition of CCR2 and CCR5 would enhance the antitumor activity of αPD-1 with or without the pancreatic cancer vaccine, GVAX, we used a syngeneic mouse model with diffuse liver metastases that were established by hemispleen injection of mouse KPC PDAC cells derived from KPC mice. Multiple preclinical studies of immunotherapy have used this mouse model because the TME in the liver resembles human PDACs, and the survival of the mice can be used to evaluate the antitumoral efficacy of the study treatments (Blair et al., 2019a; Blair et al., 2019b; Fujiwara et al., 2020; Kim et al., 2019; Soares et al., 2015a; Soares et al., 2015b). In this study, the mice with liver metastases were treated with a murine equivalent of GVAX, as previously described (Soares et al., 2015b), αPD-1, and a small-molecule dual antagonist of CCR2 and CCR5 (CCR2/5i, BMS-687681). BMS-687681 specifically binds to both CCR2 and CCR5 and subsequently inhibits the activation of CCR2/CCR5-mediated signal transduction pathways (Norman, 2011). (A) According to its pharmacodynamics (Norman, 2011), this CCR2/5i was tested at two different doses in this study. In this experiment, liver metastases were heterogeneous among the mice; thus, a small percentage of mice in the vehicle-treated control (no treatment) group remained alive at day 120 when the experiment was ended. (B and C) Single-agent CCR2/5i dosed at 20 mg/kg did not appear to confer any antitumor activity compared with the control group, whereas CCR2/5i dosed at 50 mg/kg as a single agent conferred modest antitumor activity. In addition, CCR2/5i dosed at 50 mg/kg did not result in any noticeable toxicity either as a single agent or in combination with other agents through the entirety of the study. Therefore, the 50 mg/kg dose of CCR2/5i was chosen for subsequent experiments. When CCR2/5i was combined with αPD-1, it significantly improved survival compared with the control group, but not significantly compared with CCR2/5i as a single agent. In this experiment, αPD-1 as a single agent was not examined, because this treatment had been tested multiple times in previously published studies and showed a single-agent activity as modest as that of CCR2/5i as a single agent (Muth et al., 2021; Soares et al., 2015b). Nevertheless, the combination of GVAX and αPD-1 showed significantly better antitumor activity than CCR2/5i as a single agent. However, adding CCR2/5i at 50 mg/kg to the combination of GVAX and αPD-1 did not lead to an improvement of survival (Fig. S2 B). The triple combination of αPD-1, CCR2/5i, and GVAX was only modestly better than the combination of αPD-1 and CCR2/5i, and this difference was not statistically significant, suggesting that GVAX may not be an adequate T cell priming agent in combination regimens that include both αPD-1 and CCR2/5i. (A) Schema of tumor implantation by the hemispleen procedure and treatment with GVAX, αPD-1, and CCR2/5i. Mice received 2 × 10⁵ KPC cells via the hemispleen procedure, followed by administration of GVAX on days 4, 7, 14, and 21. αPD-1 or IgG control (5 mg/kg) was administered by i.p. injection twice weekly for 4 wk. CCR2/5i (20 or 50 mg/kg) was administered by oral gavage twice a day starting on day 4 until day 28. Kaplan–Meier survival curves of mice treated with different combinations of GVAX, αPD-1, and CCR2/5i 20 mg/kg (B) or 50 mg/kg (C). Data for all figures represent results obtained from experiments with 10 mice per treatment group. *, P < 0.05; **, P < 0.01, by log-rank test.
Figure S3.
Figure S3.
The treatment schema and tumor growth curve in different treatment groups. (A) Schema of orthotopic tumor implantation in mice, followed by treatment with GVAX, αPD-1 (5 mg/kg), CCR2/5i (50 mg/kg), and RT (3 fractions of 8 Gy). Two different schedules of RT were used (n = 5 per group). Ultrasound was used to monitor tumor size. Results are shown in Fig. 2, A and B. (B) Schema of orthotopic tumor implantation in mice, followed by treatment with GVAX, αPD-1 (5 mg/kg), CCR2/5i (50 mg/kg), and RT (3 fractions of 8 Gy). RT was administered prior to initiation of immunotherapy. Ultrasound was used to monitor tumor size. Results are shown in Fig. 2 C and below (C and D). (C) Tumor growth curves of different treatment groups as measured by ultrasound until day 33 from tumor implantation. (D) Tumor growth curves of different treatment groups as measured by ultrasound until death of mice or completion of experiment. (E) Experimental schema shown in Fig. 3 A. CCR2/5i was dosed twice daily continuously until death of mice or completion of experiment; tumor growth curves of different treatment groups were measured by ultrasound until day 33 from tumor implantation (n = 5 per group). (F) Kaplan–Meier survival curves of mice treated with different combinations. Data for all figures represent results obtained from experiments with 11 mice per treatment group. This analysis combines the results from two repeated experiment arms described in Fig. 3 A. *, P < 0.05, by log-rank test.
Figure 2.
Figure 2.
The addition of RT further improved the antitumor activity of combination GVAX, αPD-1, and CCR2/5i therapy in a PDAC orthotopic mouse model. (A) Tumor size evaluated with ultrasound imaging until day 47. (B) Kaplan–Meier survival curves of mice treated with two different sequences of RT administration relative to treatment with combination immunotherapy (GVAX + αPD-1 + CCR2/5i). (C) Kaplan–Meier survival curves of mice treated with different combinations of RT, GVAX, αPD-1, and CCR2/5i. Data represent results obtained from experiments with five to six mice per treatment group; all experiments were repeated twice. RT vs. RT + αPD-1 + CCR2/5i, P = 0.08. *, P < 0.05; **, P < 0.01; ***, P < 0.001, by log-rank test.
Figure 3.
Figure 3.
The addition of CCR2/5i to RT and αPD-1 slowed the rate of tumor growth and prolonged survival in a PDAC orthotopic mouse model. (A) Treatment schema: On day 0, subcutaneous tumors formed by injecting the KPC tumor cells onto syngeneic wild-type C57Bl/6 mice ∼1–2 weeks before were dissected and divided into cubes of 2–3-mm diameter. One cube of tumor was immediately implanted orthotopically into the pancreas of each syngeneic wild-type C57Bl/6 mouse. After the surgery, mice were randomized into different treatment groups (six mice per group) as indicated. On day 5 (D5), pretreatment ultrasound was performed. Tumor-bearing mice were treated with RT (three fractions of 8 Gy daily on days 6–8), αPD-1, or IgG control (5 mg/kg i.p. twice weekly for 3 wk), and CCR2/5i (50 mg/kg by oral gavage twice a day continuously) on days indicated. Ultrasound was performed on days indicated. (B and C) Tumor size evaluated by ultrasound imaging until day 40 (B) and Kaplan–Meier survival curves in mice treated with different combinations of RT, αPD-1, and CCR2/5i (C). (D and E) The same experiment was repeated in the orthotopic mouse model with a different mouse PDAC cell line established from KPC mice. After tumor implantation, mice were randomized into four treatment groups (n = 5 per group) as indicated. Tumor size evaluated by ultrasound imaging until day 33 (D) and Kaplan–Meier survival curves in mice treated with different combinations of RT, αPD-1, and CCR2/5i (E). (F) Comparison of metastases between RT + aPD1 + CCR2/5i and RT + aPD1 groups combining the experiment in B and C and one repeated experiment (n = 5 per group), in total 11 mice per group. After the mice reached survival endpoint (day 140), at necropsy, numbers of mice with lung, liver, or peritoneal metastases were identified grossly and histologically. Surviving mice were free of tumors. χ2 test was used to examine the correlation between treatment groups and metastasis rates. In the experiment in D and E, when the mice reached survival endpoint (day 63), all four surviving mice in the RT + aPD1 + CCR2/5i group were free of tumors; and the remaining one in the group did not have metastasis; all mice in the RT + aPD1 group had liver metastasis. *, P < 0.05; **, P < 0.01; ***, P < 0.001, by log-rank test. All experiments were repeated at least twice.
Figure S4.
Figure S4.
CCR2/5 dual-antagonist in combination with RT and anti–PD-1 therapy enhanced the effector memory T cell infiltration and reversed the suppressive immune cell environment. (A) Treatment schema of mice (n = 4 per group). Mice underwent orthotopic implantation and were treated with different combinations of GVAX, CCR2/5i (50 mg/kg), αPD-1 (5 mg/kg), and RT (3 fractions of 8 Gy on days 6–8). (B and C) Tumors were harvested at day 16 from tumor implantation (B) and the tumors were weighed (C). (D) Flow cytometry gating strategy for identification of naive/central memory/effector memory T cells. First, side scatter height (SSC-H) and side scatter area (SSC-A) plots were used to exclude doublets. Dead cells were excluded by gating on cells negative for the viability marker Aqua Blue. The expression of CD44 was used to identify naive (CD8+CD44) and memory (CD8+CD44+) T cells. The naive T cells were defined as CD8+CD44CD62+CCR7+. The expression of CD62L and CCR7 was used to define central memory T cells (CD8+CD44+CD62+CCR7+) and effector memory T cells (CD8+CD44+CD62CCR7). (E) Treatment schema of mice (n = 4 per group). Syngeneic mice underwent hemispleen surgery were treated with different combinations of GVAX, CCR2/5i (50 mg/kg), and αPD-1 (5 mg/kg). The mice were sacrificed on day 13 from hemispleen surgery, and the livers were harvested for IFN-γ ELISA. (F) Mice underwent orthotopic surgery and were treated with different combinations of GVAX, CCR2/5i (50 mg/kg), and αPD-1 (5 mg/kg). Mice were sacrificed on day 16 from orthotopic tumor implantation, and flow cytometry analysis was performed on the isolated tumor-infiltrating immune cells. The flow cytometry gating strategy of different cell types is shown. (G) Number of macrophages (CD45+CD11b+F4/80+) on flow cytometry analysis of immune cells isolated from orthotopically implanted KPC tumor resected from mice following treatment. The number of isolated tumor-infiltrating immune cells was normalized to the tumor weight. (H) Number of M-MDSCs (CD45+CD11b+Ly6ChiLy6G) on flow cytometry analysis of immune cells isolated from orthotopically implanted KPC tumor resected from mice following treatments as indicated. (I) Percentage within the total myeloid CD45+CD11b+ population and number of PMN-MDSCs (CD45+CD11b+Ly6ClowLy6G+) on flow cytometry analysis. (J) Number of Treg cells (CD45+CD11bCD25+Foxp3+) on flow cytometry analysis of immune cells isolated from orthotopically implanted KPC tumor resected from mice following treatments as indicated. Data represent mean ± SEM from one representative experiment of four to five mice per treatment group, and the isolated immune cells from mice from the same treatment group were pooled and measured in triplicate. These experiments were repeated twice. *, P < 0.05; **, P < 0.01; ***, P < 0.001, by one-way ANOVA. (K) The flow cytometry gating strategy for Treg cells is shown. Lymphocytes were identified based on their forward- and side-scatter properties. Subsequently, singlet cells were gated; and dead cells were excluded by gating on cells negative for the viability marker Aqua Blue. CD3 and CD4 were used to identify T helper cells (CD3+CD4+) among the selected viable lymphocytes. Conventional Tregs were defined as CD4+ T cells coexpressing CD25 and FOXP3. (L) Shown are representative flow cytometry graphs of Treg cells (CD3+CD4+CD25+Foxp3+) in each treatment group as indicated.
Figure 4.
Figure 4.
CCR2/5 inhibitor in combination with RT and αPD-1 promoted T cell function in a PDAC orthotopic mouse model. (A–D) Flow cytometry was performed on isolated tumor-infiltrating immune cells from dissected orthotopic tumor on day 16 (data in A and B were from one experiment, and data in C and D were from a separate experiment; n = 5 per group). The number of isolated tumor-infiltrating immune cells was normalized to the tumor weight, and the following were analyzed: percentage of CD8+ and CD4+ cells among CD45+ cells (A), CD137+ cells among CD45+CD8+ and CD45+CD4+ T cells (B), CD8+ cells among CD3+ cells (C), and naive T cell (CD8+CD44CD62L+CCR7+), central memory T cells (CD8+CD44+CD62L+CCR7+), and effector memory T cells (CD8+CD44+CCR7CD62L) among CD8+ T cells (D). (E) CD8+ T cells were isolated and purified from the liver and spleen on day 13 after hemispleen injection of KPC cells into mice (n = 4 per group). ELISA assays were performed, using autologous irradiated KPC tumor cells as antigenic targets for CD8+ T cells isolated from the hepatic metastases and spleen. Data represent mean ± SEM from one representative experiment of four to five mice per treatment group, and the isolated CD8+ T cells from mice from the same treatment group were pooled and measured in triplicate. *, P < 0.05; **, P < 0.01; ***, P < 0.001, by one-way ANOVA.
Figure 5.
Figure 5.
CCR2/5 inhibitor in combination with RT and αPD-1 reverses the suppressive immune environment in a PDAC orthotopic mouse model. Flow cytometry was performed on isolated tumor-infiltrating immune cells from dissected orthotopic tumor on day 16. (A–D) The number of isolated tumor-infiltrating immune cells was normalized to the tumor weight (n = 4–5 per group). The following were analyzed: percentage of macrophages (CD45+CD11b+F4/80+) among CD45+CD11b+ cells (A), M-MDSCs (CD45+CD11b+Ly6ChiLy6G) among CD45+CD11b+ cells (B), Tregs (CD45+CD4+CD25+Foxp3+) among CD45+CD4+ cells (C), and ratio of CD8+ T cells/CD4+CD25+Foxp3+ Tregs (D). CD11b+ cells were isolated from tumors of mice in different treatment groups: (1) No treatment, (2) RT, (3) RT + αPD-1, (4) RT + CCR2/5i, (5) GVAX + αPD-1 + CCR2/5i, (6) RT + αPD-1 + CCR2/5i, and (7) RT + GVAX + αPD-1 + CCR2/5i. (E–H) RNA was purified, amplified, and sequenced. For RNAseq results (n = 5 per group), heatmaps were generated to visualize the expression of signature genes whose expression was described in M2-like (E) and M1-like (F) macrophages, M-MDSCs (G), and PMN-MDSCs (H), labeled as myeloid cell gene panels I, II, III, and IV, respectively. Data represent mean ± SEM from one representative experiment of four to five mice per treatment group. For flow cytometry, the isolated immune cells from tumors of mice in the same treatment group were pooled and measured in triplicate. *, P < 0.05; **, P < 0.01; ***, P < 0.001, by one-way ANOVA.
Figure S5.
Figure S5.
The enrichment analysis of differentially expressed genes among treatment groups. CD11b+ cells were isolated from mice using MACS sorting, RNA was purified, amplified, and sequenced. (A–H) Heatmaps were generated to visualize the expression of signature genes whose expression has been described in M2-like (A), M1-like macrophages (B), M-MDSCs (C), and PMN-MDSCs (D), respectively. These gene signatures in M2-like (E) and M1-like macrophages (F), and M-MDSC (G) and PMN-MDSC (H), labeled as myeloid cell gene panels I, II, III, and IV, respectively, were subjected to ssGSEA for enrichment analysis, and their expression levels (ssGSEA scores) were compared between untreated group and CCR2/5i-containing groups by t test. *, P < 0.05. (I) The differentially expressed genes in TLR2/4 and RAGE pathway were uploaded into GSEA for enrichment analysis. The h.all.v5.1.symbols.gmt [Hallmarks] gene sets database was used as the gene set collection for analysis. GSEA performed 1,000 permutations. Cutoff for significant gene sets was FDR < 25%.
Figure 6.
Figure 6.
Inhibition of CCR2 and CCR5 reverses radiation-induced TLR2/4 and RAGE signaling and permits the expression of effector T cell chemokines in αPD-1–treated pancreatic adenocarcinoma. (A–D) CD11b+ cells were isolated from mice (n = 5 per group) using MACS sorting; RNA was purified, pooled, amplified, and sequenced; and heatmaps were generated to visualize the expression of genes associated with TLR2/4 (A), RAGE (B), T cell trafficking (C), and T cell exhaustion (D) pathways. (E) A working model for the mechanism of action of CCR2/5 dual inhibition when combined with RT and other immunotherapies. Damage-associated molecular pattern (DAMP) signals such as HMGB1 are released in response to RT and subsequently activate RAGE and/or TLR2/4 pathways in TAMs. The activation of the downstream signaling pathways lead to the expression of immunosuppressive cytokines/chemokines including CCL2 and CCL5. Most of these downstream pathways will be further activated by binding of CCL2/CCL5 to CCR2/5. Adding CCR2/5i to RT inhibits these signals that are shared between CCR2, CCR5, TLR2/4, and RAGE pathways; however, it does not inhibit the TRAF3–TBK1–IRF3 axis. The TRAF3–TBK1–IRF3 axis remains to be upregulated and subsequently enhances the transcription of CCL17 and CCL22, two effector T cell trafficking factors, thus promoting T cell infiltration into the tumor. TRIF, TIR-domain-containing adapter-inducing interferon-β; IKK, IκB kinase.

Similar articles

Cited by

References

    1. Blair, A.B., Kim V.M., Muth S.T., Saung M.T., Lokker N., Blouw B., Armstrong T.D., Jaffee E.M., Tsujikawa T., Coussens L.M., et al. . 2019a. Dissecting the stromal signaling and regulation of myeloid cells and memory effector T cells in pancreatic cancer. Clin. Cancer Res. 25:5351–5363. 10.1158/1078-0432.CCR1078-018-4192 - DOI - PMC - PubMed
    1. Blair, A.B., Kleponis J., Thomas D.L. 2nd, Muth S.T., Murphy A.G., Kim V., and Zheng L.. 2019b. IDO1 inhibition potentiates vaccine-induced immunity against pancreatic adenocarcinoma. J. Clin. Invest. 129:1742–1755. 10.1172/JCI124077 - DOI - PMC - PubMed
    1. Bose, S., and Cho J.. 2013. Role of chemokine CCL2 and its receptor CCR2 in neurodegenerative diseases. Arch Pharm. Res. 36:1039–1050. 10.1007/s12272-013s1220161-z - DOI - PubMed
    1. Demaria, S., Golden E.B., and Formenti S.C.. 2015. Role of local radiation therapy in cancer immunotherapy. JAMA Oncol. 1:1325–1332. 10.1001/jamaoncol.2015.2756 - DOI - PubMed
    1. Five Prime Therapeutics, Inc. 2020. Five Prime Therapeutics Provides Update on Phase 2 Trial of Cabiralizumab Combined with Opdivo® in Pancreatic Cancer. News release, February 18, 2020. Available at: https://www.businesswire.com/news/home/20200218005144/en/Five-Prime-Ther....

Publication types

MeSH terms