. 2022 Jun;76(6):1260-1286.
doi: 10.1111/evo.14488. Epub 2022 Apr 26.

True seals achieved global distribution by breaking Bergmann's rule

Affiliations

True seals achieved global distribution by breaking Bergmann's rule

James P Rule et al. Evolution. 2022 Jun.

Abstract

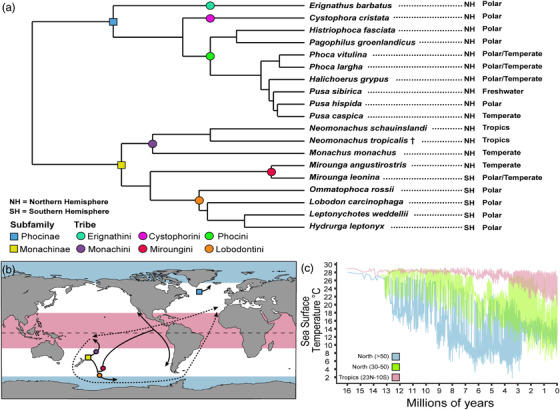
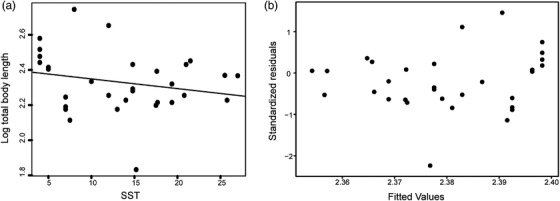
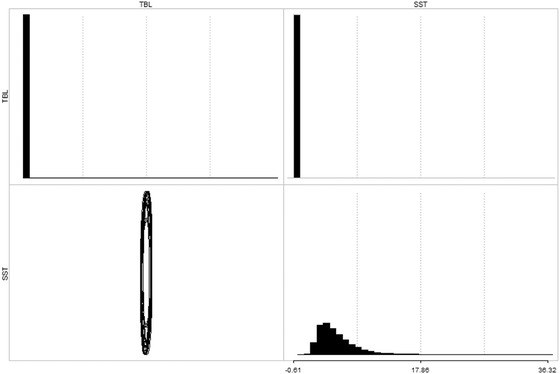
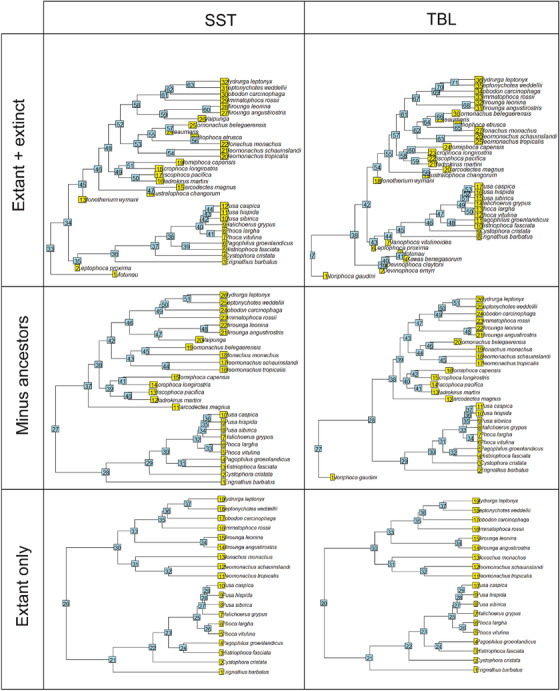
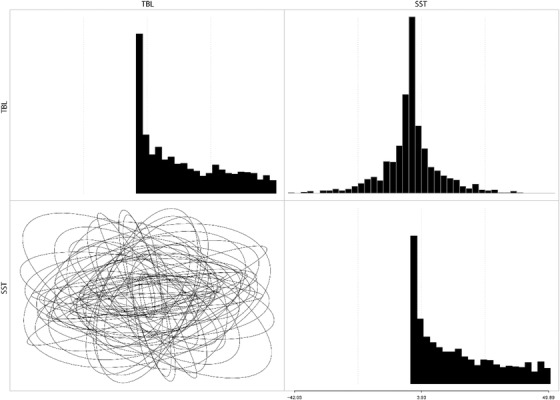
True seals (phocids) have achieved a global distribution by crossing the equator multiple times in their evolutionary history. This is remarkable, as warm tropical waters are regarded as a barrier to marine mammal dispersal and-following Bergmann's rule-may have limited crossings to small-bodied species only. Here, we show that ancestral phocids were medium sized and did not obviously follow Bergmann's rule. Instead, they ranged across a broad spectrum of environmental temperatures, without undergoing shifts in temperature- or size-related evolutionary rates following dispersals across the equator. We conclude that the tropics have not constrained phocid biogeography.

Keywords: Antitropical distribution; Bergmann's rule; Phocidae; biogeography; body size; sea surface temperature.


Conflict of interest statement

The authors declare no conflict of interest.

Figures

Figure 1
Figure 1
Biogeography of crown Phocidae. (a) Phylogeny of extant true seals (Rule et al. 2021b) with geographic distributions. (b) Dispersals for crown‐phocids (modified from Rule et al. 2020a), with the tropics in light red and polar environments in light blue. (c) Variation of Sea Surface Temperature by latitude through time (Herbert et al. 2016), demonstrating consistently high temperatures in the tropics, and broader Sea Surface Temperatures across latitudes closer to the present.
Figure 2
Figure 2
Evolution of body size in extant true seals estimated by RRphylo analysis, using phylogeny from Rule et al. (2021b). (a) Ancestral state estimation and (b) evolutionary rates for Log10 minimum total body length. (c) Ancestral state estimation and (d) evolutionary rates for Log10 maximum total body length. Timescales in millions of years.
Figure 3
Figure 3
Evolution of sea surface temperature (SST) in extant true seals estimated by RRphylo analysis, using phylogeny from Rule et al. (2021b). Ancestral state estimation (a) and evolutionary rates (b) for minimum SST. Ancestral state estimation (c) and evolutionary rates (d) for median SST. Ancestral state estimation (e) and evolutionary rates (f) for maximum SST. Timescales in millions of years.
Figure 4
Figure 4
Evolution of body size and SST in extant and extinct true seals estimated by RRphylo analysis, using phylogeny from Rule et al. (2021b). Ancestral state estimation (a) and evolutionary rates (b) for log10 total body length. Ancestral state estimation (c) and evolutionary rates (d) for median SST. Timescales in millions of years.
Figure 5
Figure 5
Regression analyses for log total body length and median SST in extant and extinct true seals. (a) Linear regression of log10 total body length versus median SST (adjusted R 2 = 0.017, P‐value = 0.226). (b) Phylogenetic generalized least squares regression for log10 total body length versus median SST (P‐value = 0.753).
Figure 6
Figure 6
Posterior distribution of the evolutionary rate matrices for the merged MCMC chains. Histograms show the posterior distribution of evolutionary rate variance values for log10 total body length (TBL, top left) and sea surface temperature (SST, bottom right); and pairwise evolutionary covariance values between log total body length and sea surface temperature (top right). Ellipses (bottom left) are 50 bivariate distributions randomly sampled from the posterior distribution. The vertical orientation of the ellipses demonstrates that there is no evolutionary correlation between log10 total body length and sea surface temperature. The elongated shape of the ellipses demonstrates that log10 total body length has faster evolutionary rates than sea surface temperature.
Figure A1
Figure A1
Clade numbers for overfitRR analysis of all datasets in Table A7.
Figure A2
Figure A2
Log‐likelihood trace plot and acceptance ratio of first evolutionary rate matrix MCMC chain. MCMC chain ran for 1 million generations, with the first 25% discarded as burnin and sampling every 1000 generations. Acceptance ratio for the MCMC chain was ∼0.41 (correlation = 0.62; standard deviation = 0.15; root = 0.93).
Figure A3
Figure A3
The prior distribution of the first evolutionary rate matrix MCMC chain.
Figure A4
Figure A4
Log‐likelihood trace plot and acceptance ratio of the second evolutionary rate matrix MCMC chain. MCMC chain ran for 1 million generations, with the first 25% discarded as burnin and sampling every 1000 generations. Acceptance ratio for the MCMC chain was ∼0.41 (correlation = 0.62; standard deviation = 0.15; root = 0.93).
Figure A5
Figure A5
The prior distribution of the second evolutionary rate matrix MCMC chain.
Figure A6
Figure A6
Histogram of the posterior distribution of evolutionary correlation among log total body length and sea surface temperature, extracted from the two merged MCMC chains. Minimum = −0.68; 1st quartile = −0.03; Median = 0.09; Mean = 0.09; 3rd quartile = 0.21; Maximum = 0.79.
Figure A7
Figure A7
Posterior distribution of root values for log total body length (TBL) and sea surface temperature (SST) sampled from the merged MCMC chains.

References

    1. Adamczak, S.K. , Pabst, D.A. , McLellan, W.A. & Thorne, L.H. (2020) Do bigger bodies require bigger radiators? Insights into thermal ecology from closely related marine mammal species and implications for ecogeographic rules. J. Biogeogr., 47, 1193–1206.
    1. Amiot, R. , Göhlich, U.B. , Lecuyer, C. , De Muizon, C. , Cappetta, H. , Fourel, F. , Héran, M.‐A. & Martineau, F. (2008) Oxygen isotope compositions of phosphate from Middle Miocene–Early Pliocene marine vertebrates of Peru. Palaeogeogr. Palaeoclimatol. Palaeoecol., 264, 85–92.
    1. Amson, E. & Muizon, C.D. (2014) A new durophagous phocid (Mammalia: Carnivora) from the late Neogene of Peru and considerations on monachine seals phylogeny. Journal of Systematic Palaeontology, 12, 523‐548.
    1. Andersen, M. , Hjelset, A. , Gjertz, I. , Lydersen, C. & Gulliksen, B. (1999) Growth, age at sexual maturity and condition in bearded seals (Erignathus barbatus) from Svalbard, Norway. Polar Biol., 21, 179–185.
    1. Avery, G. & Klein, R.G. (2011) Review of fossil phocid and otariid seals from the southern and western coasts of South Africa. Trans. R. Soc. S. Afr., 66, 14–24.

Publication types