. 2022 May:79:103983.
doi: 10.1016/j.ebiom.2022.103983. Epub 2022 Apr 8.

Lab-in-a-van: Rapid SARS-CoV-2 testing response with a mobile laboratory

Affiliations

Lab-in-a-van: Rapid SARS-CoV-2 testing response with a mobile laboratory

Susan A Ballard et al. EBioMedicine. 2022 May.

Abstract

Background: High testing rates and rapid contact tracing have been key interventions to control COVID-19 in Victoria, Australia. A mobile laboratory (LabVan), for rapid SARS-CoV-2 diagnostics, was deployed at sites deemed critical by the Victorian State Department of Health as part of the response. We describe the process of design, implementation, and performance benchmarked against a central reference laboratory.

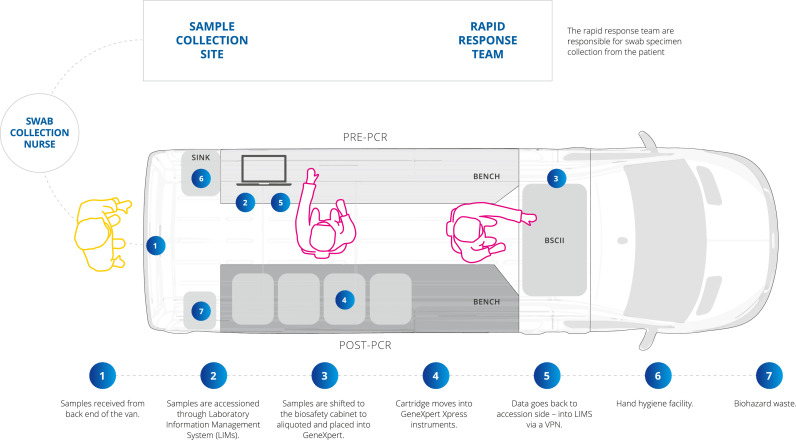
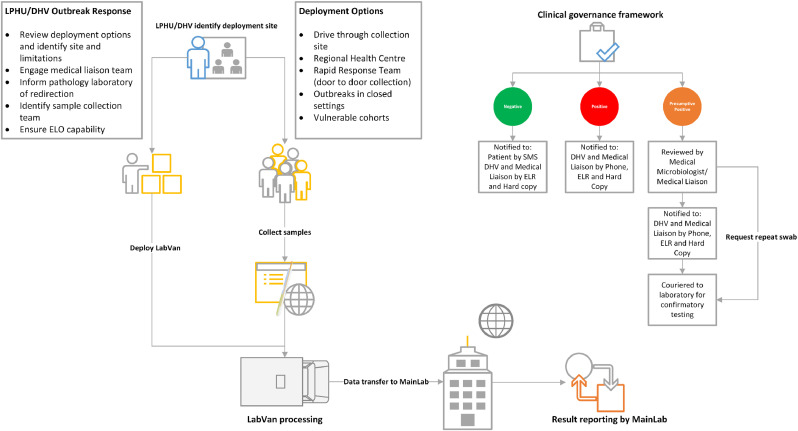
Methods: A BSL2 compliant laboratory, complete with a class II biological safety cabinet, was built within a Mercedes-Benz Sprinter Panel Van. Swabs were collected by on-site collection teams, registered using mobile internet-enabled tablets and tested using the Xpert® Xpress SARS-CoV-2 assay. Results were reported remotely via HL7 messaging to Public Health Units. Patients with negative results were automatically notified by mobile telephone text messaging (SMS).

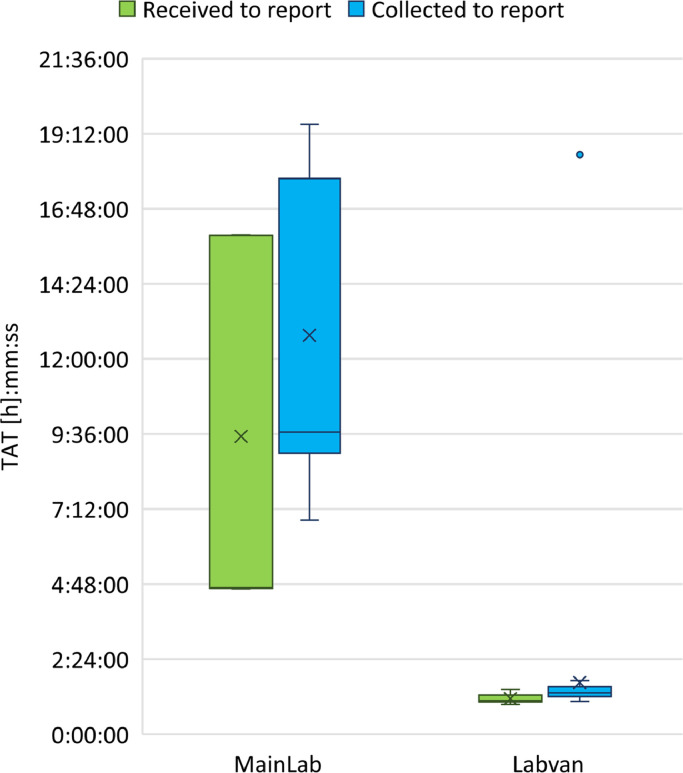
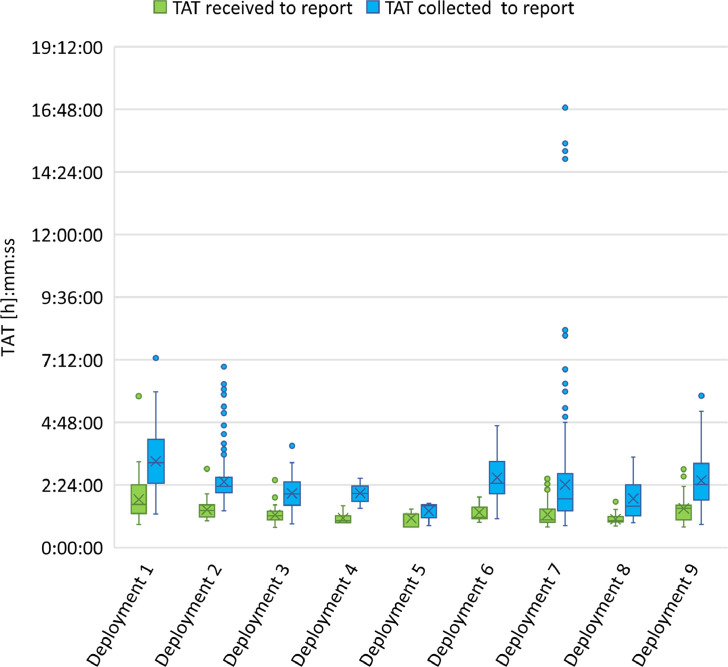
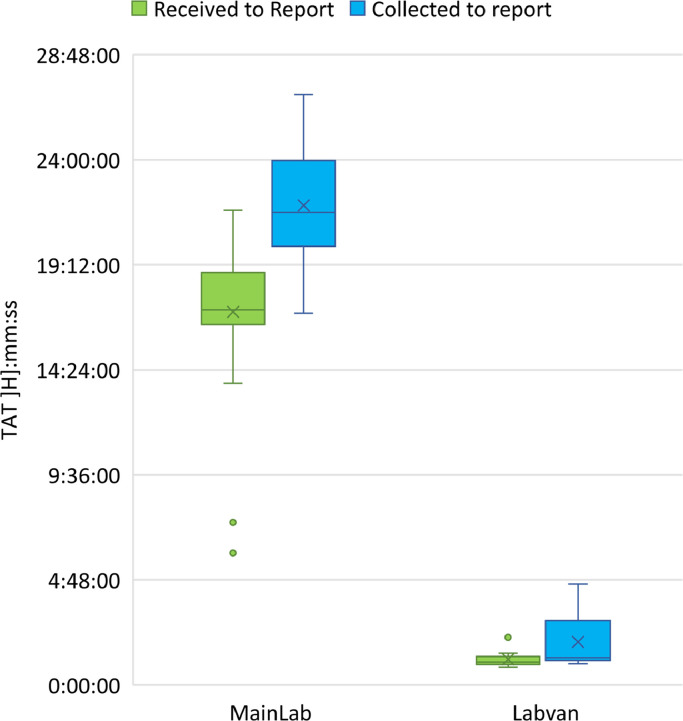
Findings: A pilot trial of the LabVan identified a median turnaround time (TAT) from collection to reporting of 1:19 h:mm (IQR 0:18, Range 1:03-18:32) compared to 9:40 h:mm (IQR 8:46, Range 6:51-19:30) for standard processing within the central laboratory. During deployment in nine rural and urban COVID-19 outbreaks the median TAT was 2:18 h:mm (IQR 1:18, Range 0:50-16:52) compared to 19:08 h:mm (IQR 5:49, Range 1:36-58:52) for samples submitted to the central laboratory. No quality control issues were identified in the LabVan.

Interpretation: The LabVan is an ISO15189 compliant testing facility fully operationalized for mobile point-of-care testing that significantly reduces TAT for result reporting, facilitating rapid public health actions.

Funding: This work was supported by the Department of Health, Victoria State Government, Australia.

Keywords: Mobile testing; Point-of-care; Rapid testing; Real-time PCR; SARS-CoV-2; Turnaround-time.


Conflict of interest statement

Declaration of interests AM and SY are employees of Department of Health, Victoria State Government and were involved with funding acquisition, project administration, resources for sample collection, manuscript drafting and revisions. They declare there is no conflict of interest. All remaining authors declare there are no conflicts of interest.

Figures

Figure1
Figure 1
Sample collection and LabVan workflow.
Figure2
Figure 2
Mobile laboratory outbreak response. LPHU, Local Public Health Unit; DHV, Department of Health, Victoria; ELO, Electronic test order; ELR, Electronic laboratory report.
Figure3
Figure 3
Box plot of turnaround time for sample testing in the pilot trial comparing samples tested in the laboratory with those tested in the LabVan. Boxes extend from the 25th to the 75th percentile, and within each box, horizontal lines denote the median and the cross (X) denotes the mean. The whiskers mark the upper and lower bounds that are 1.5 times the interquartile range (IQR); values beyond these upper and lower bounds were considered outliers and are marked with coloured dots.
Figure4
Figure 4
Box plot of the comparison of TAT for sample processing at LabVan deployments. Boxes extend from the 25th to the 75th percentile, and within each box, horizontal lines denote the median and the cross (X) denotes the mean. The whiskers mark the upper and lower bounds that are 1.5 times the interquartile range (IQR); values beyond these upper and lower bounds were considered outliers and are marked with coloured dots.
Figure5
Figure 5
Box plot of the comparison of TAT for detection of SARS-CoV-2 positive samples in the LabVan compared to the main laboratory. Boxes extend from the 25th to the 75th percentile, and within each box, horizontal lines denote the median and the cross (X) denotes the mean. The whiskers mark the upper and lower bounds that are 1.5 times the interquartile range (IQR); values beyond these upper and lower bounds were considered outliers and are marked with coloured dots.

References

    1. Chang S.L., Harding N., Zachreson C., Cliff O.M., Prokopenko M. Modelling transmission and control of the COVID-19 pandemic in Australia. Nat Commun. 2020;11(5710) doi: 10.1038/s41467-020-19393-6. - DOI - PMC - PubMed
    1. Kretzschmar M.E., Rozhnova G., Bootsma M.C., van Boven M., van de Wijgert J.H., Bonten M.J. Impact of delays on effectiveness of contact tracing strategies for COVID-19: a modelling study. Lancet Public Health. 2020;5(8):e452–e459. - PMC - PubMed
    1. Mina M.J., Parker R., Larremore D.B. Rethinking COVID-19 test sensitivity - a strategy for containment. N Engl J Med. 2020;383:e120. doi: 10.1056/NEJMp2025631. - DOI - PubMed
    1. Larremore D.B., Wilder B., Lester E., et al. Test sensitivity is secondary to frequency and turnaround time for COVID-19 surveillance. Sci Adv. 2021;7:eabd5393. doi: 10.1126/sciadv.abd5393. 202. - DOI - PMC - PubMed
    1. Dinnes J., Deeks J.J., Berhane S., et al. Rapid, point-of-care antigen and molecular-based tests for diagnosis of SARS-CoV-2 infection. Cochrane Database Syst Rev. 2021;3(3) - PMC - PubMed