. 2022 Jun 1;21(6):859-870.
doi: 10.1158/1535-7163.MCT-21-0934.

A New Class of Selective ATM Inhibitors as Combination Partners of DNA Double-Strand Break Inducing Cancer Therapies

Affiliations

A New Class of Selective ATM Inhibitors as Combination Partners of DNA Double-Strand Break Inducing Cancer Therapies

Astrid Zimmermann et al. Mol Cancer Ther. .

Abstract

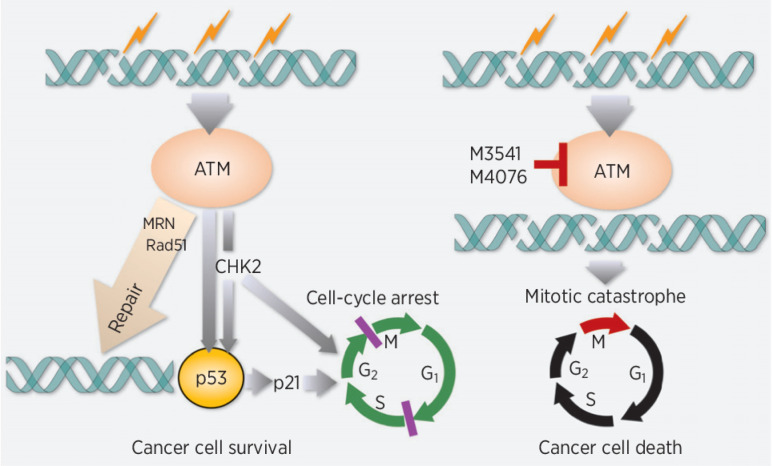
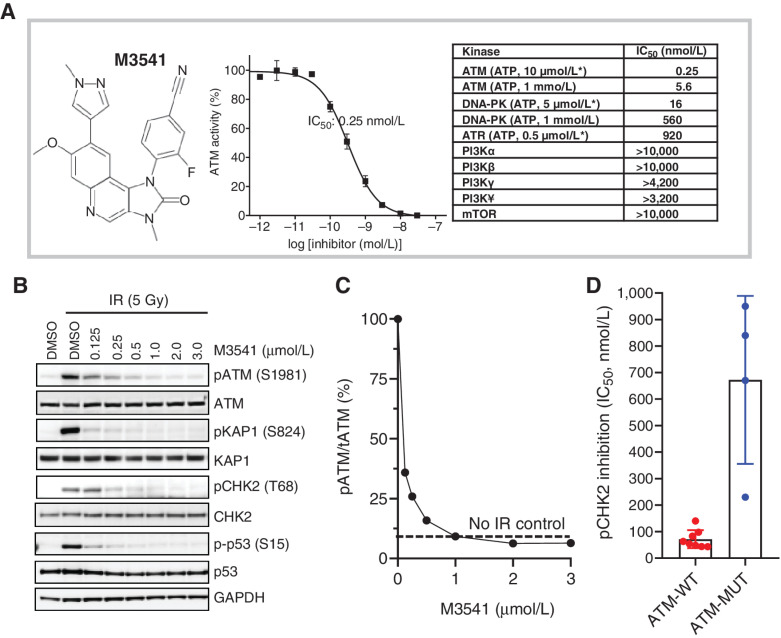
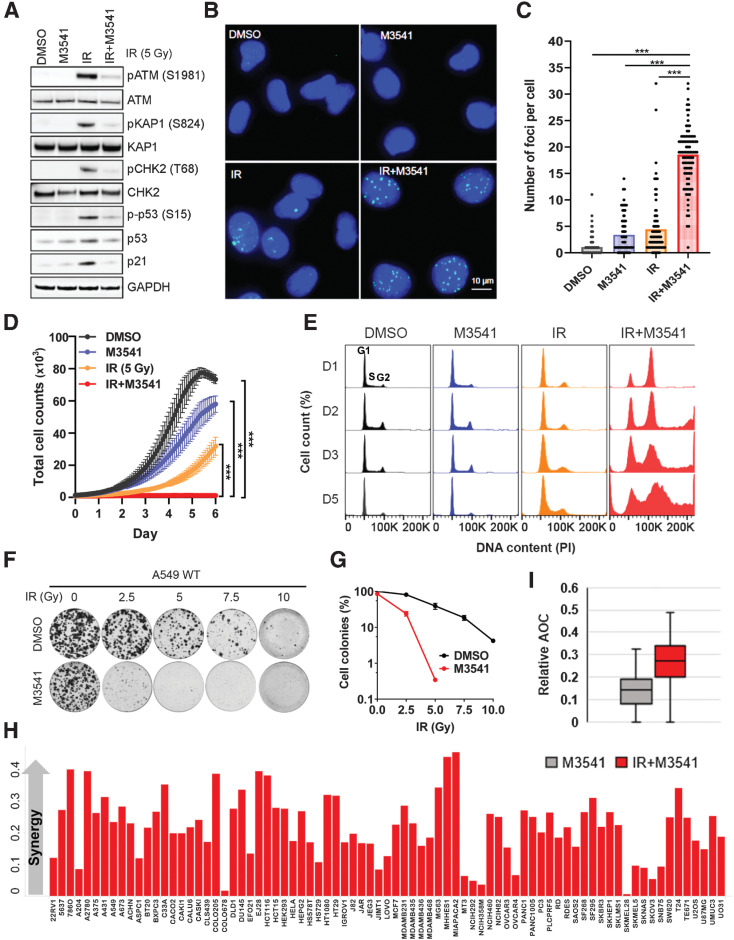
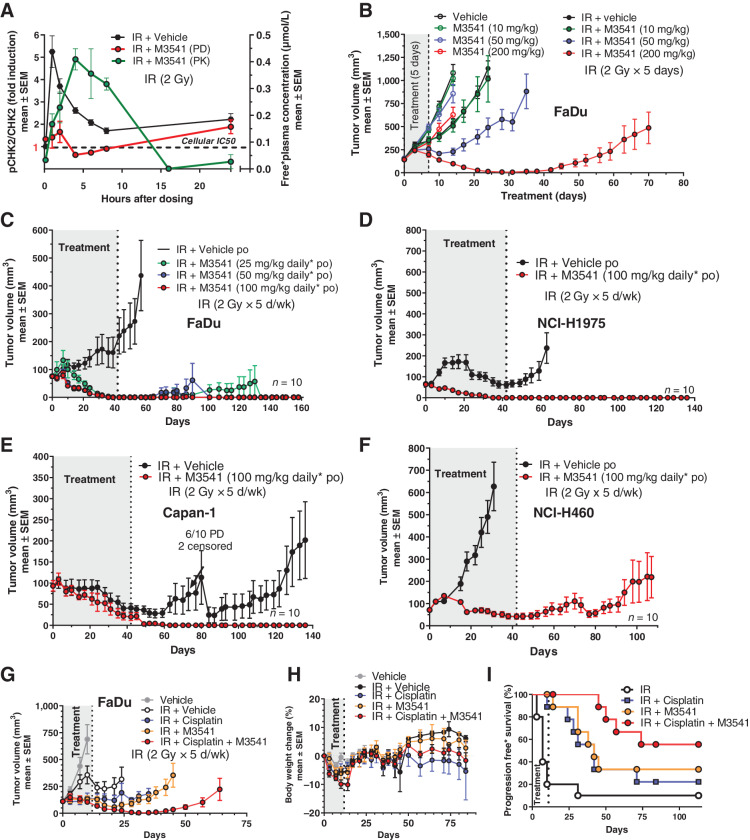
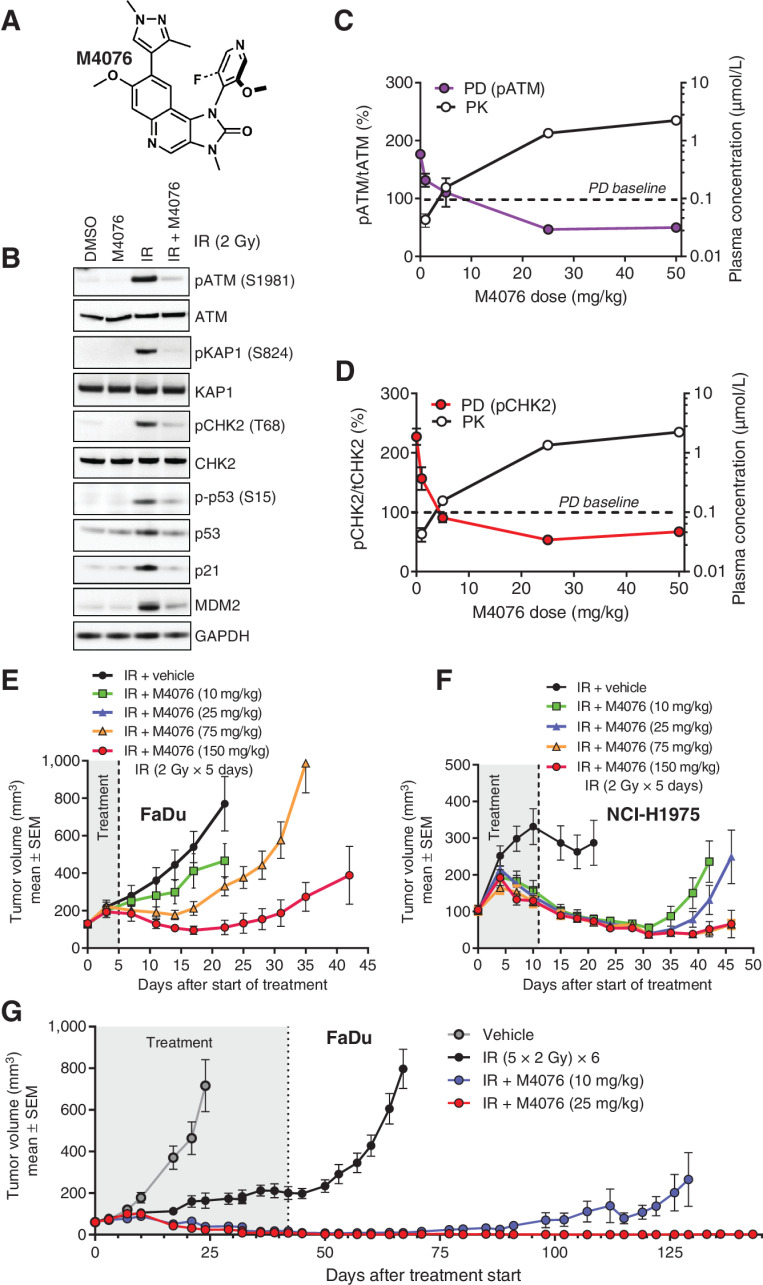
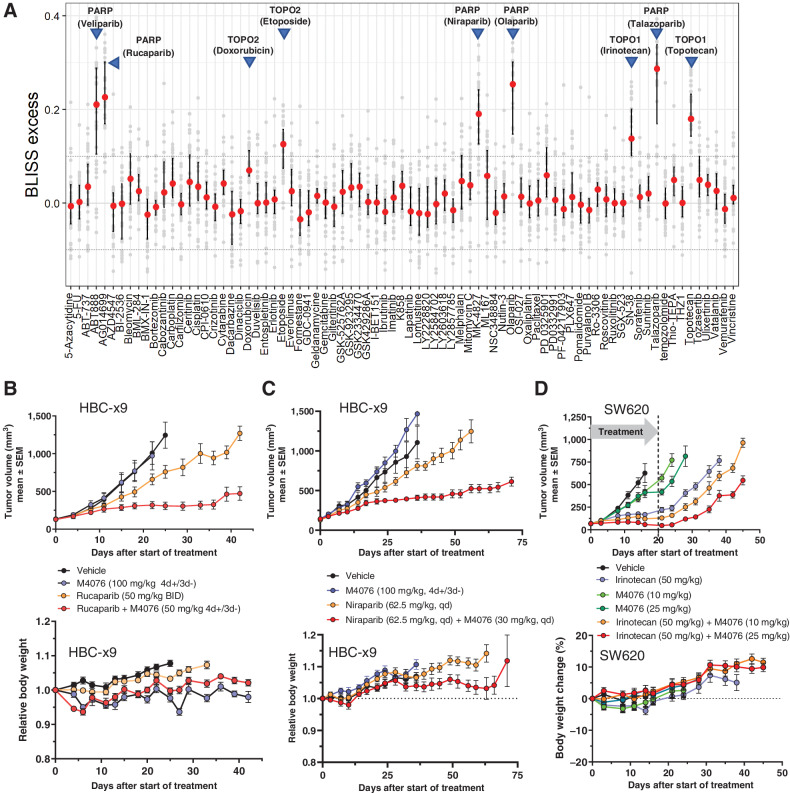
Radiotherapy and chemical DNA-damaging agents are among the most widely used classes of cancer therapeutics today. Double-strand breaks (DSB) induced by many of these treatments are lethal to cancer cells if left unrepaired. Ataxia telangiectasia-mutated (ATM) kinase plays a key role in the DNA damage response by driving DSB repair and cell-cycle checkpoints to protect cancer cells. Inhibitors of ATM catalytic activity have been shown to suppress DSB DNA repair, block checkpoint controls and enhance the therapeutic effect of radiotherapy and other DSB-inducing modalities. Here, we describe the pharmacological activities of two highly potent and selective ATM inhibitors from a new chemical class, M3541 and M4076. In biochemical assays, they inhibited ATM kinase activity with a sub-nanomolar potency and showed remarkable selectivity against other protein kinases. In cancer cells, the ATM inhibitors suppressed DSB repair, clonogenic cancer cell growth, and potentiated antitumor activity of ionizing radiation in cancer cell lines. Oral administration of M3541 and M4076 to immunodeficient mice bearing human tumor xenografts with a clinically relevant radiotherapy regimen strongly enhanced the antitumor activity, leading to complete tumor regressions. The efficacy correlated with the inhibition of ATM activity and modulation of its downstream targets in the xenograft tissues. In vitro and in vivo experiments demonstrated strong combination potential with PARP and topoisomerase I inhibitors. M4076 is currently under clinical investigation.


Figures

None
Graphical abstract
Figure 1. M3541 is a potent and selective inhibitor of ATM kinase activity. A, M3541 structural formula, concentration–response relationship in in vitro ATM kinase assays and summary of potency and selectivity. The IC50 value data for ATM kinase and closely related members of PI3K-related kinases is listed. Kinase assays with ATP concentrations at or near KM are labeled (*). B, M3541 inhibits ATM signaling. A549 cells were pre-treated with increasing concentrations of M3541 for 1 hour and exposed to IR (5 Gy). Whole-cell lysates were collected 1 hour after IR and p-ATM and its downstream targets pKAP1, pCHK2 and pp53 were analyzed by Western blotting. C, pATM levels from western blot images (B) at different M3541 concentrations were quantified by GE Imager using ImageJ software and plotted as the percentage of the IR-induced p-ATM (100%). Dotted line represents uninduced p-ATM level. D, Inhibition of ATM signaling by M3541 in a panel of ATM wild-type (A375, A549, FaDu, HCC1187, HT29, MCF-7, NCI-H460, and SW620) and ATM mutant cancer cell lines (Granta-519, HT-144, NCI-H1395, and NCI-H23). Cells were treated with increasing M3541 concentrations in the presence of the radiomimetic bleomycin (10 μmol/L) for 3–6 hrs. P-CHK2 (Thr68) was measured by ELISA in whole-cell lysates and IC50 values calculated.
Figure 1.
M3541 is a potent and selective inhibitor of ATM kinase activity. A, M3541 structural formula, concentration–response relationship in in vitro ATM kinase assays and summary of potency and selectivity. The IC50 value data for ATM kinase and closely related members of PI3K-related kinases is listed. Kinase assays with ATP concentrations at or near KM are labeled (*). B, M3541 inhibits ATM signaling. A549 cells were pre-treated with increasing concentrations of M3541 for 1 hour and exposed to IR (5 Gy). Whole-cell lysates were collected 1 hour after IR and p-ATM and its downstream targets pKAP1, pCHK2 and pp53 were analyzed by Western blotting. C, pATM levels from western blot images (B) at different M3541 concentrations were quantified by GE Imager using ImageJ software and plotted as the percentage of the IR-induced p-ATM (100%). Dotted line represents uninduced p-ATM level. D, Inhibition of ATM signaling by M3541 in a panel of ATM wild-type (A375, A549, FaDu, HCC1187, HT29, MCF-7, NCI-H460, and SW620) and ATM mutant cancer cell lines (Granta-519, HT-144, NCI-H1395, and NCI-H23). Cells were treated with increasing M3541 concentrations in the presence of the radiomimetic bleomycin (10 μmol/L) for 3–6 hrs. P-CHK2 (Thr68) was measured by ELISA in whole-cell lysates and IC50 values calculated.
Figure 2. M3541 selectively inhibits DSB repair and sensitizes cancer cells to radiotherapy. A, M3541 suppresses IR-induced ATM signaling. A549 cells were pre-treated with 1 μmol/L M3541 before 5Gy IR. After 6 hours, whole-cell lysates were prepared, and ATM and ATM pathway targets were assessed by Western blotting. B, M3541 inhibits repair of IR-induced DSBs. A549 cells were treated as described previously in (A) and γH2AX foci were detected by immunofluorescence 24 hours after IR. Representative images are shown at ×20 magnifications. γH2AX foci in green and nuclear staining by DAPI shown in blue. C, Quantification of γH2AX foci shown in B using ImageJ software. D, M3541 inhibits the growth of A549 cells. Growth/viability curves of A549 Nuclight cells treated as in (A) were generated by IncuCyte live cell imaging (images taken every 2 hours for 6 days). The number of green-fluorescent nuclei represents the total number of cells (mean ± SEM). E, In combination with IR, M3541 disrupts cell-cycle progression. Cell-cycle profiles of A549 cells treated with DMSO, M3541, IR or IR+M3541 at different time points. F, M3541 inhibits clonogenic cell growth. A549 cells challenged with different doses of IR plus/minus 1 μmol/L M3541 were incubated at 37°C for 14 days. Cell colonies were visualized by staining with 0.5% crystal violet, imaged and quantified. G, Colony growth relative to DMSO controls shown in (F) was quantified and plotted as a function of IR dose. H, Cell growth/viability of 79 cancer cell lines in response to M3541 alone or in combination with IR (3Gy) was quantified by sulforhodamine B (SRB) straining. Synergy score was calculated by the Bliss excess method as described previously in Materials and Methods and cell lines were plotted in alphabetical order. I, Box plot representation of synergy scores calculated for IR alone and IR + M3541 groups.
Figure 2.
M3541 selectively inhibits DSB repair and sensitizes cancer cells to radiotherapy. A, M3541 suppresses IR-induced ATM signaling. A549 cells were pre-treated with 1 μmol/L M3541 before 5Gy IR. After 6 hours, whole-cell lysates were prepared, and ATM and ATM pathway targets were assessed by Western blotting. B, M3541 inhibits repair of IR-induced DSBs. A549 cells were treated as described previously in (A) and γH2AX foci were detected by immunofluorescence 24 hours after IR. Representative images are shown at ×20 magnifications. γH2AX foci in green and nuclear staining by DAPI shown in blue. C, Quantification of γH2AX foci shown in B using ImageJ software. D, M3541 inhibits the growth of A549 cells. Growth/viability curves of A549 Nuclight cells treated as in (A) were generated by IncuCyte live cell imaging (images taken every 2 hours for 6 days). The number of green-fluorescent nuclei represents the total number of cells (mean ± SEM). E, In combination with IR, M3541 disrupts cell-cycle progression. Cell-cycle profiles of A549 cells treated with DMSO, M3541, IR or IR+M3541 at different time points. F, M3541 inhibits clonogenic cell growth. A549 cells challenged with different doses of IR plus/minus 1 μmol/L M3541 were incubated at 37°C for 14 days. Cell colonies were visualized by staining with 0.5% crystal violet, imaged and quantified. G, Colony growth relative to DMSO controls shown in (F) was quantified and plotted as a function of IR dose. H, Cell growth/viability of 79 cancer cell lines in response to M3541 alone or in combination with IR (3Gy) was quantified by sulforhodamine B (SRB) straining. Synergy score was calculated by the Bliss excess method as described previously in Materials and Methods and cell lines were plotted in alphabetical order. I, Box plot representation of synergy scores calculated for IR alone and IR + M3541 groups.
Figure 3. M3541 potentiates IR efficacy in xenograft models of human cancer. A, M3541 inhibits ATM downstream phosphorylation target p-CHK2 in vivo. pCHK2 (Thr68) modulation was measured in response to IR (black) or combination with IR + M3541 (red). FaDu xenograft bearing mice (5 mice per treatment and timepoint) received a single treatment of 2 Gy IR with or without 100 mg/kg M3541. M3541 was given orally 10 minutes before IR. pCHK2 modulation was measured in tumor lysates at indicated timepoints. Plasma concentrations of M3541 were determined and plotted (green). B, M3541 dose dependently enhances IR effect in FaDu xenografts. Tumor-bearing mice (10 mice per arm) were treated with M3541, IR (2Gy x 5 days; total dose: 10 Gy) or IR + M3541 and tumor volume was followed for a maximum of 70 days. C–F, M3541 strongly enhances IR efficacy in 6-week fractional radiotherapy studies with 4 xenograft models. Mice (10 mice per arm) were irradiated with 2Gy fractions (5 days on, 2 days off) for 6 weeks. M3541 was given orally 10 minutes before IR at the indicated doses. Tumor growth was followed for at least 9 weeks after treatment. G–I, M3541 demonstrated combination benefit with the SoC regiment IR + cisplatin in the FaDu model. Mice with established xenografts (10 mice per arm) received 2 Gy IR fractions (5 days on/2 days off) for 2 weeks (20Gy total dose). Cisplatin was given intraperitoneally at 3 mg/kg on days 0 and 7 and M3541 at 100 mg/kg 10 minutes before each radiotherapy fraction. G and H, Tumor volume and body weight changes. I, Progression-free survival. Tumors with relative tumor volume change values ≤73% were categorized as an event. This cutoff value was selected in accordance with the RECIST definition for progressive disease based on tumor volume (44).
Figure 3.
M3541 potentiates IR efficacy in xenograft models of human cancer. A, M3541 inhibits ATM downstream phosphorylation target p-CHK2 in vivo. pCHK2 (Thr68) modulation was measured in response to IR (black) or combination with IR + M3541 (red). FaDu xenograft bearing mice (5 mice per treatment and timepoint) received a single treatment of 2 Gy IR with or without 100 mg/kg M3541. M3541 was given orally 10 minutes before IR. pCHK2 modulation was measured in tumor lysates at indicated timepoints. Plasma concentrations of M3541 were determined and plotted (green). B, M3541 dose dependently enhances IR effect in FaDu xenografts. Tumor-bearing mice (10 mice per arm) were treated with M3541, IR (2Gy x 5 days; total dose: 10 Gy) or IR + M3541 and tumor volume was followed for a maximum of 70 days. C–F, M3541 strongly enhances IR efficacy in 6-week fractional radiotherapy studies with 4 xenograft models. Mice (10 mice per arm) were irradiated with 2Gy fractions (5 days on, 2 days off) for 6 weeks. M3541 was given orally 10 minutes before IR at the indicated doses. Tumor growth was followed for at least 9 weeks after treatment. G–I, M3541 demonstrated combination benefit with the SoC regiment IR + cisplatin in the FaDu model. Mice with established xenografts (10 mice per arm) received 2 Gy IR fractions (5 days on/2 days off) for 2 weeks (20Gy total dose). Cisplatin was given intraperitoneally at 3 mg/kg on days 0 and 7 and M3541 at 100 mg/kg 10 minutes before each radiotherapy fraction. G and H, Tumor volume and body weight changes. I, Progression-free survival. Tumors with relative tumor volume change values ≤73% were categorized as an event. This cutoff value was selected in accordance with the RECIST definition for progressive disease based on tumor volume (44).
Figure 4. M4076 is a superior ATM inhibitor with improved pharmacological properties. A M4076 structural formula. B, M4076 inhibits IR-induced ATM signaling in A549 cells. Cells were exposed to 1 μmol/L M4076 an hour before irradiation (5Gy), cell lysates were prepared 6 hours later and ATM signaling assessed by Western blotting. C and D, M4076 inhibits ATM direct phosphorylation targets, p-ATM and p-CHK2, in vivo. The levels of p-ATM (purple) and p-CHK2 (red) were measured in response to IR alone or IR + M4076 in the FaDu model. Mice bearing established xenografts (5 mice per treatment and dose) received 2Gy IR with or without indicated doses of M4076 given orally 30 minutes before IR and tumor lysates were prepared 2 hours after M4076 administration. Plasma concentrations of M4076 were determined in parallel and plotted (black). Baseline levels of p-ATM and p-CHK2 are represented by the dotted horizontal lines. E, M4076 enhances IR effect in FaDu xenografts. FaDu tumor-bearing mice (9 mice per arm) were treated with IR (2Gy fraction x 5 consecutive days; total IR dose 10 Gy) or IR + M4076 at the indicated doses and tumor growth and body weight of mice was followed for 42 days. F, M4076 enhances IR efficacy in the NCI-H1975 xenograft model. Mice with established xenografts (9 per arm) were treated as in (E) for 2 weeks (total IR dose 20 Gy). Tumor growth and body weight was followed for 46 days. G, M4076 strongly enhances IR efficacy in the 6-week FaDu xenograft model. Mice (10 mice per arm) were treated with IR or IR + M4076 as in (E) but for 6 consecutive weeks (total IR dose 60 Gy) simulating a curative treatment regimen. Tumor growth and body weight was followed for 143 days.
Figure 4.
M4076 is a superior ATM inhibitor with improved pharmacological properties. A M4076 structural formula. B, M4076 inhibits IR-induced ATM signaling in A549 cells. Cells were exposed to 1 μmol/L M4076 an hour before irradiation (5Gy), cell lysates were prepared 6 hours later and ATM signaling assessed by Western blotting. C and D, M4076 inhibits ATM direct phosphorylation targets, p-ATM and p-CHK2, in vivo. The levels of p-ATM (purple) and p-CHK2 (red) were measured in response to IR alone or IR + M4076 in the FaDu model. Mice bearing established xenografts (5 mice per treatment and dose) received 2 Gy IR with or without indicated doses of M4076 given orally 30 minutes before IR and tumor lysates were prepared 2 hours after M4076 administration. Plasma concentrations of M4076 were determined in parallel and plotted (black). Baseline levels of p-ATM and p-CHK2 are represented by the dotted horizontal lines. E, M4076 enhances IR effect in FaDu xenografts. FaDu tumor-bearing mice (9 mice per arm) were treated with IR (2Gy fraction x 5 consecutive days; total IR dose 10 Gy) or IR + M4076 at the indicated doses and tumor growth and body weight of mice was followed for 42 days. F, M4076 enhances IR efficacy in the NCI-H1975 xenograft model. Mice with established xenografts (9 per arm) were treated as in (E) for 2 weeks (total IR dose 20 Gy). Tumor growth and body weight was followed for 46 days. G, M4076 strongly enhances IR efficacy in the 6-week FaDu xenograft model. Mice (10 mice per arm) were treated with IR or IR + M4076 as in (E) but for 6 consecutive weeks (total IR dose 60 Gy) simulating a curative treatment regimen. Tumor growth and body weight was followed for 143 days.
Figure 5. M4076 synergizes with topoisomerase and PARP inhibitors. A, Pairwise combination synergy analysis of 79 anticancer agents combined with M4076 in a panel of 34 cancer cell lines. Small-molecule agents representing diverse modes of action were combined with M4076 in a subset of cancer cell lines and evaluated for growth/viability after incubation for five days. Bliss excess was calculated per drug and cell line. Drug combination effects across the cell line panel were plotted using the median, 25th and 75th percentile connected by line to visualize combination effects across the cell line panel. Horizontal lines at Bliss excess of 0.1 and −0.1 serve as threshold for weak/moderate and strong combination synergy effects. B–C, Combination effect of M4076 with rucaparib (B) or niraparib (C) in the HCB-x9 breast cancer model. Efficacy and body weight changes in HBCx-9 TNBC PDX–bearing mice (9 mice per arm for B; 7 mice per arm for C) receiving orally M4076 plus either of the two PARP inhibitors were monitored for 45 (rucaparib) or 75 (niraparib) days. D, Efficacy and body weight changes of M4076 in combination with irinotecan in the SW620 xenograft model. Mice (10 per arm) were treated with 3×1-week cycles of the combination or respective monotherapy control arms. One cycle consisted of a single irinotecan application (intraperitoneally) at a dose of 50 mg/kg, followed by 10, and 25 mg/kg of M4076 (po) 24 hours later and for four subsequent days.
Figure 5.
M4076 synergizes with topoisomerase and PARP inhibitors. A, Pairwise combination synergy analysis of 79 anticancer agents combined with M4076 in a panel of 34 cancer cell lines. Small-molecule agents representing diverse modes of action were combined with M4076 in a subset of cancer cell lines and evaluated for growth/viability after incubation for five days. Bliss excess was calculated per drug and cell line. Drug combination effects across the cell line panel were plotted using the median, 25th and 75th percentile connected by line to visualize combination effects across the cell line panel. Horizontal lines at Bliss excess of 0.1 and −0.1 serve as threshold for weak/moderate and strong combination synergy effects. B–C, Combination effect of M4076 with rucaparib (B) or niraparib (C) in the HCB-x9 breast cancer model. Efficacy and body weight changes in HBCx-9 TNBC PDX–bearing mice (9 mice per arm for B; 7 mice per arm for C) receiving orally M4076 plus either of the two PARP inhibitors were monitored for 45 (rucaparib) or 75 (niraparib) days. D, Efficacy and body weight changes of M4076 in combination with irinotecan in the SW620 xenograft model. Mice (10 per arm) were treated with 3×1-week cycles of the combination or respective monotherapy control arms. One cycle consisted of a single irinotecan application (intraperitoneally) at a dose of 50 mg/kg, followed by 10, and 25 mg/kg of M4076 (po) 24 hours later and for four subsequent days.

Comment in

  • Mol Cancer Ther. 21:857.
  • Mol Cancer Ther. 21:857.

Similar articles

Cited by

References

    1. Shiloh Y, Ziv Y. The ATM protein kinase: regulating the cellular response to genotoxic stress, and more. Nat Rev Mol Cell Biol 2013;14:197–210. - PubMed
    1. Blackford AN, Jackson SP. ATM, ATR, and DNA-PK: the trinity at the heart of the DNA damage response. Mol Cell 2017;66:801–17. - PubMed
    1. Maréchal A, Zou L. DNA damage sensing by the ATM and ATR kinases. Cold Spring Harb Perspect Biol 2013;5:a012716. - PMC - PubMed
    1. Lee JH, Paull TT. ATM activation by DNA double-strand breaks through the Mre11-Rad50-Nbs1 complex. Science 2005;308:551–4. - PubMed
    1. Jackson SP, Bartek J. The DNA-damage response in human biology and disease. Nature 2009;461:1071–8. - PMC - PubMed

Publication types