

Vitamin D Deficiency and Its Association with Iron Deficiency in African Children
- PMID: 35405984
- PMCID: PMC9002534
- DOI: 10.3390/nu14071372
Vitamin D Deficiency and Its Association with Iron Deficiency in African Children
Abstract
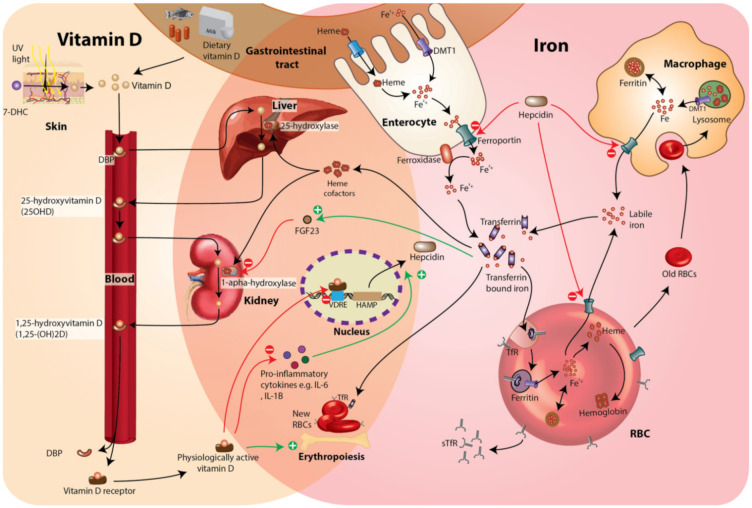
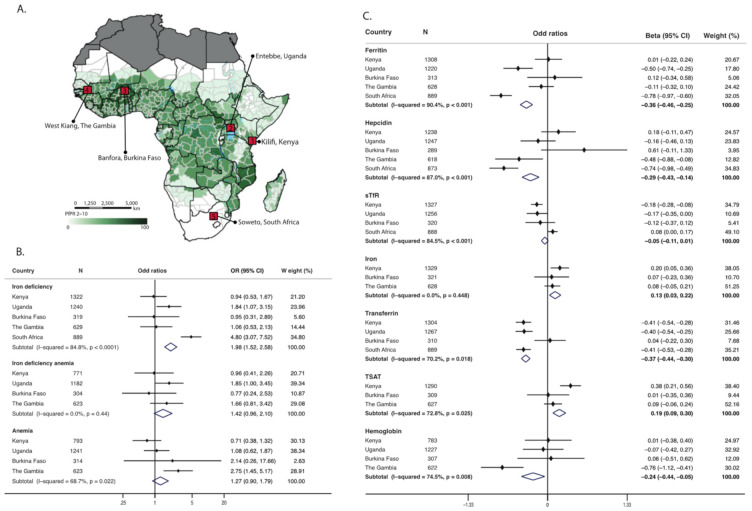
Vitamin D regulates the master iron hormone hepcidin, and iron in turn alters vitamin D metabolism. Although vitamin D and iron deficiency are highly prevalent globally, little is known about their interactions in Africa. To evaluate associations between vitamin D and iron status we measured markers of iron status, inflammation, malaria parasitemia, and 25-hydroxyvitamin D (25(OH)D) concentrations in 4509 children aged 0.3 months to 8 years living in Kenya, Uganda, Burkina Faso, The Gambia, and South Africa. Prevalence of iron deficiency was 35.1%, and prevalence of vitamin D deficiency was 0.6% and 7.8% as defined by 25(OH)D concentrations of <30 nmol/L and <50 nmol/L, respectively. Children with 25(OH)D concentrations of <50 nmol/L had a 98% increased risk of iron deficiency (OR 1.98 [95% CI 1.52, 2.58]) compared to those with 25(OH)D concentrations >75 nmol/L. 25(OH)D concentrations variably influenced individual markers of iron status. Inflammation interacted with 25(OH)D concentrations to predict ferritin levels. The link between vitamin D and iron status should be considered in strategies to manage these nutrient deficiencies in African children.
Keywords: Africa; Vitamin D deficiency; anemia; children; ferritin; hemoglobin; hepcidin; iron; iron deficiency; transferrin saturation.
Conflict of interest statement
The authors declare no conflict of interest.
Figures
References
MeSH terms
Substances
Grants and funding
- MC_UU_00027/5/MRC_/Medical Research Council/United Kingdom
- 202800/Z/16/Z/WT_/Wellcome Trust/United Kingdom
- 110255,202800,106289,064693, 079110,095778,203077/WT_/Wellcome Trust/United Kingdom
- U1232661351, U105960371, MC-A760-5QX00/MRC_/Medical Research Council/United Kingdom
- 1ZIAHG200362/Intramural Research Program of the National Institutes of Health in the Center for Research on Genomics and Global Health (CRGGH)
- MC_PC_MR/R020183/1/MRC_/Medical Research Council/United Kingdom
- MR/R010161/1/MRC_/Medical Research Council/United Kingdom
- MC_U123292699/MRC_/Medical Research Council/United Kingdom
- MC_UU_00026/3/MRC_/Medical Research Council/United Kingdom
- DEL-15-003/Developing Excellence in Leadership, Training and Science
LinkOut - more resources
Full Text Sources
Medical
