

A New Carbohydrate Food Quality Scoring System to Reflect Dietary Guidelines: An Expert Panel Report
- PMID: 35406096
- PMCID: PMC9003092
- DOI: 10.3390/nu14071485
A New Carbohydrate Food Quality Scoring System to Reflect Dietary Guidelines: An Expert Panel Report
Abstract
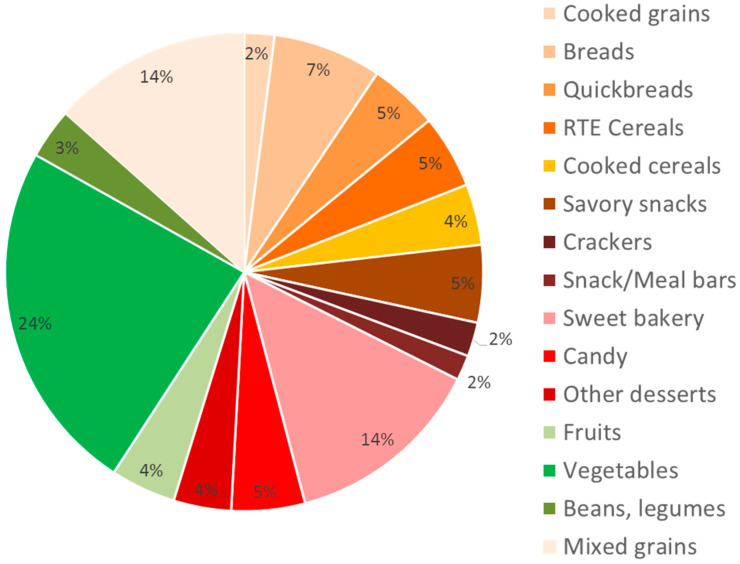
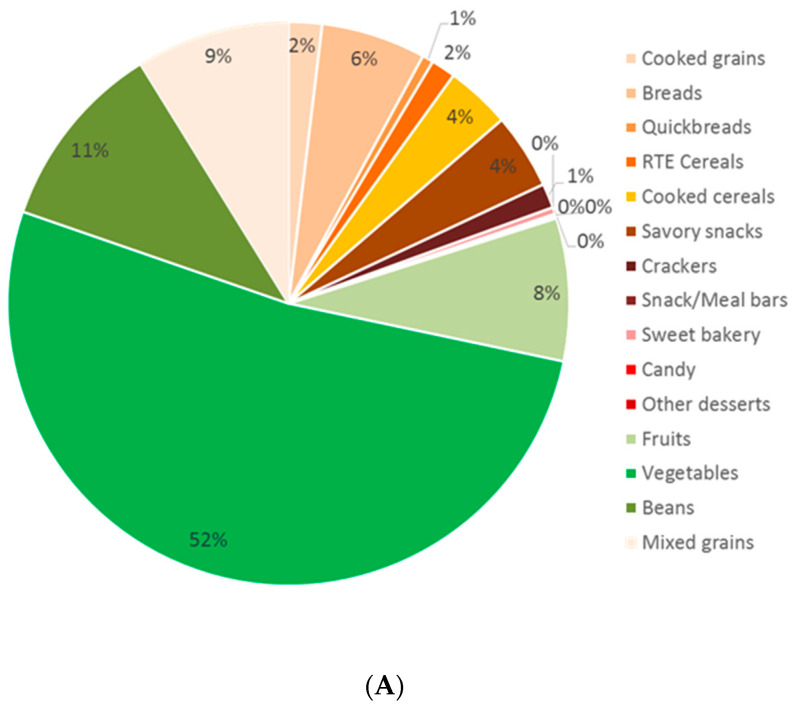
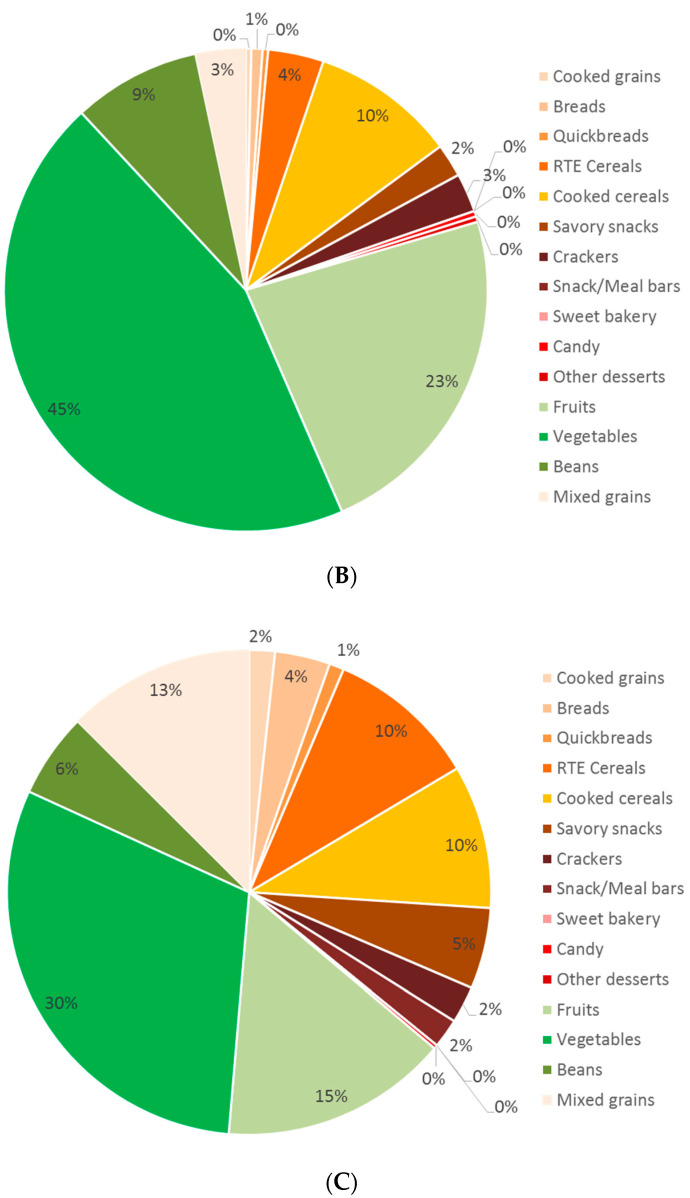
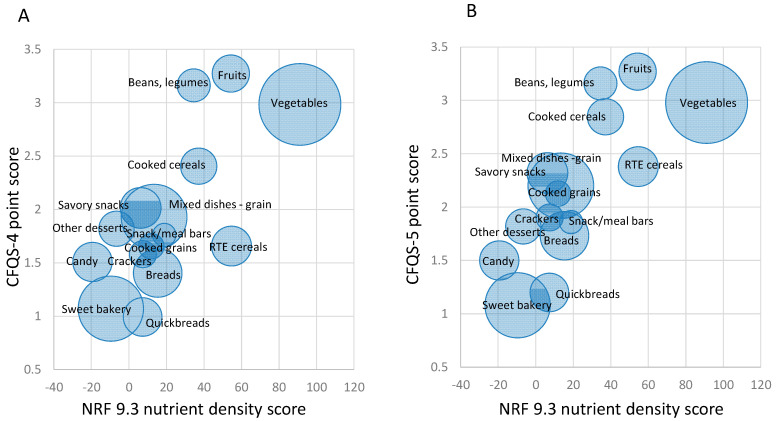
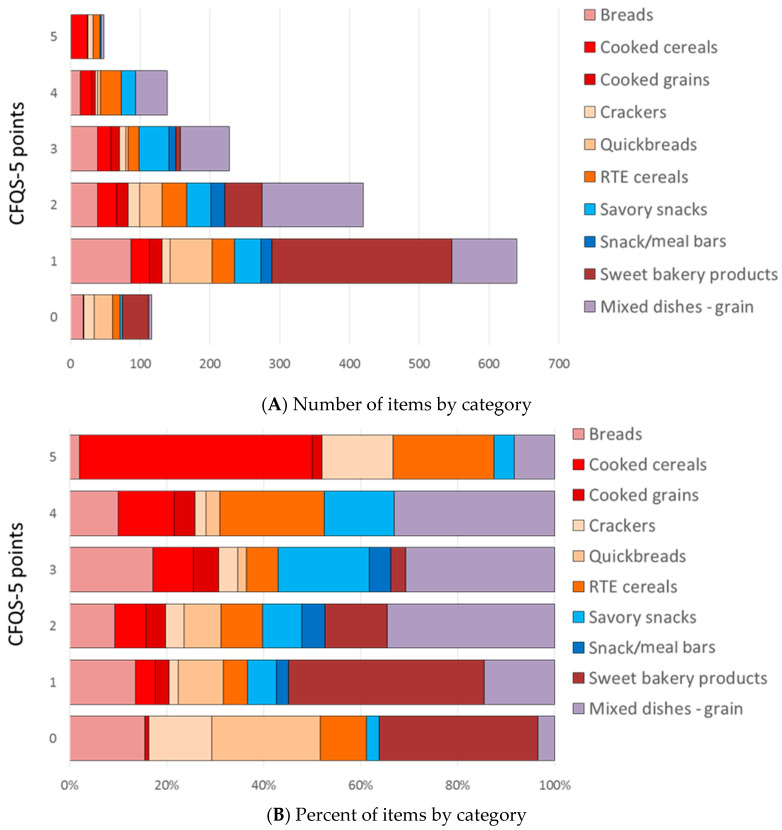
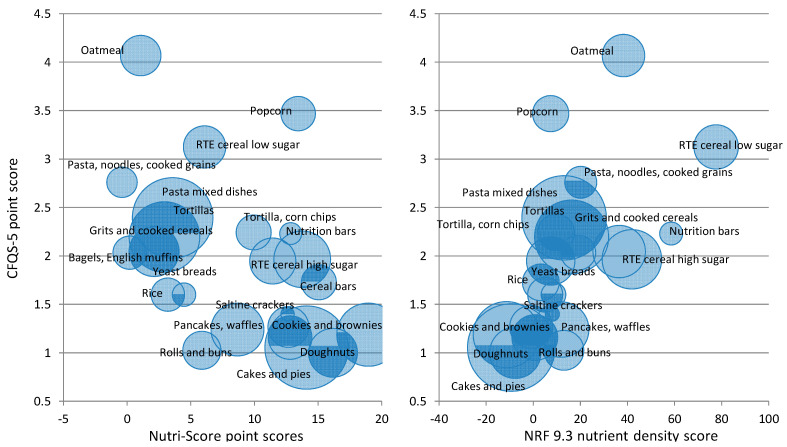
Existing metrics of carbohydrate food quality have been based, for the most part, on favorable fiber- and free sugar-to-carbohydrate ratios. In these metrics, higher nutritional quality carbohydrate foods are defined as those with >10% fiber and <10% free sugar per 100 g carbohydrate. Although fiber- and sugar-based metrics may help to differentiate the nutritional quality of various types of grain products, they may not aptly capture the nutritional quality of other healthy carbohydrate foods, including beans, legumes, vegetables, and fruits. Carbohydrate food quality metrics need to be applicable across these diverse food groups. This report introduces a new carbohydrate food scoring system known as a Carbohydrate Food Quality Score (CFQS), which supplements the fiber and free sugar components of previous metrics with additional dietary components of public health concern (e.g., sodium, potassium, and whole grains) as identified by the Dietary Guidelines for Americans. Two CFQS models are developed and tested in this study: one that includes four dietary components (CFQS-4: fiber, free sugars, sodium, potassium) and one that considers five dietary components (CFQS-5: fiber, free sugars, sodium, potassium, and whole grains). These models are applied to 2596 carbohydrate foods in the Food and Nutrient Database for Dietary Studies (FNDDS) 2017−2018. Consistent with past studies, the new carbohydrate food scoring system places large percentages of beans, vegetables, and fruits among the top scoring carbohydrate foods. The whole grain component, which only applies to grain foods (N = 1561), identifies ready-to-eat cereals, oatmeal, other cooked cereals, and selected whole grain breads and crackers as higher-quality carbohydrate foods. The new carbohydrate food scoring system shows a high correlation with the Nutrient Rich Food (NRF9.3) index and the Nutri-Score. Metrics of carbohydrate food quality that incorporate whole grains, potassium, and sodium, in addition to sugar and fiber, are strategically aligned with multiple 2020−2025 dietary recommendations and may therefore help with the implementation of present and future dietary guidelines.
Keywords: Dietary Guidelines for Americans; carbohydrate foods; fiber; free sugars; nutrient profiling; potassium; sodium; whole grain.
Conflict of interest statement
All authors are invited members of the Quality Carbohydrate Coalition’s Scientific Advisory Council (QCC-SAC). AD is the developer of the Nutrient Rich Food (NRF) index, a nutrient profiling model, and has received grants, contracts, and honoraria from entities, both public and private, with an interest in the nutrient density of foods, complex meals, and total diet. Y.P. is the president of Nutritional Strategies, collaborates on NHANES analyses, and provides food, nutrition, and regulatory affairs consulting services for food/beverage companies and food-related associations. S.S.A. and J.M.J. advise the Grain Foods Foundation. J.S. has current grants from Taiyo and Barilla in the area of dietary fiber and also serves on the Scientific Advisory Boards for Simply Good Foods and Atkins Nutritionals. J.R. and M.M. have no conflicts of interest. K.B.C. is employed by FoodMinds, which provides science communications consulting services to various food and nutrition entities, including Potatoes USA and the Alliance for Potato Research and Education (APRE).
Figures
References
-
- Food and Agriculture Organization of the United Nations FAOSTAT Database Collections. [(accessed on 23 October 2021)]. Available online: https://www.fao.org/faostat/en/
-
- Sawicki C.M., Lichtenstein A.H., Rogers G.T., Jacques P.F., Ma J., Saltzman E., McKeown N.M. Comparison of Indices of Carbohydrate Quality and Food Sources of Dietary Fiber on Longitudinal Changes in Waist Circumference in the Framingham Offspring Cohort. Nutrients. 2021;13:997. doi: 10.3390/nu13030997. - DOI - PMC - PubMed
-
- U.S. Department of Agriculture and U.S. Department of Health and Human Services . Dietary Guidelines for Americans. 2020–2025. 9th ed. U.S. Department of Agriculture and U.S. Department of Health and Human Services; Washington, DC, USA: 2020.
MeSH terms
Substances
LinkOut - more resources
Full Text Sources
Medical
Miscellaneous
