. 2022 Mar 31;14(7):1778.
doi: 10.3390/cancers14071778.

Radiomics-Based Method for Predicting the Glioma Subtype as Defined by Tumor Grade, IDH Mutation, and 1p/19q Codeletion

Affiliations

Radiomics-Based Method for Predicting the Glioma Subtype as Defined by Tumor Grade, IDH Mutation, and 1p/19q Codeletion

Yingping Li et al. Cancers (Basel). .

Abstract

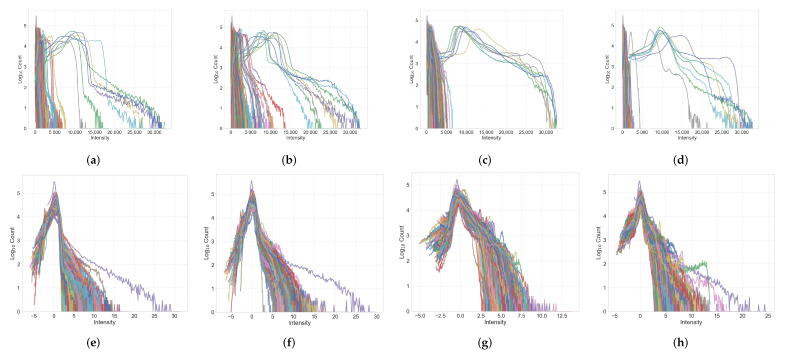
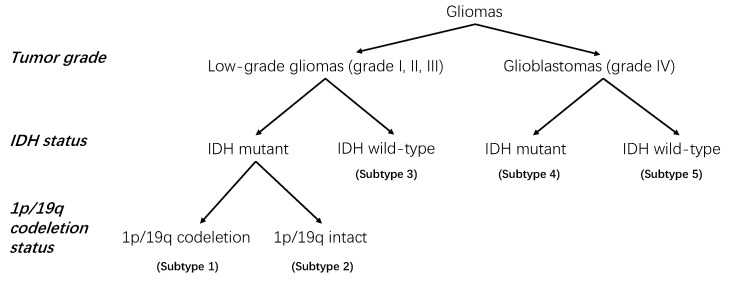
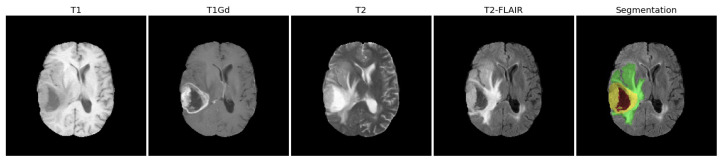
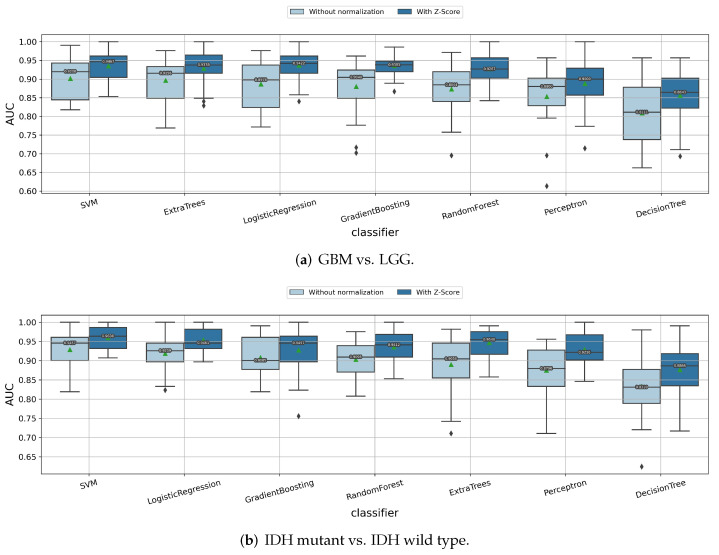
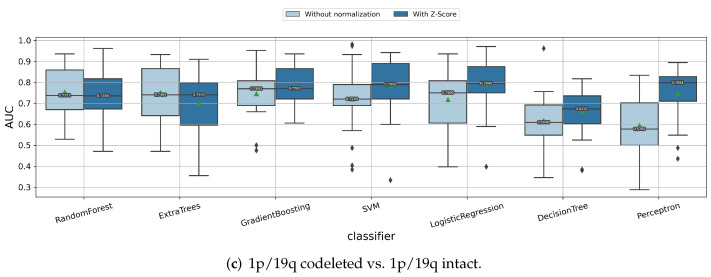
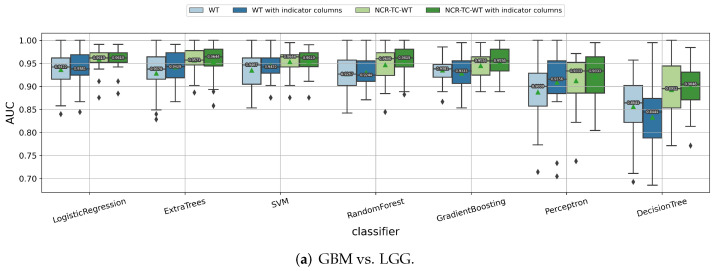
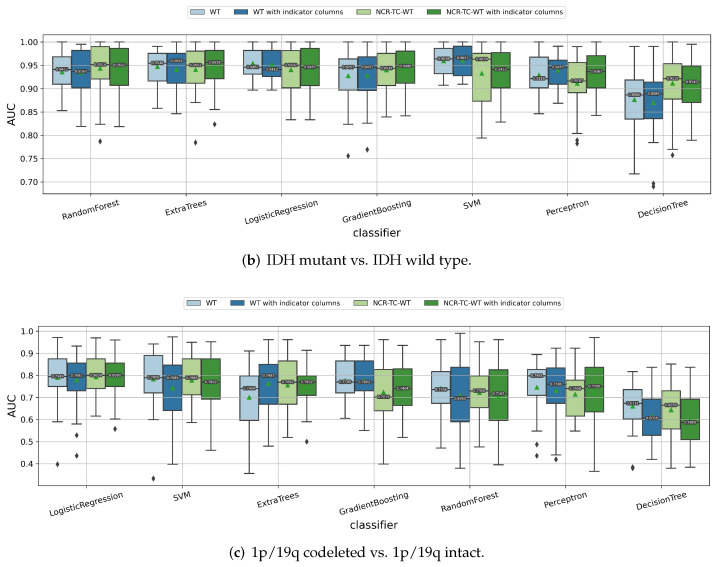
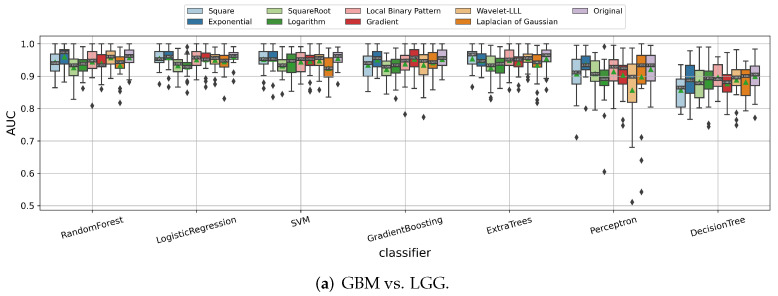
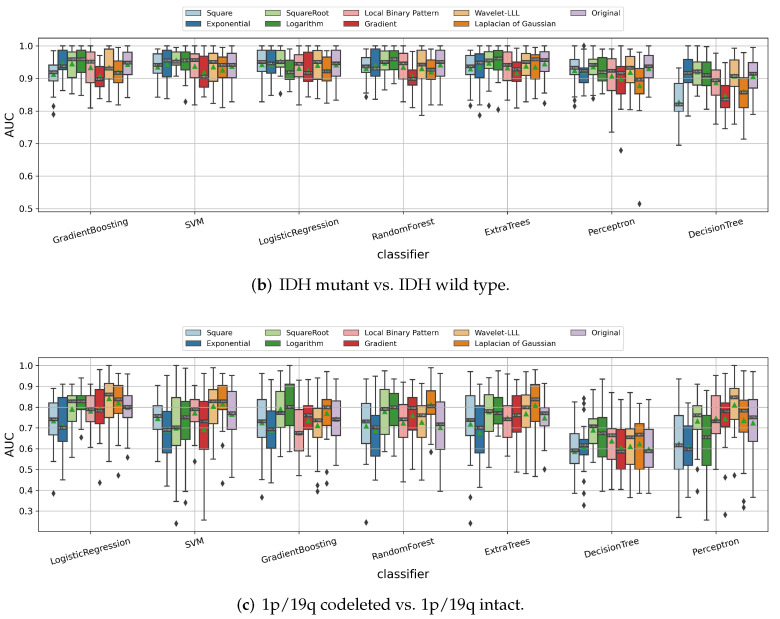
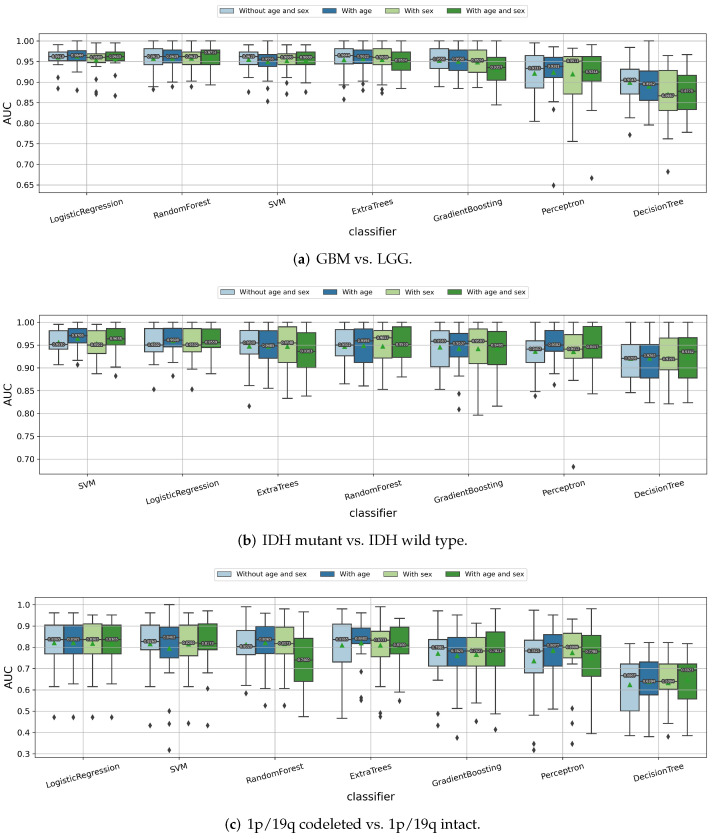
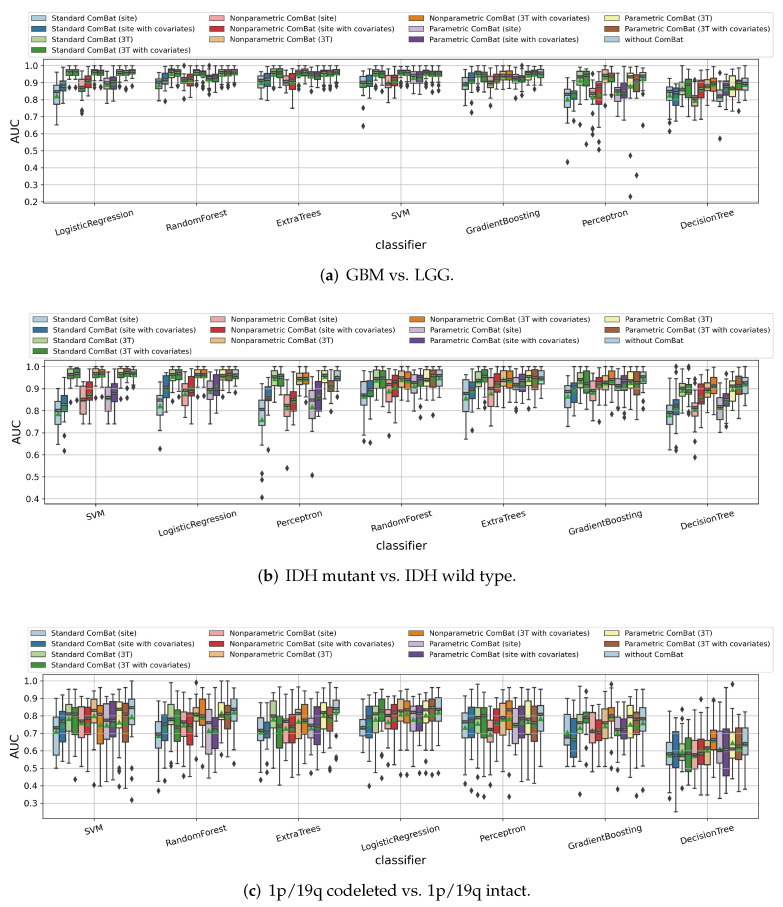
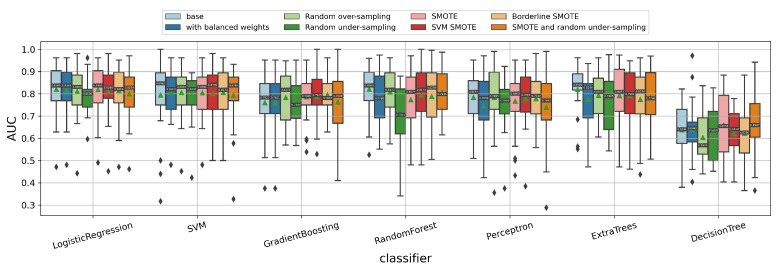
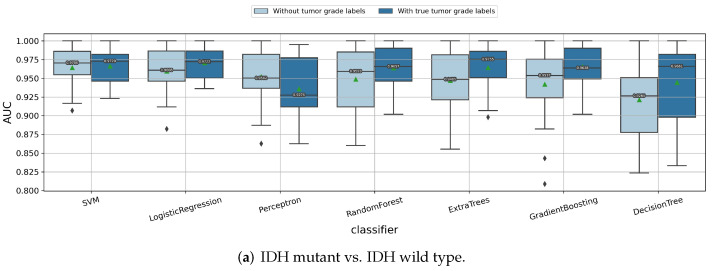
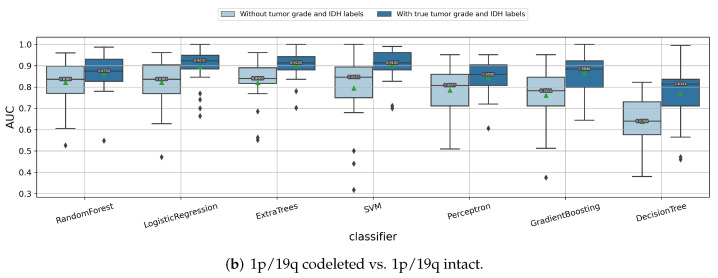
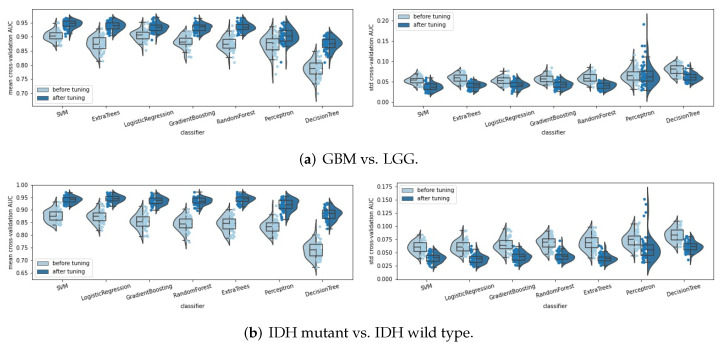
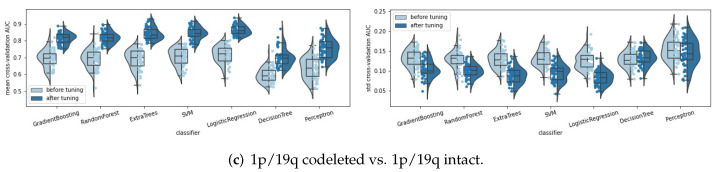
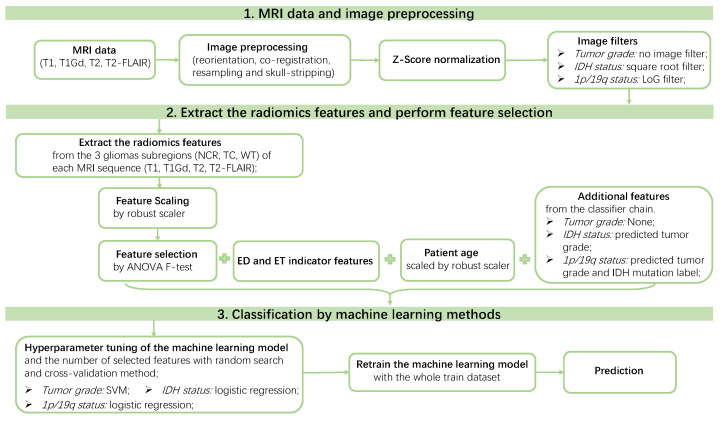
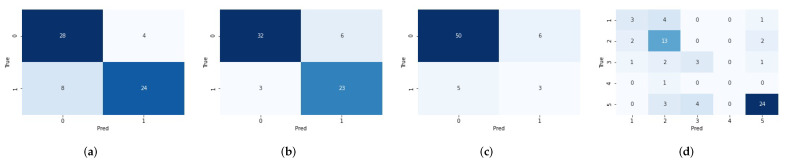
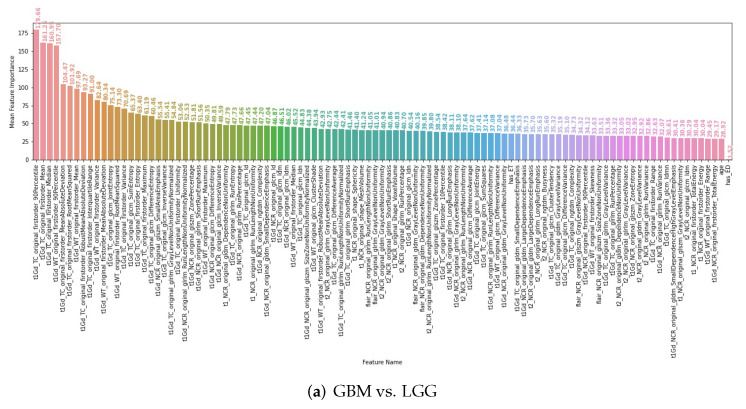
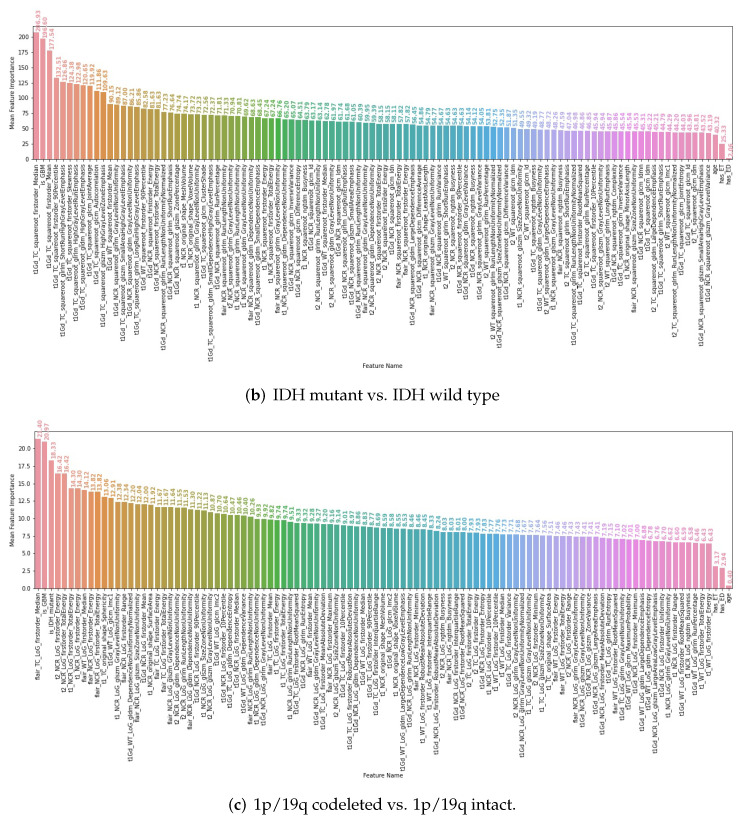
Gliomas are among the most common types of central nervous system (CNS) tumors. A prompt diagnosis of the glioma subtype is crucial to estimate the prognosis and personalize the treatment strategy. The objective of this study was to develop a radiomics pipeline based on the clinical Magnetic Resonance Imaging (MRI) scans to noninvasively predict the glioma subtype, as defined based on the tumor grade, isocitrate dehydrogenase (IDH) mutation status, and 1p/19q codeletion status. A total of 212 patients from the public retrospective The Cancer Genome Atlas Low Grade Glioma (TCGA-LGG) and The Cancer Genome Atlas Glioblastoma Multiforme (TCGA-GBM) datasets were used for the experiments and analyses. Different settings in the radiomics pipeline were investigated to improve the classification, including the Z-score normalization, the feature extraction strategy, the image filter applied to the MRI images, the introduction of clinical information, ComBat harmonization, the classifier chain strategy, etc. Based on numerous experiments, we finally reached an optimal pipeline for classifying the glioma tumors. We then tested this final radiomics pipeline on the hold-out test data with 51 randomly sampled random seeds for reliable and robust conclusions. The results showed that, after tuning the radiomics pipeline, the mean AUC improved from 0.8935 (±0.0351) to 0.9319 (±0.0386), from 0.8676 (±0.0421) to 0.9283 (±0.0333), and from 0.6473 (±0.1074) to 0.8196 (±0.0702) in the test data for predicting the tumor grade, IDH mutation, and 1p/19q codeletion status, respectively. The mean accuracy for predicting the five glioma subtypes also improved from 0.5772 (±0.0816) to 0.6716 (±0.0655). Finally, we analyzed the characteristics of the radiomic features that best distinguished the glioma grade, the IDH mutation, and the 1p/19q codeletion status, respectively. Apart from the promising prediction of the glioma subtype, this study also provides a better understanding of the radiomics model development and interpretability. The results in this paper are replicable with our python codes publicly available in github.

Keywords: 1p/19q codeletion; IDH mutation; glioblastomas; gliomas; radiomics; tumor grade.


Conflict of interest statement

The authors declare no conflict of interest. The funders had no role in the design of the study; in the collection, analyses, or interpretation of data; in the writing of the manuscript, or in the decision to publish the results.

Figures

Figure A1
Figure A1
The intensity histograms of the original images (first row) and the Z-score normalized images (second row) for the four sequences of the MRI images. Each colored line corresponds to an image histogram of one preprocessed brain MRI image downloaded from the TCGA-GBM or TCGA-LGG dataset. The subfigures correspond to the image histograms of (a) original T1 MRI, (b) original T1Gd MRI, (c) original T2 MRI, (d) original T2-FLAIR MRI, (e) Z-score normalized T1 MRI, (f) Z-score normalized T1Gd MRI, (g) Z-score normalized T2 MRI, and (h) Z-score normalized T2-FLAIR MRI images. Obviously, the Z-score normalized images have more consistent image histograms.
Figure 1
Figure 1
Classification of the glioma tumors used in this paper. This is a simplified version of the classification criteria of gliomas from the 2016 CNS WHO [2]. The subtype numbers 1 to 5 represent the five different glioma subtypes. They can be summarized, respectively, as subtypes “1—LGG, IDH mutant, 1p/19q codeleted”, “2—LGG, IDH mutant, 1p/19q intact”, “3—LGG, IDH wild type”, “4—GBM, IDH mutant”, and “5—GBM, IDH wild type”.
Figure 2
Figure 2
The four MRI sequences (T1, T1Gd, T2, T2-FLAIR) and the corresponding segmentation mask of an example patient “TCGA-02-0047”. The whole tumor (WT) consists of the necrotic part (NCR, red color), the enhancing tumor part (ET, yellow color), and the peritumoral edematous tissue (ED, green color). The tumor core (TC) consists of the necrotic part (NCR, red color) and the enhancing part (ET, yellow color).
Figure 3
Figure 3
Impact of the Z-score normalization in predicting (a) tumor grade, (b) IDH mutation status, and (c) 1p/19q codeletion status.
Figure 3
Figure 3
Impact of the Z-score normalization in predicting (a) tumor grade, (b) IDH mutation status, and (c) 1p/19q codeletion status.
Figure 4
Figure 4
Impact of different feature extraction strategies on predicting (a) tumor grade, (b) IDH mutation status, and (c) 1p/19q codeletion status. WT means using the radiomic features extracted from the whole tumor, and NCR-TC-WT means using features extracted from three subregions including necrosis, tumor core, and whole tumor. “With indicator columns” means two indicator columns are included as additional features to tell whether the glioma tumor has ED or ET parts.
Figure 4
Figure 4
Impact of different feature extraction strategies on predicting (a) tumor grade, (b) IDH mutation status, and (c) 1p/19q codeletion status. WT means using the radiomic features extracted from the whole tumor, and NCR-TC-WT means using features extracted from three subregions including necrosis, tumor core, and whole tumor. “With indicator columns” means two indicator columns are included as additional features to tell whether the glioma tumor has ED or ET parts.
Figure 5
Figure 5
Impact of different image filters for predicting (a) tumor grade, (b) IDH mutation status, and (c) 1p/19q codeletion status of the gliomas. Notably, the wavelet image filter has eight decompositions defined by using different high or low pass filters in each dimension. We chose to display “Wavelet-LLL” here because of its best performance compared to the other wavelet filters in our experiments.
Figure 5
Figure 5
Impact of different image filters for predicting (a) tumor grade, (b) IDH mutation status, and (c) 1p/19q codeletion status of the gliomas. Notably, the wavelet image filter has eight decompositions defined by using different high or low pass filters in each dimension. We chose to display “Wavelet-LLL” here because of its best performance compared to the other wavelet filters in our experiments.
Figure 6
Figure 6
Impact of incorporating the age and sex information as additional features to predict (a) tumor grade, (b) IDH mutation status, and (c) 1p/19q codeletion status of the gliomas.
Figure 7
Figure 7
Impact of ComBat harmonization on predicting (a) tumor grade, (b) IDH mutation status, and (c) 1p/19q codeletion status of the gliomas. Here “site” corresponds to using the institution/site label as the scanner setting label during harmonization, while “3T” represents using the magnetic field strength (1.5T or 3T) as a scanner setting label. “With covariates” means keeping the age and sex information during the harmonization process.
Figure 8
Figure 8
Impact of further data imbalance strategies on predicting the 1p/19q codeletion status of the gliomas. Here, the possible regularization was already applied for each classifier, so “base” means not further using any other data imbalance strategies. “SMOTE and random under-sampling” represents the combination of SMOTE and random under-sampling method.
Figure 9
Figure 9
Comparison of whether it helps to improve the performances by using the classifier chain idea, with the true labels of previous classifiers given. (a) Predicting IDH mutation status of the gliomas; (b) predicting 1p/19q codeletion status of the gliomas.
Figure 9
Figure 9
Comparison of whether it helps to improve the performances by using the classifier chain idea, with the true labels of previous classifiers given. (a) Predicting IDH mutation status of the gliomas; (b) predicting 1p/19q codeletion status of the gliomas.
Figure 10
Figure 10
Distribution (displayed by violin plot, box plot, and strip plot) of the mean and STD cross-validation AUC values before and after the pipeline tuning process, for predicting (a) the tumor grade, (b) IDH mutation status, and (c) 1p/19q codeletion status of the gliomas. Each reported point corresponds to a sample random run within 51 random seeds.
Figure 10
Figure 10
Distribution (displayed by violin plot, box plot, and strip plot) of the mean and STD cross-validation AUC values before and after the pipeline tuning process, for predicting (a) the tumor grade, (b) IDH mutation status, and (c) 1p/19q codeletion status of the gliomas. Each reported point corresponds to a sample random run within 51 random seeds.
Figure 11
Figure 11
Final radiomics pipeline for predicting each binary classification label (tumor grade, IDH mutation status, and 1p/19q codeletion status) of the gliomas tumor. During the hyperparameter tuning process, the mean cross-validation AUC is used as the evaluation metric.
Figure 12
Figure 12
The confusion matrices on the hold-out test data for predicting (a) GBM vs. LGG, (b) IDH mutant vs. IDH wild type, (c) 1p/19q codeleted vs. 1p/19q intact, and (d) the five glioma subtypes defined by the 2016 CNS WHO. Random seed was fixed as 4442 because of its median prediction accuracy of the glioma subtype (accuracy = 0.6719) among the 51 random seeds. Here, the accuracy for predicting the tumor grade, IDH mutation, and 1p/19q codeletion was 0.8125, 0.8594, and 0.8281, respectively.
Figure 13
Figure 13
The non-radiomic features and the first 100 radiomic features with the highest average feature importance calculated by the ANOVA F-value for predicting (a) tumor grade, (b) IDH mutation status, and (c) 1p/19q codeletion status. The feature importance annotated on each feature bar refers to the mean feature importance averaged on the 51 random seeds.
Figure 13
Figure 13
The non-radiomic features and the first 100 radiomic features with the highest average feature importance calculated by the ANOVA F-value for predicting (a) tumor grade, (b) IDH mutation status, and (c) 1p/19q codeletion status. The feature importance annotated on each feature bar refers to the mean feature importance averaged on the 51 random seeds.
Figure 14
Figure 14
Statistics of the first 20 radiomic features with the highest average feature importance calculated by ANOVA F-value and averaged on 51 random seeds. The first row shows the statistics of the MRI sequences and tumor subregions (a) for predicting tumor grade, (b) for predicting IDH mutation status, and (c) for predicting 1p/19q codeletion status. The second row shows the statistics of the feature types (d) for predicting tumor grade, (e) for predicting IDH mutation status, and (f) for predicting the 1p/19q codeletion status, respectively. The values in the brackets represent the number of features.

References

    1. Walker C., Baborie A., Crooks D., Wilkins S., Jenkinson M. Biology, genetics and imaging of glial cell tumours. Br. J. Radiol. 2011;84:S90–S106. doi: 10.1259/bjr/23430927. - DOI - PMC - PubMed
    1. Louis D.N., Perry A., Reifenberger G., Von Deimling A., Figarella-Branger D., Cavenee W.K., Ohgaki H., Wiestler O.D., Kleihues P., Ellison D.W. The 2016 World Health Organization classification of tumors of the central nervous system: A summary. Acta Neuropathol. 2016;131:803–820. doi: 10.1007/s00401-016-1545-1. - DOI - PubMed
    1. Delev D., Heiland D.H., Franco P., Reinacher P., Mader I., Staszewski O., Lassmann S., Grau S., Schnell O. Surgical management of lower-grade glioma in the spotlight of the 2016 WHO classification system. J. Neuro-Oncol. 2019;141:223–233. doi: 10.1007/s11060-018-03030-w. - DOI - PubMed
    1. Chai R., Li G., Liu Y., Zhang K., Zhao Z., Wu F., Chang Y., Pang B., Li J., Li Y., et al. Predictive value of MGMT promoter methylation on the survival of TMZ treated IDH-mutant glioblastoma. Cancer Biol. Med. 2021;18:272–282. doi: 10.20892/j.issn.2095-3941.2020.0179. - DOI - PMC - PubMed
    1. Qi S., Yu L., Gui S., Ding Y., Han H., Zhang X., Wu L., Yao F. IDH mutations predict longer survival and response to temozolomide in secondary glioblastoma. Cancer Sci. 2012;103:269–273. - PubMed

LinkOut - more resources