. 2022 Apr 1;14(7):1802.
doi: 10.3390/cancers14071802.

Targeting of Ubiquitin E3 Ligase RNF5 as a Novel Therapeutic Strategy in Neuroectodermal Tumors

Affiliations

Targeting of Ubiquitin E3 Ligase RNF5 as a Novel Therapeutic Strategy in Neuroectodermal Tumors

Elisa Principi et al. Cancers (Basel). .

Abstract

RNF5, an endoplasmic reticulum (ER) E3 ubiquitin ligase, participates to the ER-associated protein degradation guaranteeing the protein homeostasis. Depending on tumor model tested, RNF5 exerts pro- or anti-tumor activity. The aim of this study was to elucidate the controversial role of RNF5 in neuroblastoma and melanoma, two neuroectodermal tumors of infancy and adulthood, respectively. RNF5 gene levels are evaluated in publicly available datasets reporting the gene expression profile of melanoma and neuroblastoma primary tumors at diagnosis. The therapeutic effect of Analog-1, an RNF5 pharmacological activator, was investigated on in vitro and in vivo neuroblastoma and melanoma models. In both neuroblastoma and melanoma patients the high expression of RNF5 correlated with a better prognostic outcome. Treatment of neuroblastoma and melanoma cell lines with Analog-1 reduced cell viability by impairing the glutamine availability and energy metabolism through inhibition of F1Fo ATP-synthase activity. This latter event led to a marked increase in oxidative stress, which, in turn, caused cell death. Similarly, neuroblastoma- and melanoma-bearing mice treated with Analog-1 showed a significant delay of tumor growth in comparison to those treated with vehicle only. These findings validate RNF5 as an innovative drug target and support the development of Analog-1 in early phase clinical trials for neuroblastoma and melanoma patients.

Keywords: RNF5; endoplasmic reticulum associated protein degradation; melanoma; neuroblastoma; ubiquitin ligase.


Conflict of interest statement

The authors declare no conflict of interest.

Figures

Figure 1
Figure 1
RNF5 expression profile is associated with survival of neuroblastoma and melanoma patients. (a,b): Kaplan-Meier analysis shows that neuroblastoma patients with lower RNF5 expression levels have a poorer prognostic outcome both in terms of overall survival (OS) (a) and event free survival (EFS) (b). Red and blue curves refer to RNF5 low and high expression, respectively. Y axis reports OS and EFS probabilities, while the time of follow up, expressed in months, is reported on the X axis. Statistical analysis was performed with log-rank test corrected with Bonferroni method (p < 0.01; p < 0.001). (c): bar graph represents the differential expression of RNF5 in High Risk (HR) and Low Risk (LR) neuroblastoma (NB) patients. Statistical analysis was performed by one way ANOVA test. Asterisks indicate statistical significance (Log2FC= −1.02, **** p value <0.0001). (d): survival analysis of patients with melanoma shows that a low expression of RNF5 is observed in patients with poor prognosis (n = 107 red curve) compared to subjects with favorable clinical outcome (n = 107 blue curve), but this association is not significant (p value > 0.05). OS probability is reported on Y axis, while the months of follow-up are shown on the X axis. Statistical analysis was performed with log-rank test corrected with Bonferroni method.
Figure 2
Figure 2
RNF5 activation by Analog−1 decreases tumor cell viability. (a): a representative western blot and densitometric analysis of RNF5 (lower band) in human neuroblastoma (SH-SY5Y, SK−N−SH, IMR3−2, HTLA−230), melanoma (MZ2−MEL, A2058, G−361, SK−MEL−28), non small lung cancer (Calu−3) cell lines, human fibroblasts, primary human BE from a non−CF patient (HBE121), primary human BE from a CF subject (HBE55) cells and human immortalized bronchial epithelial (BE) from a cystic fibrosis (CF) patient (CFBE41o-). Calnexin (CNX) was used as housekeeping protein. (b): cell viability of SH−SY5Y neuroblastoma and MZ2−MEL melanoma cell lines treated with 10 μM Analog−1 for 24 and 48 h as determined by Trypan Blue Assay. Results are expressed as mean of the percentage of viable cells over control ± SD from three different experiments. Statistical analysis was performed using Unpaired t Test. Asterisks indicate statistical significance (*: p < 0.05; **: p < 0.01; ****: p < 0.0001). (c): cell viability of SH−SY5Y neuroblastoma and MZ2−MEL melanoma cell lines treated with 10 μM In−h2 as determined by Trypan Blue Assay. Results are expressed as the mean of the percentage of viable cells over control ± SD from three different experiments. (d): a representative western blot and densitometric analysis of RNF5 (lower band) in human neuroblastoma SH−SY5Y and human melanoma MZ2−MEL cell lines treated with vehicle alone (DMSO) or with Analog−1 (10 µM) for 24 h.
Figure 3
Figure 3
Analog-1 reduces the glutamine and glutamate intracellular content of neuroblastoma and melanoma cells. (a,b): glutamine (a) and glutamate (b) intracellular content of neuroblastoma SH-SY5Y and melanoma MZ2-MEL cell lines treated with 10 μM Analog-1 or vehicle for 24 and 48 h and evaluated by spectrophotometric analysis. Data are expressed as the mean ± SD from three different experiments. Statistical analysis was performed using Unpaired t Test. Asterisks indicate statistical significance (****: p < 0.0001).
Figure 4
Figure 4
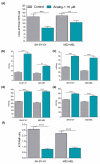
Analog-1 down-modulates the energetic metabolism of neuroblastoma and melanoma cells. (a): ATP synthase activity (nmol ATP/min/106 cells) after the addition of 10 mM pyruvate + 5 mM malate and measured by luminometric analysis. (be): activity of Hexokinase (b), Phosphofructokinase (c), Pyruvate kinase (d), Lactate Dehydrogenase (e) of neuroblastoma SH-SY-5Y and melanoma MZ2-MEL cell lines untreated or treated with Analog-1 for 24 and 48 h evaluated by spectrophotometric analysis. (f): ATP/AMP ratio in neuroblastoma SH-SY5Y and melanoma MZ2-MEL cell lines untreated or treated with Analog-1 for 24 and 48. Each graph is representative of three experiments performed and data are expressed as the mean ± SD. Statistical analysis was performed using Unpaired t Test. Asterisks indicate statistical significance (**: p < 0.01; ***: p < 0.001; ****: p < 0.0001).
Figure 5
Figure 5
Analog-1 affects reactive oxygen species production, apoptosis, proliferation and morphology of neuroblastoma and melanoma cells. (a): oxidation stress of SH-SY5Y and MZ2-MEL cells treated with Analog-1 10 μM or vehicle alone (negative control) or phorbol-miristate-acetate (PMA) (positive control) for different times up to 180 min, evaluated by measuring oxidized dye Dichloro-dihydrofluorescein-diacetate (DCFDA) in living cells by time-lapse imaging of cells using the Opera Phenix high-content screening system. Data are expressed as the mean value of DFCDA intensity ± SEM (n = 4). Statistical analysis was performed using Unpaired t Test. Asterisks indicate statistical significance (*: p < 0.05; **: p < 0.01; ***: p < 0.001; ****: p < 0.0001). (b): percentage of apoptotic cells upon treatment of SH-SY5Y and MZ2-MEL cells with Analog-1 10–50–100 μM or vehicle alone (negative control) or the proteasome inhibitor MG-123 (positive control) for 24 and 48 h. The cells were stained with Hoecht 33342 and Propidium Iodide and then imaged by using the Opera Phenix high-content screening system. Data are expressed as the mean of % apoptotic cells ± SEM (n = 6). Statistical analysis was performed using Unpaired t Test. Asterisks indicate statistical significance (*: p < 0.05; **: p < 0.01; ***: p < 0.001). (c): proliferation of SH-SH5Y neuroblastoma and MZ2-MEL melanoma cell lines treated with 10 μM Analog-1 or vehicle alone (negative control) at different time points and evaluated by using the Opera Phenix high-content screening system. Data are expressed as the mean of % open area of 5 different fields ± SEM. Statistical analysis was performed using Unpaired t Test. Asterisks indicate statistical significance (*: p < 0.05; **: p < 0.01; ***: p < 0.001; ****: p < 0.0001). (d): morphological changes of SH-SH5Y neuroblastoma and MZ2-MEL melanoma cell lines treated with 10 μM Analog-1 for 48 h and evaluated by the analysis of cell roundness using Opera Phenix high-content system. Data are expressed as mean of single cell roundness ± SEM (n = 3000). Statistical analysis was performed using Unpaired t Test. Asterisks indicate statistical significance (****: p < 0.0001).
Figure 6
Figure 6
Analog-1 delays in vivo neuroblastoma and melanoma growth. (a,b): tumor volume of five-week old female nude mice subcutaneously inoculated with 20 × 106 SH-SY5Y (a) and 5 × 10⁶ MZ2-MEL (b) cell lines. When tumors were palpable, mice (n = 8 SH-SY5Y-bearing mice; n = 6 MZ2-MEL-bearing mice) were treated every other day by intravenous injection of Analog-1 (3 mg/Kg body weight) (green line) or vehicle alone (control mice: grey line) for 14 days. Tumor volume was calculated using the formula π/6 [w1 × (w2)2], where w1 represents the largest tumor diameter and w2 represents the smallest tumor diameter. Tumor volume is expressed as mean value ± SEM. Statistical analysis was performed Unpaired t Test. Asterisks indicate statistical significance (*, p < 0.05; **, p < 0.01). (c): evaluation of proliferation by immunohistochemical staining of paraffin-embedded sections from Analog-1- and vehicle-treated SH-SY5Y and MZ2-MEL bearing mice with anti-Ki-67 cell proliferation marker. Data are expressed as the mean value of Ki67 positive cells counted in 10 fields ± SEM. Original magnification 63×. Statistical analysis was performed Unpaired t Test. Asterisks indicate statistical significance (*, p < 0.05; ***, p < 0.001). (d): evaluation of apoptosis by immunofluorescence analysis of paraffin-embedded sections from Analog-1- and vehicle-treated mice using terminal deoxynucleotidyl transferase-mediated dUTP nick end labeling [TUNEL] assay for the detection of apoptosis. Data are expressed as the mean fluorescence intensity ± SEM of 80 different fields acquired by Opera Phenyx high content system at 20× magnification. Statistical analysis was performed Unpaired t Test. Asterisks indicate statistical significance (****, p < 0.0001).

References

    1. Fang S., Lorick K.L., Jensen J.P., Weissman A.M. RING finger ubiquitin protein ligases: Implications for tumorigenesis, metastasis and for molecular targets in cancer. Semin. Cancer Biol. 2003;13:5–14. doi: 10.1016/S1044-579X(02)00095-0. - DOI - PubMed
    1. Ciechanover A.A.H. No Title THE UBIQUITIN SYSTEM. Annu. Rev. Biochem. 1998;67:425–479. - PubMed
    1. Tsai Y.C., Weissman A.M. The unfolded protein response, degradation from the endoplasmic reticulum, and cancer. Genes Cancer. 2010;1:764–778. - PMC - PubMed
    1. Kuang E., Qi J., Ronai Z. Emerging roles of E3 ubiquitin ligases in autophagy. Trends Biochem. Sci. 2013;38:453–460. - PMC - PubMed
    1. Didier C., Broday L., Bhoumik A., Israeli S., Takahashi S., Nakayama K., Thomas S.M., Turner C.E., Henderson S., Sabe H., et al. RNF5, a RING Finger Protein That Regulates Cell Motility by Targeting Paxillin Ubiquitination and Altered Localization. Mol. Cell. Biol. 2003;23:5331–5345. doi: 10.1128/MCB.23.15.5331-5345.2003. - DOI - PMC - PubMed

LinkOut - more resources