

Quantifying Tumor Heterogeneity via MRI Habitats to Characterize Microenvironmental Alterations in HER2+ Breast Cancer
- PMID: 35406609
- PMCID: PMC8997932
- DOI: 10.3390/cancers14071837
Quantifying Tumor Heterogeneity via MRI Habitats to Characterize Microenvironmental Alterations in HER2+ Breast Cancer
Abstract
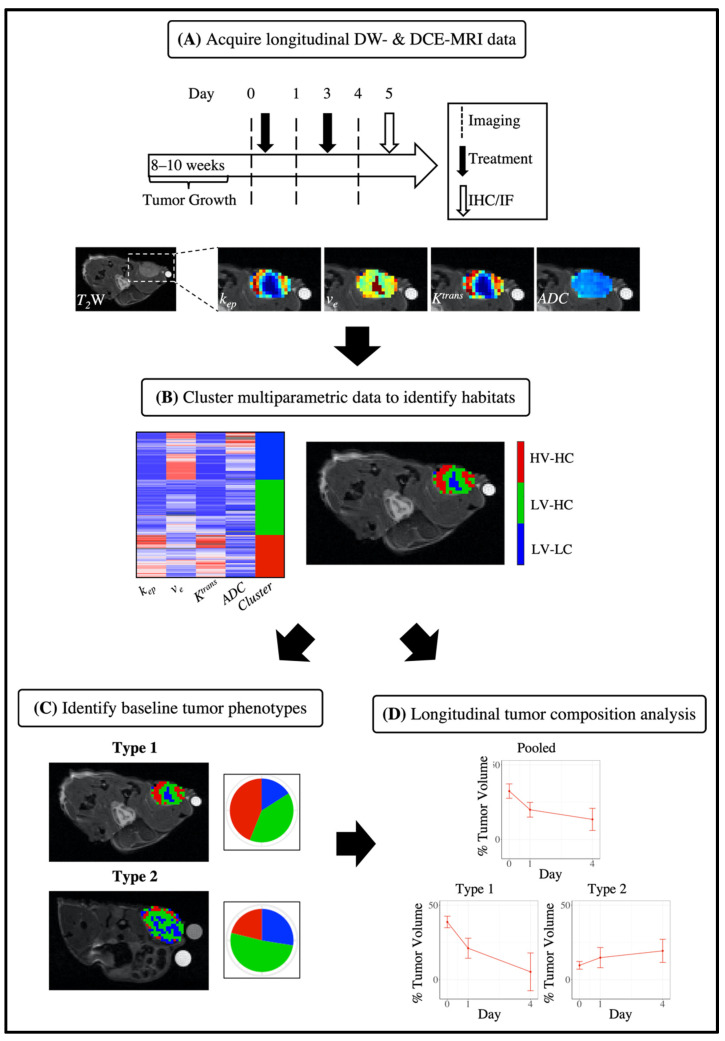
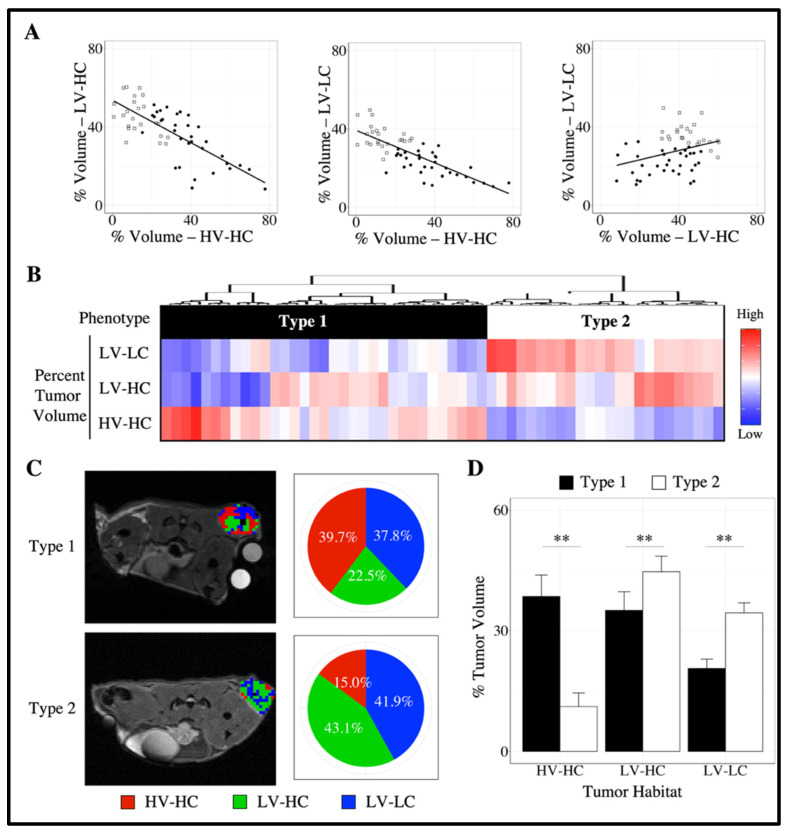
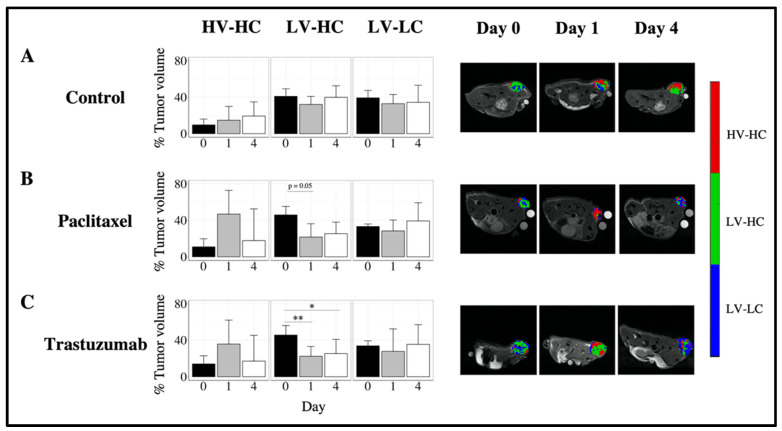
This study identifies physiological habitats using quantitative magnetic resonance imaging (MRI) to elucidate intertumoral differences and characterize microenvironmental response to targeted and cytotoxic therapy. BT-474 human epidermal growth factor receptor 2 (HER2+) breast tumors were imaged before and during treatment (trastuzumab, paclitaxel) with diffusion-weighted MRI and dynamic contrast-enhanced MRI to measure tumor cellularity and vascularity, respectively. Tumors were stained for anti-CD31, anti-ɑSMA, anti-CD45, anti-F4/80, anti-pimonidazole, and H&E. MRI data was clustered to identify and label each habitat in terms of vascularity and cellularity. Pre-treatment habitat composition was used stratify tumors into two "tumor imaging phenotypes" (Type 1, Type 2). Type 1 tumors showed significantly higher percent tumor volume of the high-vascularity high-cellularity (HV-HC) habitat compared to Type 2 tumors, and significantly lower volume of low-vascularity high-cellularity (LV-HC) and low-vascularity low-cellularity (LV-LC) habitats. Tumor phenotypes showed significant differences in treatment response, in both changes in tumor volume and physiological composition. Significant positive correlations were found between histological stains and tumor habitats. These findings suggest that the differential baseline imaging phenotypes can predict response to therapy. Specifically, the Type 1 phenotype indicates increased sensitivity to targeted or cytotoxic therapy compared to Type 2 tumors.
Keywords: BT-474; diffusion-weighted MRI; dynamic contrast-enhanced MRI; habitat imaging; immunofluorescence; immunohistochemistry; paclitaxel; trastuzumab.
Conflict of interest statement
The authors declare no conflict of interest.
Figures


Similar articles
-
Multiparametric Analysis of Longitudinal Quantitative MRI data to Identify Distinct Tumor Habitats in Preclinical Models of Breast Cancer.Cancers (Basel). 2020 Jun 24;12(6):1682. doi: 10.3390/cancers12061682. Cancers (Basel). 2020. PMID: 32599906 Free PMC article.
-
Study on heterogeneity of vascularity and cellularity via multiparametric MRI habitat imaging in breast cancer.BMC Med Imaging. 2025 May 13;25(1):159. doi: 10.1186/s12880-025-01698-x. BMC Med Imaging. 2025. PMID: 40361010 Free PMC article.
-
Anti-HER2 induced myeloid cell alterations correspond with increasing vascular maturation in a murine model of HER2+ breast cancer.BMC Cancer. 2020 Apr 28;20(1):359. doi: 10.1186/s12885-020-06868-4. BMC Cancer. 2020. PMID: 32345237 Free PMC article.
-
Tumor response assessments with diffusion and perfusion MRI.J Magn Reson Imaging. 2012 Apr;35(4):745-63. doi: 10.1002/jmri.22838. J Magn Reson Imaging. 2012. PMID: 22434697 Review.
-
Visualising spatial heterogeneity in glioblastoma using imaging habitats.Front Oncol. 2022 Nov 24;12:1037896. doi: 10.3389/fonc.2022.1037896. eCollection 2022. Front Oncol. 2022. PMID: 36505856 Free PMC article.
Cited by
-
Preliminary study on DCE-MRI radiomics analysis for differentiation of HER2-low and HER2-zero breast cancer.Front Oncol. 2024 Aug 15;14:1385352. doi: 10.3389/fonc.2024.1385352. eCollection 2024. Front Oncol. 2024. PMID: 39211554 Free PMC article.
-
Breast Multiparametric MRI for Prediction of Neoadjuvant Chemotherapy Response in Breast Cancer: The BMMR2 Challenge.Radiol Imaging Cancer. 2024 Jan;6(1):e230033. doi: 10.1148/rycan.230033. Radiol Imaging Cancer. 2024. PMID: 38180338 Free PMC article.
-
A mathematical model for predicting the spatiotemporal response of breast cancer cells treated with doxorubicin.Cancer Biol Ther. 2024 Dec 31;25(1):2321769. doi: 10.1080/15384047.2024.2321769. Epub 2024 Feb 27. Cancer Biol Ther. 2024. PMID: 38411436 Free PMC article.
-
Whole tumour- and subregion-based radiomics of contrast-enhanced mammography in differentiating HER2 expression status of invasive breast cancers: A double-centre pilot study.Br J Cancer. 2024 Nov;131(10):1613-1622. doi: 10.1038/s41416-024-02871-9. Epub 2024 Oct 9. Br J Cancer. 2024. PMID: 39379571
-
Habitat Analysis in Tumor Imaging: Advancing Precision Medicine Through Radiomic Subregion Segmentation.Cancer Manag Res. 2025 Apr 1;17:731-741. doi: 10.2147/CMAR.S511796. eCollection 2025. Cancer Manag Res. 2025. PMID: 40190416 Free PMC article. Review.
References
-
- Buzdar A.U., Ibrahim N.K., Francis D., Booser D.J., Thomas E.S., Theriault R.L., Pusztai L., Green M.C., Arun B.K., Giordano S.H., et al. Significantly Higher Pathologic Complete Remission Rate After Neoadjuvant Therapy with Trastuzumab, Paclitaxel, and Epirubicin Chemotherapy: Results of a Randomized Trial in Human Epidermal Growth Factor Receptor 2–Positive Operable Breast Cancer. J. Clin. Oncol. 2005;23:3676–3685. doi: 10.1200/JCO.2005.07.032. - DOI - PubMed
-
- Perez E.A., Romond E.H., Suman V.J., Jeong J.-H., Sledge G., Geyer C.E., Martino S., Rastogi P., Gralow J., Swain S.M., et al. Trastuzumab Plus Adjuvant Chemotherapy for Human Epidermal Growth Factor Receptor 2–Positive Breast Cancer: Planned Joint Analysis of Overall Survival From NSABP B-31 and NCCTG N9831. J. Clin. Oncol. 2014;32:3744–3752. doi: 10.1200/JCO.2014.55.5730. - DOI - PMC - PubMed
-
- Eisenhauer E.A., Therasse P., Bogaerts J., Schwartz L.H., Sargent D., Ford R., Dancey J., Arbuck S., Gwyther S., Mooney M., et al. New Response Evaluation Criteria in Solid Tumours: Revised RECIST Guideline (Version 1.1) Eur. J. Cancer. 2009;45:228–247. doi: 10.1016/j.ejca.2008.10.026. - DOI - PubMed
Grants and funding
LinkOut - more resources
Full Text Sources
Research Materials
Miscellaneous
