. 2022 Mar 23;11(7):1073.
doi: 10.3390/cells11071073.

Neutralization of GDF15 Prevents Anorexia and Weight Loss in the Monocrotaline-Induced Cardiac Cachexia Rat Model

Affiliations

Neutralization of GDF15 Prevents Anorexia and Weight Loss in the Monocrotaline-Induced Cardiac Cachexia Rat Model

Bina Albuquerque et al. Cells. .

Abstract

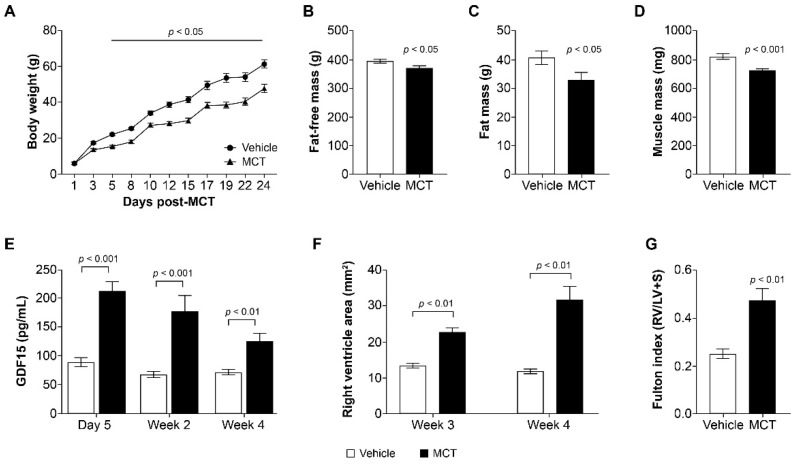
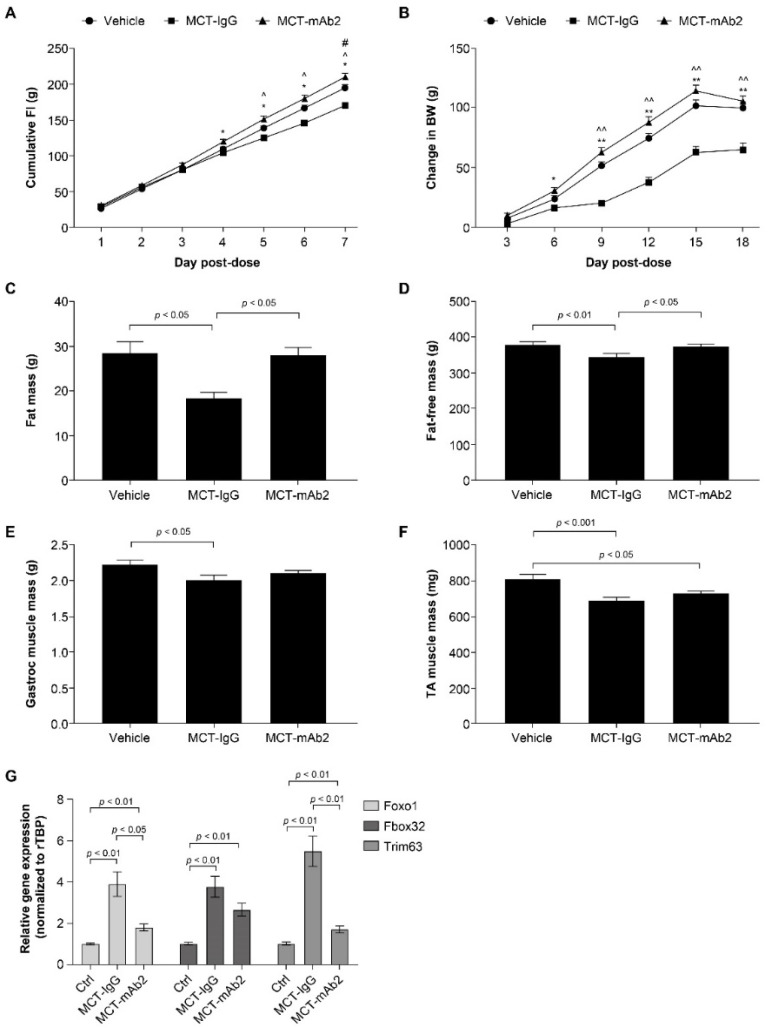
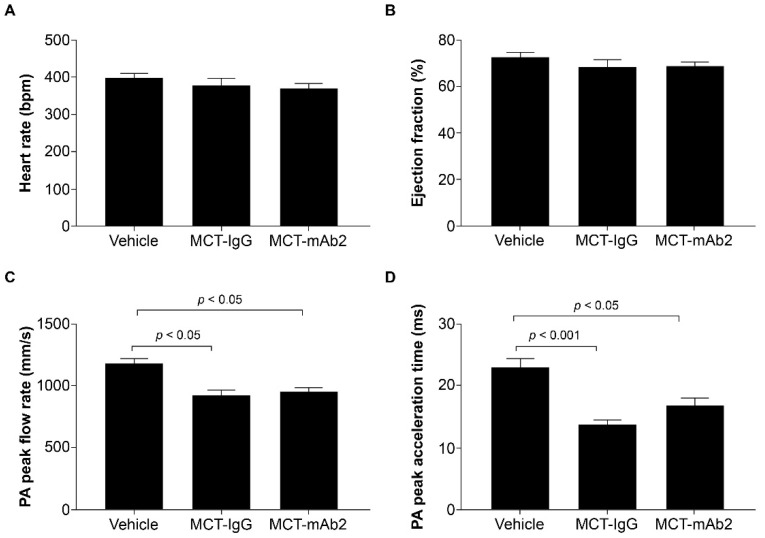
Growth and differentiation factor 15 (GDF15) is a cytokine reported to cause anorexia and weight loss in animal models. Neutralization of GDF15 was efficacious in mitigating cachexia and improving survival in cachectic tumor models. Interestingly, elevated circulating GDF15 was reported in patients with pulmonary arterial hypertension and heart failure, but it is unclear whether GDF15 contributes to cachexia in these disease conditions. In this study, rats treated with monocrotaline (MCT) manifested a progressive decrease in body weight, food intake, and lean and fat mass concomitant with elevated circulating GDF15, as well as development of right-ventricular dysfunction. Cotreatment of GDF15 antibody mAb2 with MCT prevented MCT-induced anorexia and weight loss, as well as preserved lean and fat mass. These results indicate that elevated GDF15 by MCT is causal to anorexia and weight loss. GDF15 mAb2 is efficacious in mitigating MCT-induced cachexia in vivo. Furthermore, the results suggest GDF15 inhibition is a potential therapeutic approach to alleviate cardiac cachexia in patients.

Keywords: GDF15; cardiac cachexia; monocrotaline.


Conflict of interest statement

B.A., X.C., D.H.-S., Y.Z., J.C.S., B.B.Z., A.S. and Z.W. are employees and shareholders of Pfizer.

Figures

Figure 1
Figure 1
MCT treatment increased GDF15 and caused cachexia and RVD in rats. (A) Change in body weight (g) from baseline on days 1–24; p < 0.05 MCT group vs. vehicle from day 5 onward. Data were analyzed with a longitudinal mixed-effects model with an AR(1) covariance structure. (B) Fat-free mass at 3 weeks post MCT; p < 0.05 MCT group vs. vehicle. Data were analyzed using a Welch’s two-sample t-test. (C) Fat mass at 3 weeks post MCT; p < 0.05 MCT group vs. vehicle. Data were analyzed using an unpaired t-test. (D) Muscle mass (tibialis anterior) at 3 weeks post MCT; p < 0.001 MCT group vs. vehicle. Data were analyzed using a Welch’s two-sample t-test. (E) Circulating GDF15 levels (pg/mL) measured at day 5, week 2, and week 4; p < 0.01 week 4, p < 0.001 day 5 and week 2 MCT group vs. vehicle. Data were analyzed with a longitudinal mixed-effects model with an AR(1) covariance structure. (F) Right-ventricular dysfunction according to right-ventricular area (mm2) measured at weeks 3 and 4; p < 0.01 MCT group vs. vehicle. Data were analyzed with a longitudinal mixed-effects model with an AR(1) covariance structure. (G) Fulton index (RV/LV + S) measured at week 4; p < 0.01 MCT group vs. vehicle. Data were analyzed using a Welch’s two-sample t-test. Data are presented as the least squares mean ± SEM. ANOVA: analysis of variance; GDF15: growth and differentiation factor 15; LV: left ventricle; MCT: monocrotaline; RV: right ventricle; RVD: right-ventricular dysfunction; SEM: standard error of the mean; S: septum.
Figure 2
Figure 2
GDF15 mAb2 treatment prevented MCT-induced anorexia and weight loss. (A) Cumulative food intake at days 1–7 post MCT and GDF15 mAb2 dosing. * p < 0.05 MCT–IgG vs. MCT–mAb2, ^ p < 0.05 MCT–IgG vs. vehicle, # p < 0.05 MCT–mAb2 vs. vehicle. Data were analyzed with a longitudinal mixed-effects model with an AR(1) covariance structure. (B) BW change at days 3–18 post MCT and GDF15 mAb2 dosing; * p < 0.05, ** p < 0.01, MCT–IgG vs. MCT–mAb2, ^^ p < 0.01, MCT–IgG vs. vehicle. Data were analyzed with a longitudinal mixed-effects model with an AR(1) covariance structure. (C) Fat mass at day 17 post MCT. Data were analyzed using one-way ANOVA and a Tukey HSD test. (D) Fat-free mass at day 17 post MCT. Data were analyzed using one-way ANOVA and a Tukey HSD test. (E) Muscle mass (gastrocnemius) at 3 weeks post MCT. Data were analyzed using one-way ANOVA and a Tukey HSD test. (F) Muscle mass (tibialis anterior) at 3 weeks post MCT. Data were analyzed using one-way ANOVA and a Tukey HSD test. (G) mRNA expression of Foxo1, Fbox32, and Trim63 in tibialis anterior muscle. Data were analyzed using pairwise Wilcoxon tests. Data are presented as the least squares mean ± SEM. ANOVA: analysis of variance; BW: body weight; Ctrl: control; FI: food intake; Gastroc: gastrocnemius; GDF15: growth and differentiation factor 15; IgG: immunoglobulin G; mAb: monoclonal antibody; MCT: monocrotaline; SEM: standard error of the mean; TA tibialis anterior; rTBP: rat TATA-binding protein.
Figure 3
Figure 3
No effect of GDF15 mAb2 treatment on MCT-induced cardiac function impairment. (A) Heart rate (bpm) at day 16 post-MCT and GDF15 mAb2 dosing. Data were analyzed using one-way ANOVA. (B) Ejection fraction (%) at day 16 post-MCT and GDF15 mAb2 dosing. Data were analyzed using one-way ANOVA. (C) PA peak flow rate (mm/s) at day 16 post-MCT and GDF15 mAb2 dosing. Data were analyzed using one-way ANOVA and Tukey HSD test. (D) PA peak acceleration time (ms) at day 16 post-MCT and GDF15 mAb2 dosing. Data were analyzed using one-way ANOVA and Tukey HSD test. Data represented as least squares mean ± SEM. ANOVA: analysis of variance; GDF15: growth and differentiation factor 15; IgG: immunoglobulin G; mAb: monoclonal antibody; MCT: monocrotaline; PA: pulmonary arterial; SEM: standard error of mean.

References

    1. Baracos V.E., Martin L., Korc M., Guttridge D.C., Fearon K.C.H. Cancer-associated cachexia. Nat. Rev. Dis. Primers. 2018;4:17105. doi: 10.1038/nrdp.2017.105. - DOI - PubMed
    1. Anker S., Steinborn W., Strassburg S. Cardiac cachexia. Ann. Med. 2004;36:518–529. doi: 10.1080/07853890410017467. - DOI - PubMed
    1. Anker S.D., Ponikowski P., Varney S., Chua T.P., Clark A.L., Webb-Peploe K.M., Harrington D., Kox W.J., Poole-Wilson P.A., Coats A.J. Wasting as independent risk factor for mortality in chronic heart failure. Lancet. 1997;349:1050–1053. doi: 10.1016/S0140-6736(96)07015-8. - DOI - PubMed
    1. Evans W.J., Morley J.E., Argilés J., Bales C., Baracos V., Guttridge D., Jatoi A., Kalantar-Zadeh K., Lochs H., Mantovani G., et al. Cachexia: A new definition. Clin. Nutr. 2008;27:793–799. doi: 10.1016/j.clnu.2008.06.013. - DOI - PubMed
    1. Melenovsky V., Kotrc M., Borlaug B.A., Marek T., Kovar J., Malek I., Kautzner J. Relationships between right ventricular function, body composition, and prognosis in advanced heart failure. J. Am. Coll. Cardiol. 2013;62:1660–1670. doi: 10.1016/j.jacc.2013.06.046. - DOI - PubMed

LinkOut - more resources