. 2022 Mar 23;12(7):1050.
doi: 10.3390/nano12071050.

Size- and Oxidation-Dependent Toxicity of Graphene Oxide Nanomaterials in Embryonic Zebrafish

Affiliations

Size- and Oxidation-Dependent Toxicity of Graphene Oxide Nanomaterials in Embryonic Zebrafish

Ryan M Lopez et al. Nanomaterials (Basel). .

Abstract

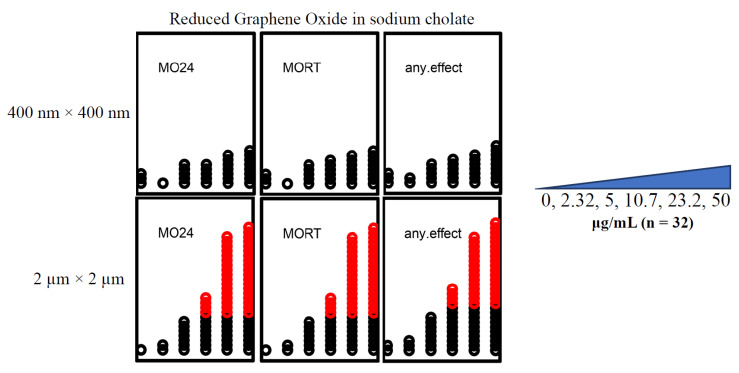
Graphene oxides (GOs) are a popular graphene alternative. The goal of this study was to compare the biocompatibility of a diversity of well-characterized GOs. Our previous work advanced developmental zebrafish as a model to interrogate the interactions and biological responses following exposures to engineered nanomaterials (ENMs). Here, we investigated GO 250 nm × 250 nm (sGO), 400 nm × 400 nm (mGO), and 1 μm × 1 μm (lGO), partially reduced GO (prGO) 400 nm × 400 nm, and reduced GO (rGO) 400 nm × 400 nm and 2 μm × 2 μm, which first underwent extensive characterization under the support of the Nanomaterials Health Implications Research (NHIR) Consortium. GOs were stabilized in water (GOs), while prGO and rGOs were dispersed in sodium cholate. Zebrafish were statically exposed to up to 50 μg/mL of each material from 6 h post-fertilization (hpf) until 120 hpf. Toxicity was dependent on GO properties. mGO was the most toxic material; its effects manifested in the yolk syncytial layer (YSL). Additionally, sodium cholate stabilization significantly increased GO toxicity. The observed effects were size- and oxidation-state-dependent, revealing the importance of identifying the structure-specific toxicity of GOs.

Keywords: developmental toxicity; graphene oxide; nanotoxicology; photomotor behavior; protein corona; sodium cholate; teratogenic; zebrafish.


Conflict of interest statement

The authors declare no conflict of interest.

Figures

Figure 1
Figure 1
Developmental toxicity of sodium cholate. MO24 = 24 hpf mortality; MORT = 120 hpf mortality; any.effect = physical malformations, including mortality at 120 hpf. Outcomes significantly above the binomial threshold (Student’s t-test; α = 0.05) are indicated in red on the dot plot. The sodium cholate concentration gradient increases from left to right (0 μg/mL, 0.625 μg/mL, 1.25 μg/mL, 2.5 μg/mL, 5 μg/mL, 10 μg/mL, 25 μg/mL, 50 μg/mL, 125 μg/mL, 250 μg/mL, 300 μg/mL, 400 μg/mL, 500 μg/mL).
Figure 2
Figure 2
Comparison of GOs with and without sodium cholate. The GO concentration gradient increases from left to right (0 μg/mL, 2.32 μg/mL, 5 μg/mL, 10.7 μg/mL, 23.2 μg/mL, 50 μg/mL), each concentration contained dechorionated embryos (n = 32) exposed for 120 h. MO24 = 24 hpf mortality; MORT = 120 hpf mortality; any.effect = physical malformations, including mortality at 120 hpf. Outcomes significantly above the binomial threshold (Student’s t-test; α = 0.05) are indicated in red on the dot plot. (A) sGO exposures show an increase in mortality upon addition of sodium cholate. (B) mGO exposures show an increase in mortality when sodium cholate was added to the solution. (C) Addition of sodium cholate to lGO (lGOC) had a wider range of mortality compared to lGO (without sodium cholate).
Figure 3
Figure 3
rGO developmental toxicity. rGO exposures of embryos (n = 32) revealed that the 400 nm × 400 nm rGO did not cause significant mortality at any of the concentrations investigated (0 μg/mL, 2.32 μg/mL, 5 μg/mL, 10.7 μg/mL, 23.2 μg/mL, 50 μg/mL) (p > 0.05). The 2 μm × 2 μm rGO exposures caused mortality and malformations starting at 10.7 μg/mL. MO24 = 24 hpf mortality; MORT = 120 hpf mortality; any.effect = physical malformations, including mortality at 120 hpf. Outcomes significantly above the binomial threshold (Student’s t-test; α = 0.05) are indicated in red on the dot plot.
Figure 4
Figure 4
prGO developmental toxicity. Embryonic exposures to 0 μg/mL, 2.32 μg/mL, 5 μg/mL, 10.7 μg/mL, 23.2 μg/mL, and 50 μg/mL prGO (n = 32) caused significant mortality at both 24 hpf and 120 hpf (p < 0.05). The calculated LEL was 10.7 μg/mL. MO24 = 24 hpf mortality; MORT = 120 hpf mortality; any.effect = physical malformations, including mortality at 120 hpf. Outcomes significantly above the binomial threshold (Student’s t-test; α = 0.05) are indicated in red on the dot plot.
Figure 5
Figure 5
Window of susceptibility starting at 6 hpf. All GOs were tested at 50 μg/mL. mGO (brick pattern) caused the most rapid mortality with significant mortality observed at 7 hpf (p = 0.037). lGO (diamond pattern), rGO 2 μm × 2 μm (horizontal stripes), and prGO 400 nm × 400 nm (vertical stripes) caused significant mortality 9 hpf (p = 0.027), 10 hpf (p = 0.012), and 11 hpf (p = 0.012) (respectively). Significant mortality at specified timepoints was determined by Welch’s t-tests (α = 0.05).
Figure 6
Figure 6
Brightfield imaging of 6 hpf embryos exposed to mGO. The 50 μg/mL-mGO-exposed and UP water control embryos imaged for 1 h after initial exposure at 6 hpf. Images were taken on BZ-X700 Keyence microscope in a flat-bottom 96-well plate. Images 1a, 1b, 1c, and 1d in the mGO-exposed images were taken in sequential order several minutes apart after the 1 h post-exposure timepoint.
Figure 7
Figure 7
ROS fluorescence imaging of mGO and UP water control embryos. After DCF-DA incubation for 30 min, 6 hpf embryos were exposed to 50 μg/mL mGO or UP water and imaged every 10 min. (A) Representative embryo in UP water. The embryo oriented itself so that yolk sac was no longer visible after 83 min post-exposure. (B) Embryos exposed to mGO. Observed accumulation of GO particles on the surface of the embryo. Yolk content loss is visible in later timepoints of the images. (C) Another embryo exposed to mGO. We can see the accumulation of GO particles on the surface of the embryo. t = minutes post-exposure.
Figure 8
Figure 8
UP + mGO toxicity compared to FBS + mGO toxicity for 26 hpf. Red bars indicate the percent viability for the embryos that were exposed to mGO alone; orange bars indicate the percent viability for mGO + 4% FBS-exposed embryo. Concentrations found below the UP and FBS groups indicate the increasing mGO concentration in the solution (0 μg/mL, 2.32 μg/mL, 5 μg/mL, 10.7 μg/mL, 23.2 μg/mL, 50 μg/mL). Minor lines on the y-axis indicate a 5% change. (A) There was a significant difference between the mGO-only group and the FBS + mGO group at the highest concentration (50 μg/mL) 1 h post-exposure (7 hpf). (B) The 32 hpf magnifies the trends that were starting to appear at 7 hpf. As observed in the range-finding portion of this study, 10.7 μg/mL was the LEL in the embryos exposed to mGO only. On the other hand, this effect was not reflected in the embryos exposed to the FBS mixture. *: p ≤ 0.01. **: p ≤ 0.001.

References

    1. Zhu Y., Murali S., Cai W., Li X., Suk J.W., Potts J.R., Ruoff R.S. Graphene and Graphene Oxide: Synthesis, Properties, and Applications. Adv. Mater. 2010;22:3906–3924. doi: 10.1002/adma.201001068. - DOI - PubMed
    1. Park S., Ruoff R.S. Chemical Methods for the Production of Graphenes. Nat. Nanotechnol. 2009;4:217–224. doi: 10.1038/nnano.2009.58. - DOI - PubMed
    1. Parviz D., Strano M. Endotoxin-Free Preparation of Graphene Oxide and Graphene-Based Materials for Biological Applications. Curr. Protoc. Chem. Biol. 2018;10:e51. doi: 10.1002/cpch.51. - DOI - PMC - PubMed
    1. Kim J., Cote L.J., Huang J. Two Dimensional Soft Material: New Faces of Graphene Oxide. Acc. Chem. Res. 2012;45:1356–1364. doi: 10.1021/ar300047s. - DOI - PubMed
    1. Robinson J.T., Perkins F.K., Snow E.S., Wei Z., Sheehan P.E. Reduced Graphene Oxide Molecular Sensors. Nano Lett. 2008;8:3137–3140. doi: 10.1021/nl8013007. - DOI - PubMed

LinkOut - more resources