. 2022 Apr 1;11(7):1972.
doi: 10.3390/jcm11071972.

Radiomics-Based Image Phenotyping of Kidney Apparent Diffusion Coefficient Maps: Preliminary Feasibility & Efficacy

Affiliations

Radiomics-Based Image Phenotyping of Kidney Apparent Diffusion Coefficient Maps: Preliminary Feasibility & Efficacy

Lu-Ping Li et al. J Clin Med. .

Abstract

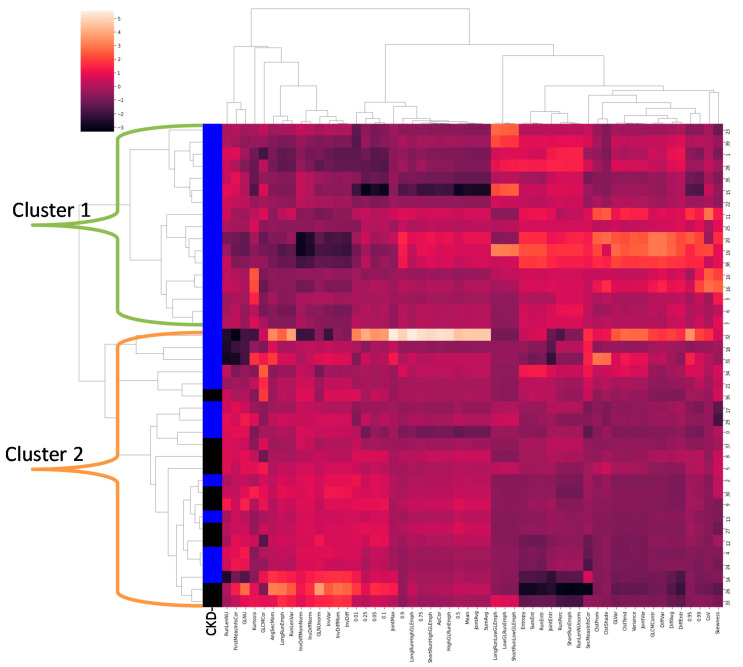
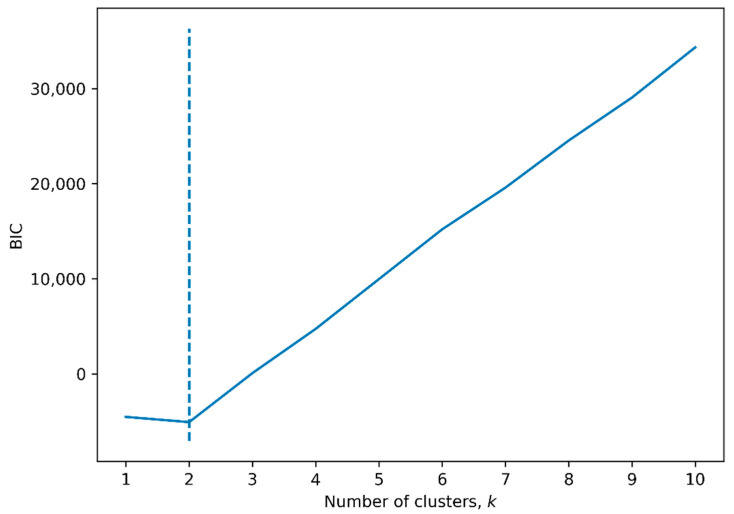
Given the central role of interstitial fibrosis in disease progression in chronic kidney disease (CKD), a role for diffusion-weighted MRI has been pursued. We evaluated the feasibility and preliminary efficacy of using radiomic features to phenotype apparent diffusion coefficient (ADC) maps and hence to the clinical classification(s) of the participants. The study involved 40 individuals (10 healthy and 30 with CKD (eGFR < 60 mL/min/1.73 m2)). Machine learning methods, such as hierarchical clustering and logistic regression, were used. Clustering resulted in the identification of two clusters, one including all individuals with CKD (n = 17), while the second one included all the healthy volunteers (n = 10) and the remaining individuals with CKD (n = 13), resulting in 100% specificity. Logistic regression identified five radiomic features to classify participants as with CKD vs. healthy volunteers, with a sensitivity and specificity of 93% and 70%, respectively, and an AUC of 0.95. Similarly, four radiomic features were able to classify participants as rapid vs. non-rapid CKD progressors among the 30 individuals with CKD, with a sensitivity and specificity of 71% and 43%, respectively, and an AUC of 0.75. These promising preliminary data should support future studies with larger numbers of participants with varied disease severity and etiologies to improve performance.

Keywords: ADC; CKD; MRI; diffusion-weighted imaging; kidney; radiomic.


Conflict of interest statement

A.S. reports personal fees from Horizon Therapeutics, PLC, CVS Caremark, AstraZeneca, Bayer, and Tate & Latham (medicolegal consulting). All other authors declare no conflict of interest.

Figures

Figure 1
Figure 1
(A) High-level descriptions of the steps involved in the image analysis pipeline. The dotted lines indicate possible future extension. (B) A flow chart of kidney segmentation, quantitative analysis, and feature extraction using FireVoxel.
Figure 1
Figure 1
(A) High-level descriptions of the steps involved in the image analysis pipeline. The dotted lines indicate possible future extension. (B) A flow chart of kidney segmentation, quantitative analysis, and feature extraction using FireVoxel.
Figure 2
Figure 2
(a) Representative diffusion-weighted image. (b) Manually defined regions of interest (ROI) on left and right kidneys. Color identifies ROIs individually on the left and right kidneys. (c) ADC maps within the cortical ROI with color bar generated by FV, indicating relative ADC values in units of mm2/s.
Figure 3
Figure 3
(A) Correlation map of radiomic features. Shown is a color-coded correlation map between all the radiomic features. Only statistically significant (p < 0.05) correlations are displayed. The color coding was based on the Spearman ± ρ values: strong (0.7 to 1.0), moderate (0.3 to 0.7), weak (0 to 0.3), and indicated as positive (pos) or negative (neg). (B) Radiomic feature correlation histogram. Histogram demonstrating the counts of each type of significant correlation.
Figure 3
Figure 3
(A) Correlation map of radiomic features. Shown is a color-coded correlation map between all the radiomic features. Only statistically significant (p < 0.05) correlations are displayed. The color coding was based on the Spearman ± ρ values: strong (0.7 to 1.0), moderate (0.3 to 0.7), weak (0 to 0.3), and indicated as positive (pos) or negative (neg). (B) Radiomic feature correlation histogram. Histogram demonstrating the counts of each type of significant correlation.
Figure 4
Figure 4
Correlation map of radiomic and clinical features. Shown is a color-coded correlation map between radiomic and clinical features. Only statistically significant (p < 0.05) correlations are displayed. There were no significant correlations in the categories of age, sex, diastolic blood pressure, eGFR slope, 24 h urine protein, or blood glucose. Spearman ρ value of correlations is displayed. The color coding was based on the Spearman ± ρ values; however, all correlations were moderate (0.3 to 0.7) and indicated as positive (pos) or negative (neg). Abbreviations: CKD: chronic kidney disease; CKD-EPI: CKD Epidemiology Collaboration; eGFR: estimated glomerular filtration rate; SBP: systolic blood pressure; BMI: body mass index.
Figure 5
Figure 5
Hierarchical clustering of radiomic features. Shown are Z-score normalized values of each individual radiomic feature in each column, with each participant as a unique row. The first column represents the presence (blue) or absence (black) of CKD in the subject. The clustering shows two distinct phenotypes. Phenotype 1 (Cluster 1) can be identified as CKD, while phenotype 2 (Cluster 2) includes both CKD and controls, possibly indicating early changes. Cluster 1 had more negative Z-scores (darker red) in many of the first 29 feature columns and more positive Z-scores (lighter red) in the following 25 feature columns.
Figure 6
Figure 6
BIC for number of clusters in a GMM. Shown is the Bayesian information criterion (BIC) versus the number of clusters in a Gaussian mixture model (GMM). The dotted line indicates the minimum BIC at two clusters.

References

    1. CDC . Chronic Kidney Disease in the United States. Centers for Disease Control and Prevention; Atlanta, GA, USA: 2021.
    1. Levey A.S., Eckardt K.-U., Dorman N.M., Christiansen S.L., Hoorn E.J., Ingelfinger J.R., Inker L.A., Levin A., Mehrotra R., Palevsky P.M., et al. Nomenclature for kidney function and disease: Report of a Kidney Disease: Improving Global Outcomes (KDIGO) Consensus Conference. Kidney Int. 2020;97:1117–1129. doi: 10.1016/j.kint.2020.02.010. - DOI - PubMed
    1. Srivastava A., Palsson R., Kaze A.D., Chen M.E., Palacios P., Sabbisetti V., Betensky R.A., Steinman T.I., Thadhani R.I., McMahon G.M., et al. The Prognostic Value of Histopathologic Lesions in Native Kidney Biopsy Specimens: Results from the Boston Kidney Biopsy Cohort Study. J. Am. Soc. Nephrol. 2018;29:2213–2224. doi: 10.1681/ASN.2017121260. - DOI - PMC - PubMed
    1. Hall Y.N., Himmelfarb J. The CKD Classification System in the Precision Medicine Era. Clin. J. Am. Soc. Nephrol. 2017;12:346–348. doi: 10.2215/CJN.09310916. - DOI - PMC - PubMed
    1. Caroli A., Schneider M., Friedli I., Ljimani A., De Seigneux S., Boor P., Gullapudi L., Kazmi I., Mendichovszky I.A., Notohamiprodjo M., et al. Diffusion-weighted magnetic resonance imaging to assess diffuse renal pathology: A systematic review and statement paper. Nephrol. Dial. Transplant. 2018;33((Suppl. 2)):ii29–ii40. doi: 10.1093/ndt/gfy163. - DOI - PMC - PubMed