. 2022 Mar 24;15(7):2385.
doi: 10.3390/ma15072385.

Two-Step Geometry Design Method, Numerical Simulations and Experimental Studies of Bioresorbable Stents

Affiliations

Two-Step Geometry Design Method, Numerical Simulations and Experimental Studies of Bioresorbable Stents

Natalia Molęda et al. Materials (Basel). .

Abstract

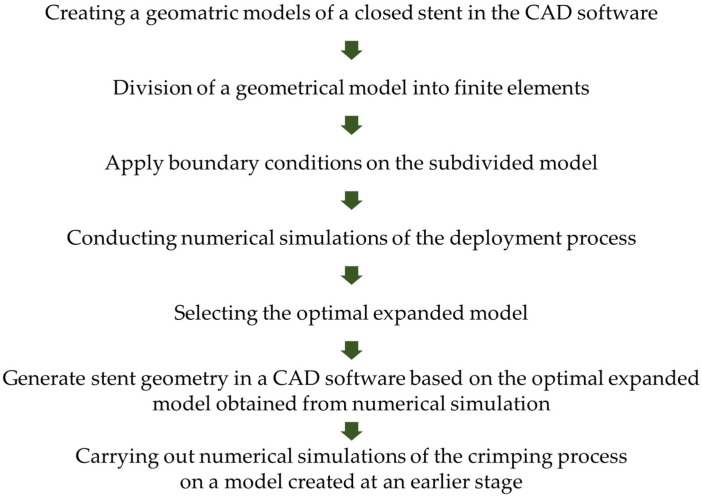
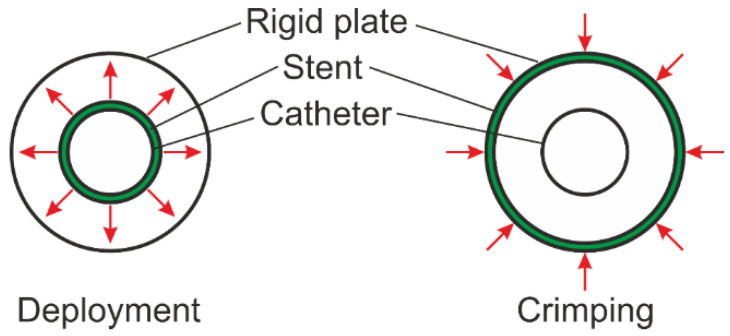
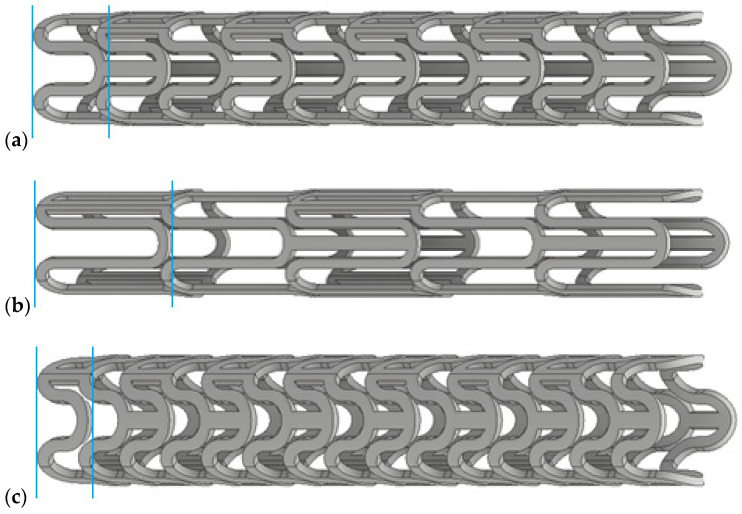
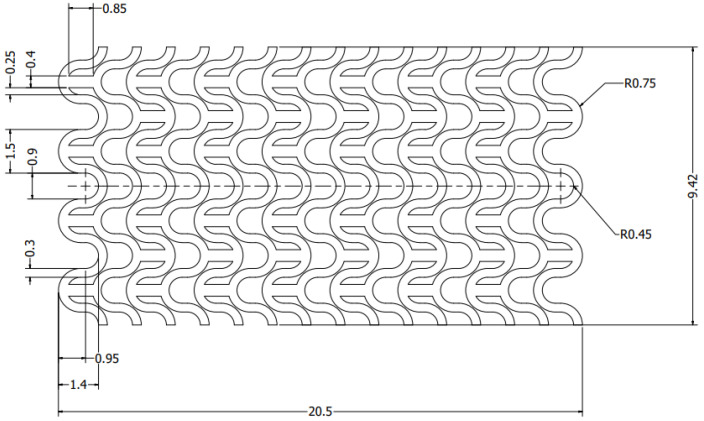
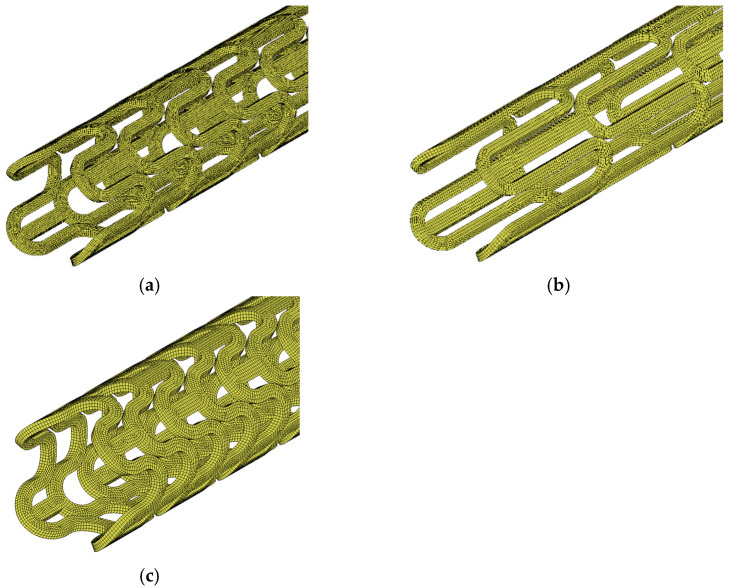
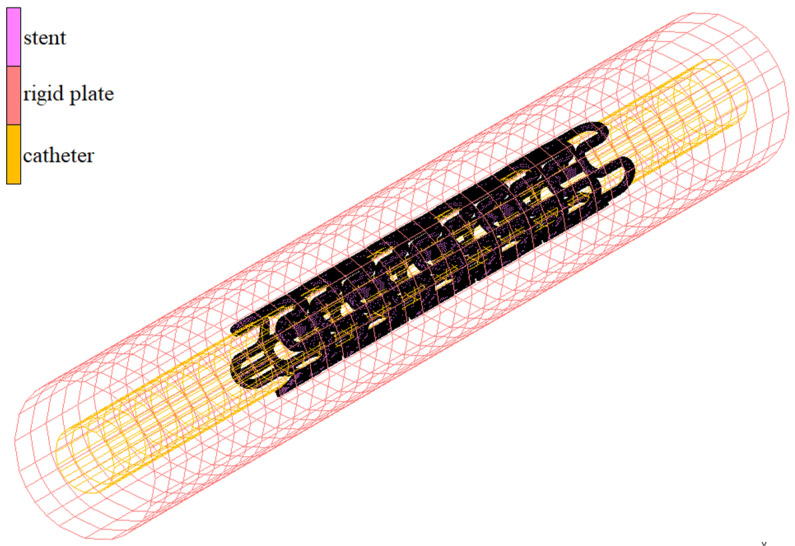
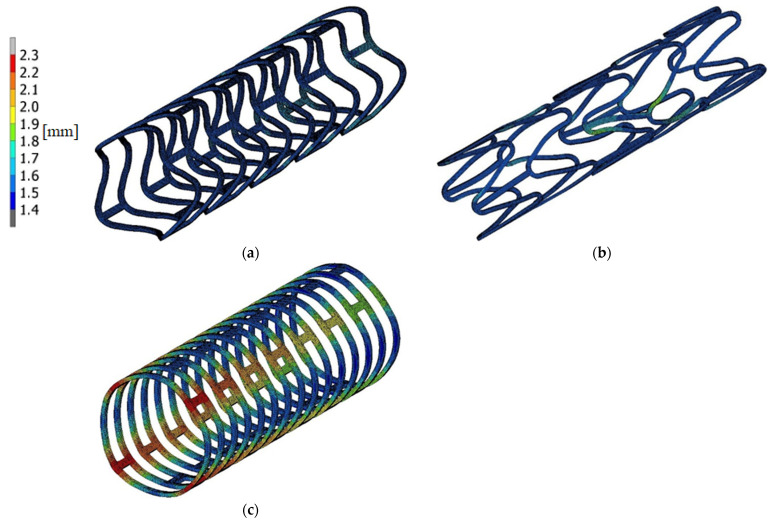
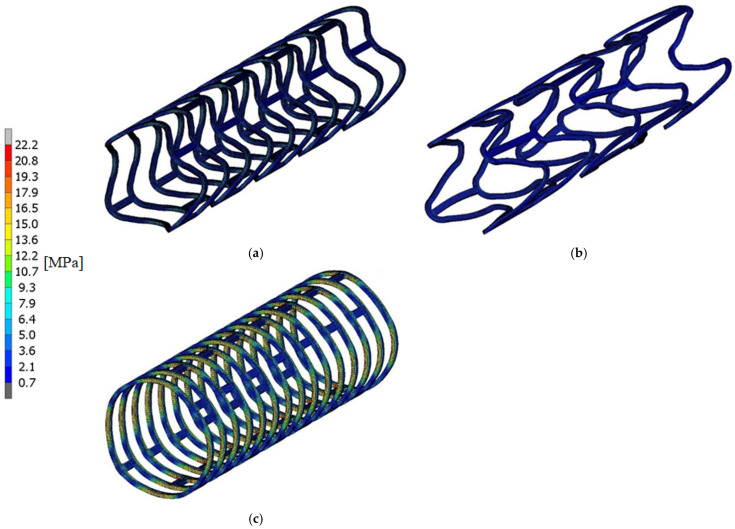
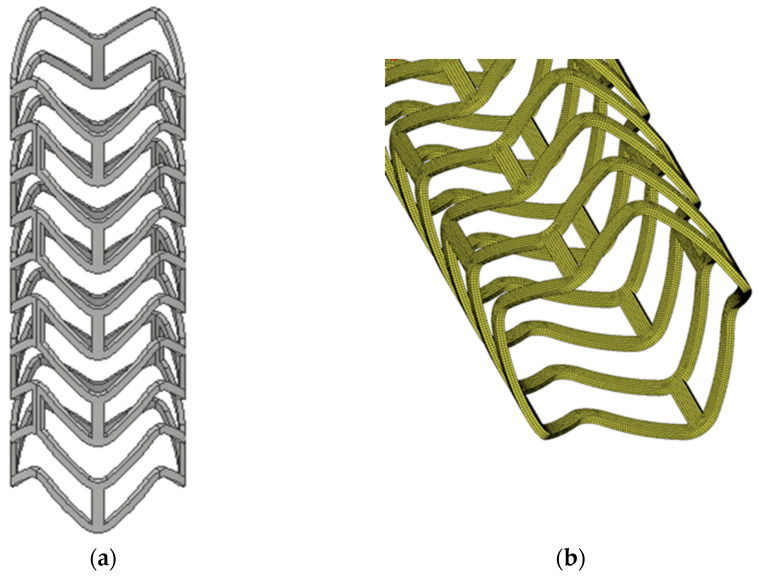
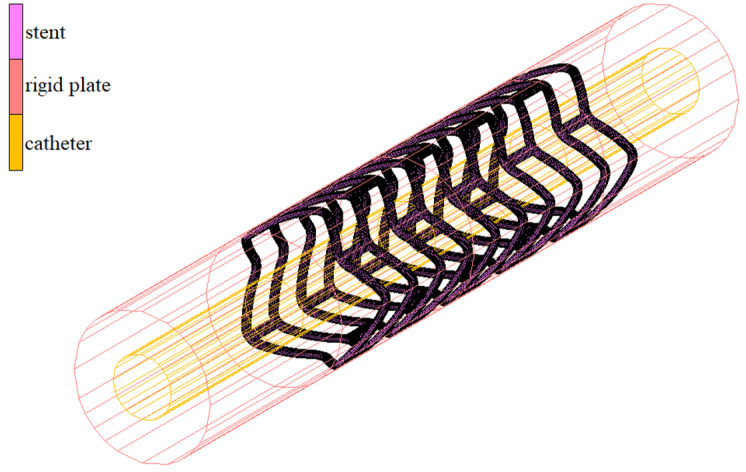
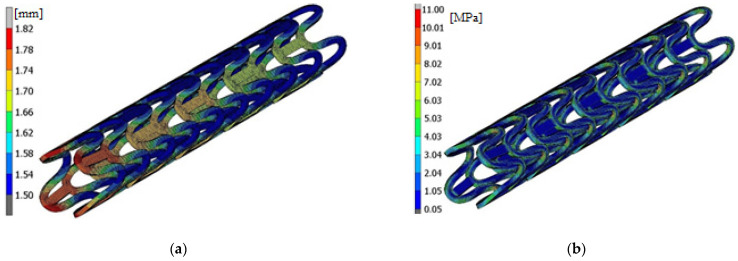
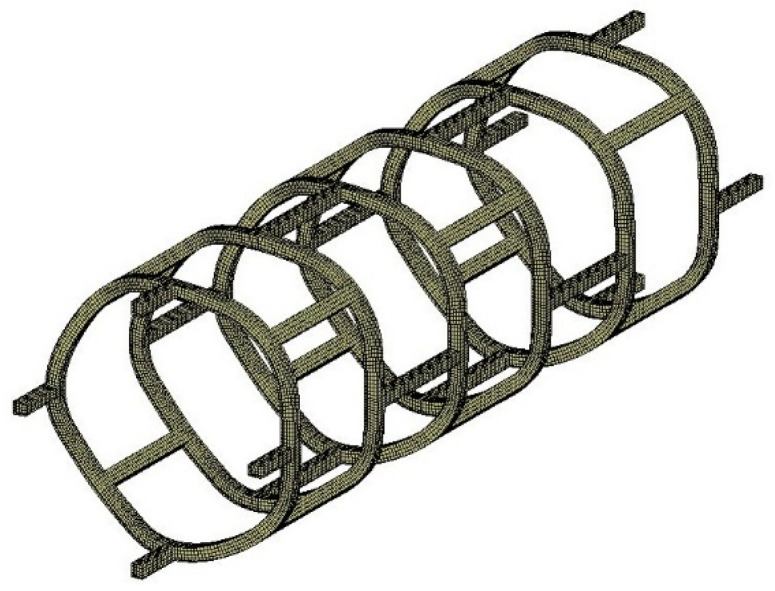
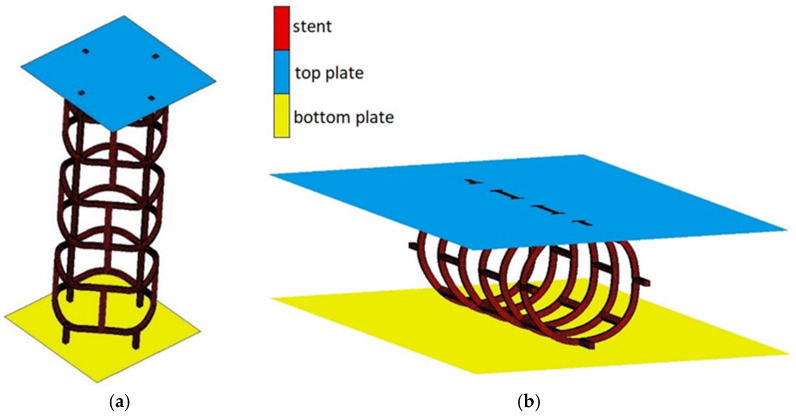
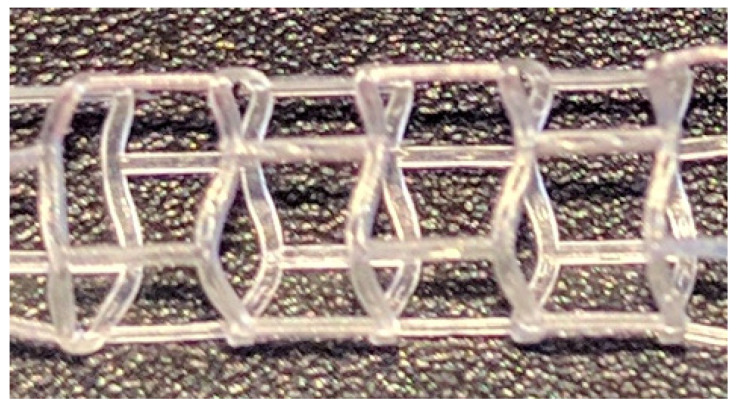
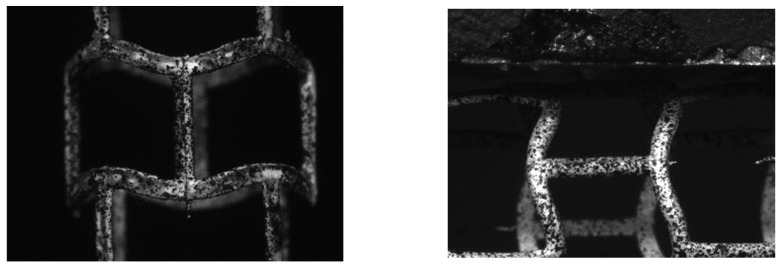
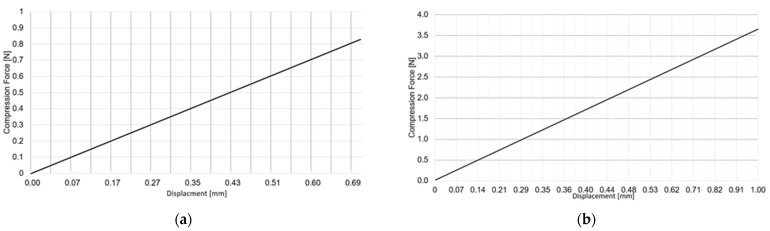
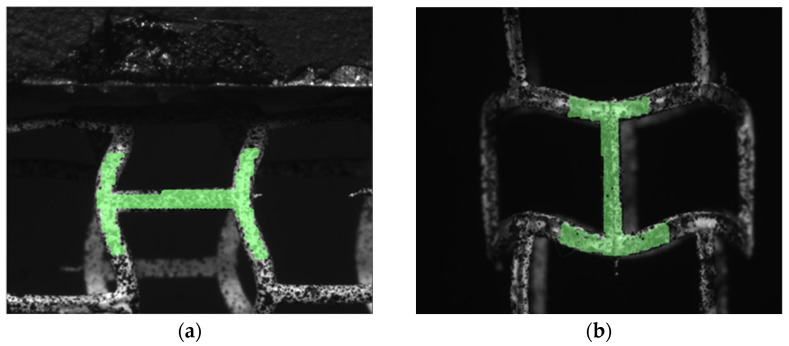
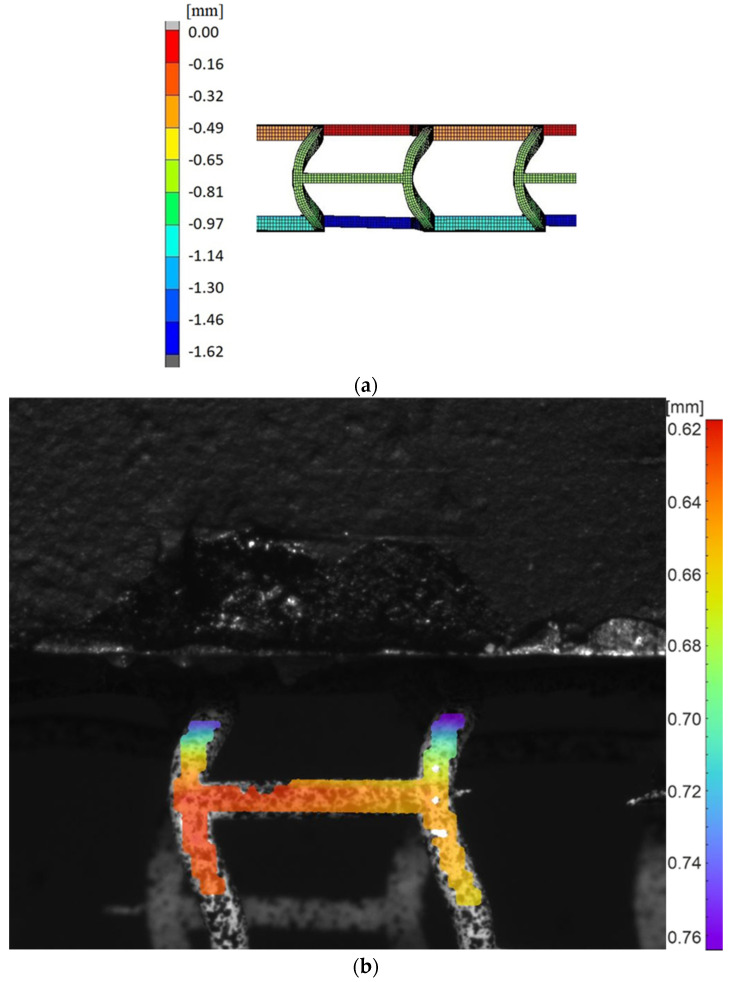
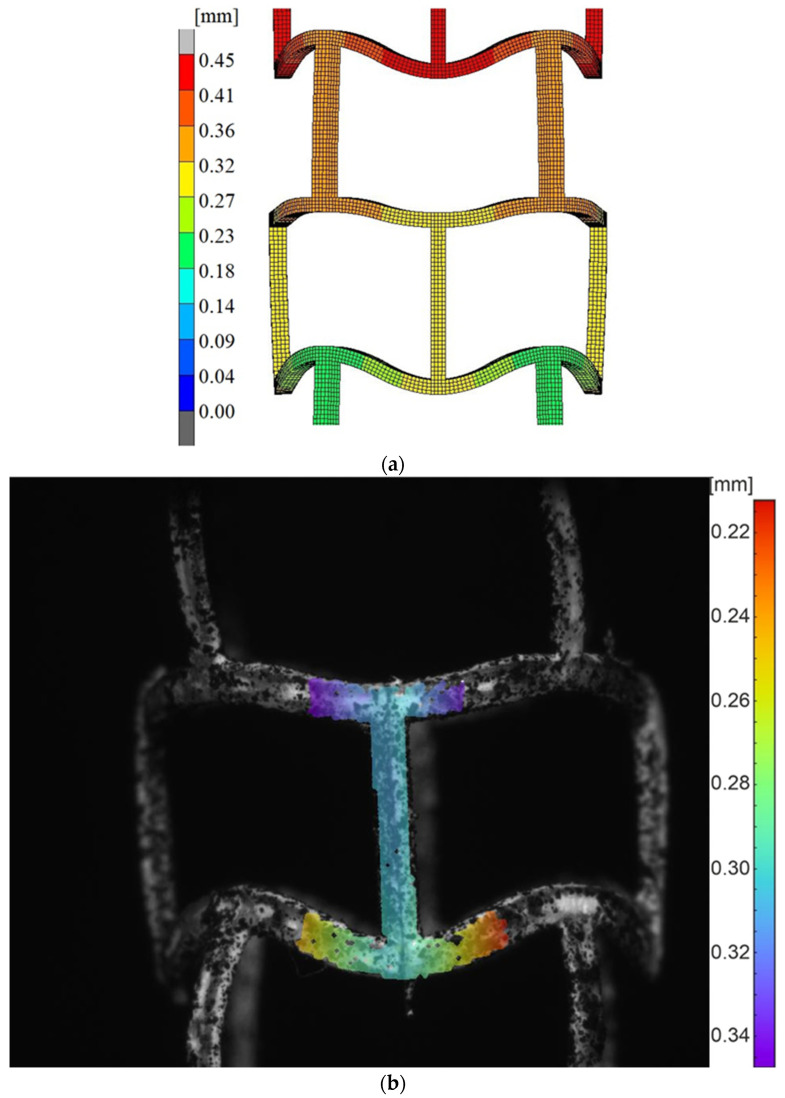
The stent-implantation process during angioplasty procedures usually involves clamping the stent onto a catheter to a size that allows delivery to the place inside the artery. Finding the right geometrical form of the stent to ensure good functionality in the open form and to enable the clamping process is one of the key elements in the stent-design process. In the first part of the work, an original two-step procedure for stent-geometry design was proposed. This was due to the necessary selection of a geometry that would provide adequate support to the blood-vessel wall without causing damage to the vessel. Numerical simulations of the crimping and deployment processes were performed to verify the method. At the end of this stage, the optimal stent was selected for further testing. In addition, numerical simulations of selected experimental tests (catheter-crimping process, compression process) were used to verify the obtained geometrical forms. The results of experimental tests on stents produced by the microinjection method are presented. The digital image correlation (DIC) method was used to compare the results of numerical simulation and experimental tests. The two-step modeling approach was found to help select the appropriate geometry of the expanded stent, which is an extremely important step in the design of the crimping process. In the part of the paper where the results obtained by numerical simulation were compared with those gained by experiment and using the DIC method, a good compatibility of the displacement results can be observed. For both longitudinal and transverse (pinch) stent compression, the results practically coincide. The paper presents also the application of the DIC method which significantly expands the research possibilities, allowing for a detailed inspection of the deformation state and, above all, verification of local dangerous areas. This approach significantly increases the possibility of assessing the quality of the stents.

Keywords: bioresorbable stents; digital image correlation; numerical simulation; two-step modeling.


Conflict of interest statement

The authors declare no conflict of interest.

Figures

Figure 1
Figure 1
Diagram of two-step modeling in a given case.
Figure 2
Figure 2
Diagram presenting the procedure during numerical simulations.
Figure 3
Figure 3
Geometric models of stents, for which crown length is marked between the two sections and is: (a) optimal, (b) too wide, and (c) too narrow.
Figure 4
Figure 4
Sketch of the half of the geometry of the stent.
Figure 5
Figure 5
Discretized models of stents: (a) optimal, (b) too long, (c) too short.
Figure 6
Figure 6
Numerical model for deployment simulation.
Figure 7
Figure 7
The deformation state after deployment for stents: (a) optimal, (b) too long, (c) too short.
Figure 8
Figure 8
Stress state after stent deployment: (a) optimal, (b) too long, (c) too short (von Mises).
Figure 9
Figure 9
The modified stent model after deployment simulation selected for the crimping process: (a) geometry, (b) discretized using finite elements.
Figure 10
Figure 10
Numerical model for crimping simulation.
Figure 11
Figure 11
State after the stent crimping: (a) the deformation, (b) the stress (von Mises).
Figure 12
Figure 12
Prototype geometry after discretization.
Figure 13
Figure 13
Stent compression: (a) longitudinal, (b) transverse.
Figure 14
Figure 14
Model fabricated by microinjection moulding.
Figure 15
Figure 15
Stent model covered with speckle pattern.
Figure 16
Figure 16
Force-displacement diagram for: (a) transverse and (b) longitudinal compression test.
Figure 17
Figure 17
Istra4D DIC masked stents: (a) transversely compressed (pinch), (b) longitudinally compressed.
Figure 18
Figure 18
Displacement maps for transverse compression (pinch): (a) simulated using FEM, (b) measured using DIC.
Figure 19
Figure 19
Displacement maps for longitudinal compression: (a) simulated using FEM, (b) measured using DIC.

Similar articles

References

    1. Lopez A.D., Adair T. Is the long-term decline in cardiovascular-disease mortality in high-income countries over? Evidence from national vital statistics. Int. J. Epidemiol. 2019;48:1815–1823. doi: 10.1093/ije/dyz143. - DOI - PubMed
    1. Benjamin E.J., Blaha M.J., Chiuve S.E., Cushman M., Das S.R., Deo R., de Ferranti S.D., Floyd J., Fornage M., Gillespie C. Heart Disease and Stroke Statistics. Circulation. 2017;135:e146–e603. doi: 10.1161/CIR.0000000000000485. - DOI - PMC - PubMed
    1. Anand R.G., Ventura H.O., Mehra M.R. Is Heart Failure More Prevalent in Patients with Peripheral Arterial Disease? A Meta-Analysis. Congest. Heart Fail. 2007;13:319–322. doi: 10.1111/j.1527-5299.2007.07344.x. - DOI - PubMed
    1. Ouriel K. Peripheral arterial disease. Lancet. 2001;358:1257–1264. doi: 10.1016/S0140-6736(01)06351-6. - DOI - PubMed
    1. Shu J., Santulli G. Update on peripheral artery disease: Epidemiology and evidence-based facts. Atherosclerosis. 2018;275:379–381. doi: 10.1016/j.atherosclerosis.2018.05.033. - DOI - PMC - PubMed

LinkOut - more resources