. 2022 Mar 24;15(7):2395.
doi: 10.3390/ma15072395.

Highly Photostable Carbon Dots from Citric Acid for Bioimaging

Affiliations

Highly Photostable Carbon Dots from Citric Acid for Bioimaging

Federico Fiori et al. Materials (Basel). .

Abstract

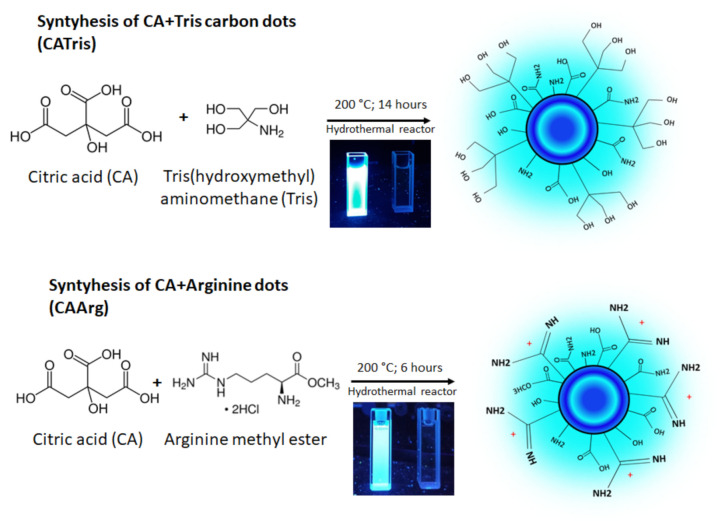
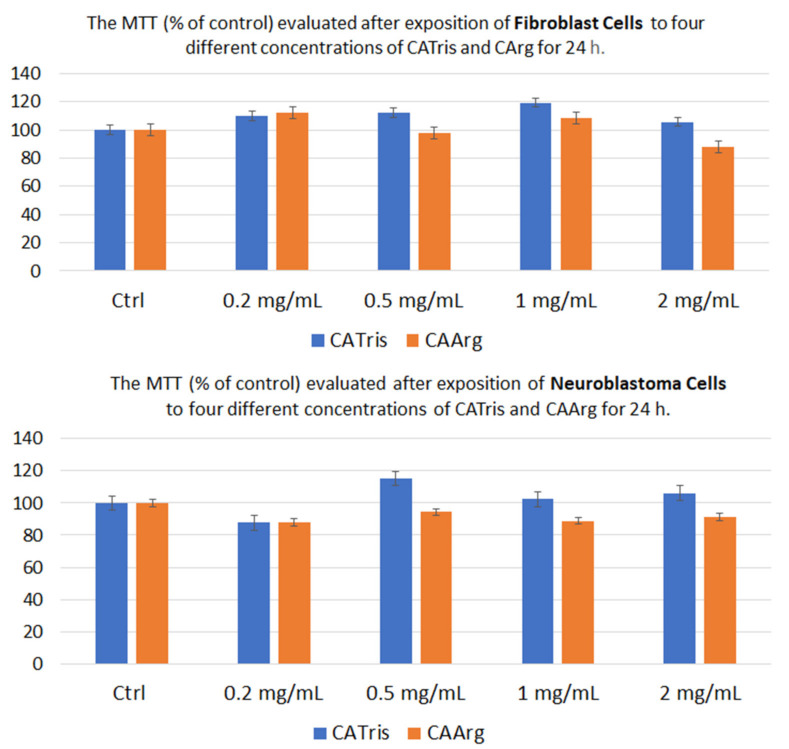
Bioimaging supported by nanoparticles requires low cost, highly emissive and photostable systems with low cytotoxicity. Carbon dots (C-dots) offer a possible solution, even if controlling their properties is not always straightforward, not to mention their potentially simple synthesis and the fact that they do not exhibit long-term photostability in general. In the present work, we synthesized two C-dots starting from citric acid and tris (hydroxymethyl)-aminomethane (tris) or arginine methyl ester dihydrochloride. Cellular uptake and bioimaging were tested in vitro using murine neuroblastoma and ovine fibroblast cells. The C-dots are highly biocompatible, and after 24 h of incubation with the cells, 100% viability was still observed. Furthermore, the C-dots synthesized using tris have an average dimension of 2 nm, a quantum yield of 37%, high photostability and a zeta potential (ζ) around -12 mV. These properties favor cellular uptake without damaging cells and allow for very effective bioimaging.

Keywords: bioimaging; carbon dots; cytotoxicity; photoluminescence.


Conflict of interest statement

The authors declare no conflict of interest.

Figures

Figure 1
Figure 1
Schematic representation of the synthesis of CATris and CAarg.
Figure 2
Figure 2
UV-Vis absorption spectra of CATris (left) and CAArg (right) in aqueous solution.
Figure 3
Figure 3
3D fluorescence spectra (excitation (y-scale), emission (x-scale) and intensity (false colour scale)) of CATris (left) and CAArg (right).
Figure 4
Figure 4
FTIR absorption spectra of CATris (left) and CAArg (right) samples. The spectra of citric acid, Tris and Arg methyl ester are shown for reference.
Figure 5
Figure 5
Photostability under UV exposure for CATris (left) and CAArg (right) carbon dots. The line in CATris represents the exponential decay fit and in CAArg it is a guide for eyes.
Figure 6
Figure 6
Dynamic light scattering analysis of CATris (red) and CAArg (blue) filtered samples.
Figure 7
Figure 7
Fibroblast (top) and Neuroblastoma cells (bottom) from MTT assays with different CATris and CAArg concentrations after 24 h incubation.
Figure 8
Figure 8
Fluorescence confocal microscopy images of fibroblast cells with internalized CATris, at a concentration of 1 and 3 mg mL−1, after 4 and 24 h of incubation under green, blue and red channels. Bottom row: bright field, fluorescence and merged imaging of fibroblast cells with internalized CATris, at a concentration of 1 mg mL−1, after 24 h of incubation. (λex = 400 nm; size 385.5 µm). Some of the cells showing overall uptake of C-dots have been marked with orange arrows for a better understanding of the images.
Figure 9
Figure 9
Fluorescence confocal microscopy images of fibroblast cells with internalized CAArg at a concentration of 1 and 3 mg mL−1 after 4 and 24 h of incubation under green, blue, and red channels. Few black spots as references are indicated with red circles. Bottom row: Bright field, fluorescence and merged imaging of fibroblasts cells with internalized CAArg, at a concentration of 1 mg mL−1, after 24 h of incubation (λex = 400 nm; size 385.5 µm). Some of the cells showing an overall C-dots uptake are marked with orange arrows for a better understanding of the images.
Figure 10
Figure 10
Fluorescence confocal microscopy images of neuroblastoma cells with internalized CATris (left) and CAArg (right), at a concentration of 1 mg mL−1, after 24 h of incubation under merged of green and blue channels (CATris) and green channel (CAArg). (λex = 400 nm; size f85.5 µm). Some of the cells showing an overall uptake of the C-dots are marked with red circles for a better understanding of the images.

References

    1. Li H., Yan X., Kong D., Jin R., Sun C., Du D., Lin Y., Lu G. Recent advances in carbon dots for bioimaging applications. Nanoscale Horiz. 2019;5:218–234. doi: 10.1039/C9NH00476A. - DOI
    1. Zuo P., Lu X., Sun Z., Guo Y., He H. A review on syntheses, properties, characterization and bioanalytical applications of fluorescent carbon dots. Mikrochim. Acta. 2015;183:519–542. doi: 10.1007/s00604-015-1705-3. - DOI
    1. Ansari L., Hallaj S., Hallaj T., Amjadi M. Doped-carbon dots: Recent advances in their biosensing, bioimaging and therapy applications. Colloids Surf. B Biointerfaces. 2021;203:111743. doi: 10.1016/j.colsurfb.2021.111743. - DOI - PubMed
    1. Jiang K., Sun S., Zhang L., Lu Y., Wu A., Cai C., Lin H. Red, Green, and Blue Luminescence by Carbon Dots: Full-Color Emission Tuning and Multicolor Cellular Imaging. Angew. Chem. Int. Ed. 2015;54:5360–5363. doi: 10.1002/anie.201501193. - DOI - PubMed
    1. Shi L., Li Y., Li X., Wen X., Zhang G., Yang J., Dong C., Shuang S. Facile and eco-friendly synthesis of green fluorescent carbon nanodots for applications in bioimaging, patterning and staining. Nanoscale. 2015;7:7394–7401. doi: 10.1039/C5NR00783F. - DOI - PubMed

LinkOut - more resources