A Non-Invasive Hydration Monitoring Technique Using Microwave Transmission and Data-Driven Approaches
- PMID: 35408154
- PMCID: PMC9003514
- DOI: 10.3390/s22072536
A Non-Invasive Hydration Monitoring Technique Using Microwave Transmission and Data-Driven Approaches
Abstract
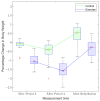
Dehydration in the human body arises due to inadequate replenishment of fluids. An appropriate level of hydration is essential for optimal functioning of the human body, and complications ranging from mild discomfort to, in severe cases, death, could result from a neglected imbalance in fluid levels. Regular and accurate monitoring of hydration status can provide meaningful information for people operating in stressful environmental conditions, such as athletes, military professionals and the elderly. In this study, we propose a non-invasive hydration monitoring technique employing non-ionizing electromagnetic power in the microwave band to estimate the changes in the water content of the whole body. Specifically, we investigate changes in the attenuation coefficient in the frequency range 2-3.5 GHz between a pair of planar antennas positioned across a participant's arm during various states of hydration. Twenty healthy young adults (10M, 10F) underwent controlled hypohydration and euhydration control bouts. The attenuation coefficient was compared among trials and used to predict changes in body mass. Volunteers lost 1.50±0.44% and 0.49±0.54% body mass during hypohydration and euhydration, respectively. The microwave transmission-based attenuation coefficient (2-3.5 GHz) was accurate in predicting changes in hydration status. The corresponding regression analysis demonstrates that building separate estimation models for dehydration and rehydration phases offer better predictive performance (88%) relative to a common model for both the phases (76%).
Keywords: hydration monitoring; hypohydration and euhydration; microwave transmission; non-invasive; regression analysis.
Conflict of interest statement
The authors declare no conflict of interest.
Figures


References
-
- Subudhi A., Askew E., Luetkemeier M. Dehydration. Reference Module in Biomedical Sciences Encyclopedia of Human Nutrition. 3rd ed. Elsevier; Amsterdam, The Netherlands: 2013. pp. 1–9. - DOI
-
- Sawka M., Burke L., Eichner R., Maughan R., Montain S., Stachenfeld N. American College of Sports Medicine exercise and fluid replacement position stand. Med. Sci. Sport. Exerc. 2007;39:377–390. - PubMed
MeSH terms
Substances
Grants and funding
LinkOut - more resources
Full Text Sources
Medical

