. 2022 Mar 29;22(7):2616.
doi: 10.3390/s22072616.

Feature Analysis and Extraction for Specific Emitter Identification Based on the Signal Generation Mechanisms of Radar Transmitters

Affiliations

Feature Analysis and Extraction for Specific Emitter Identification Based on the Signal Generation Mechanisms of Radar Transmitters

Yilin Liu et al. Sensors (Basel). .

Abstract

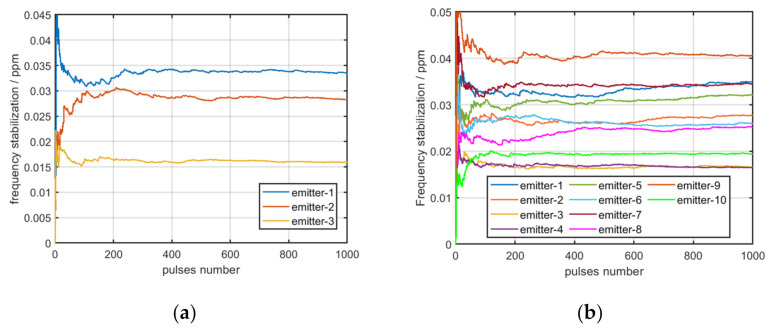
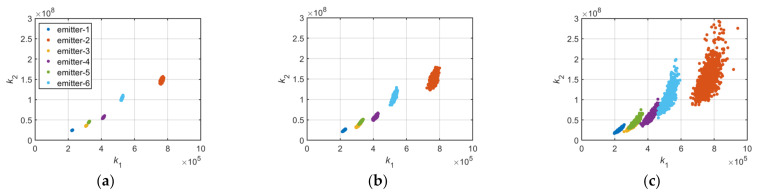
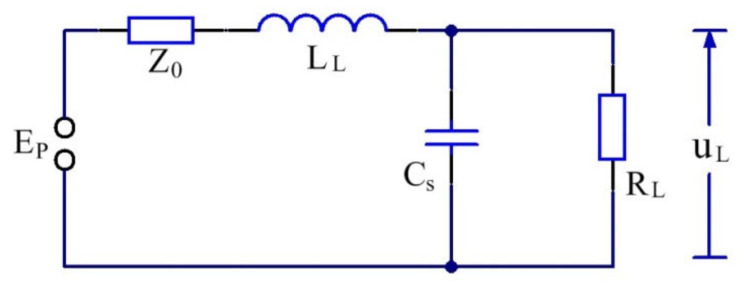
In this study, a feature analysis and extraction method was proposed for specific emitter identification based on the signal generation mechanisms of radar transmitters. The generation of radar signals by radar transmitters was analyzed theoretically and experimentally. In the analysis, the main source of unintentional modulation in radar signals was identified, and the frequency stabilization of the solid-state frequency source, the nonlinear characteristics of the radio frequency amplifier chain, and the envelope of the pulse front edge were extracted as features for specific emitter identification. Subsequently, these characteristics were verified through simulation. The results revealed that the features extracted by this method exhibit "fingerprint characteristics" and can be used to identify specific radar emitters.

Keywords: feature analysis and extraction; radar transmitter; signal generation mechanisms; specific emitter identification.


Conflict of interest statement

The authors declare no conflict of interest.

Figures

Figure 1
Figure 1
Composition of the MOPA transmitter, where the low-power RF signal is generated by the solid-state frequency source and amplified by the RF amplifier chain.
Figure 2
Figure 2
Radar waveform under ideal circumstances.
Figure 3
Figure 3
Composition of the PLL frequency synthesizer, where the reference frequency is generated by the crystal oscillator, and the low-power carrier signal is generated by the VCO; the frequency of the low-power carrier signal is controlled by the phase discriminator.
Figure 4
Figure 4
(a) The value of standard deviation at five different carrier frequencies; (b) the value of frequency stabilization at five different carrier frequencies.
Figure 5
Figure 5
(a) Frequency stabilization of three emitters; (b) frequency stabilization of ten distinct emitters; the x-axis represents the number of pulses used to calculate the standard deviation of the frequency, and the y-axis represents the value of frequency stabilization.
Figure 6
Figure 6
Actual gain curve of the RF amplifier chain.
Figure 7
Figure 7
Frequency spectrum of two distinct emitters.
Figure 8
Figure 8
(a) k1,k2 of two distinct emitters at 30 dB SNR; (b) k1,k2 of two emitters at 20 dB SNR; (c) k1,k2 of two emitters at 10 dB SNR.
Figure 9
Figure 9
Gain curve of the RF amplifier chain of six distinct emitters.
Figure 10
Figure 10
(a) k1,k2 of six distinct emitters at 30 dB SNR; (b) k1,k2 of six distinct emitters at 20 dB SNR; (c) k1,k2 of six distinct emitters at 10 dB SNR.
Figure 11
Figure 11
(a) Mean value of k1,k2 of six distinct emitters at 10 dB SNR (10 pulses in each group); (b) mean value of k1,k2 of six distinct emitters at 10 dB SNR (20 pulses in each group).
Figure 12
Figure 12
Real waveform of the modulated signal.
Figure 13
Figure 13
Envelope of the radar signal.
Figure 14
Figure 14
Equivalent circuit of the pulse modulator at the time of the pulse front edge [26], where Ep is the discharge voltage of energy storage element, Z0 is the impedance of energy storage element, LL is the excitation inductance of pulse transformer, Cs is the distributed capacitance of pulse transformer, and RL is the equivalent impedance of the pulse transformer.
Figure 15
Figure 15
Front edge of the simulation modulation signal.
Figure 16
Figure 16
Envelope of the pulse front edge.
Figure 17
Figure 17
Envelope of the pulse front edge after filtering by downsampling.
Figure 18
Figure 18
(a) Envelope of the pulse front edge at 30 dB SNR; (b) envelope of the pulse front edge at 20 dB SNR; (c) envelope of the pulse front edge at 10 dB SNR.
Figure 19
Figure 19
(a) Mean curves of the envelope at 30 dB SNR; (b) mean curves of the envelope at 20 dB SNR; (c) mean curves of the envelope at 10 dB SNR.
Figure 20
Figure 20
Experimental process.

References

    1. Wang L. On Methods for Specific Radar Emitter Identification. Xidian University; Xi’an, China: 2016.
    1. Zhang G. Research on Emitter Identification. National University of Defense Technology; Changsha, China: 2005.
    1. Yang F. The Feature Extraction of Rader Source and Rader Individual Identification. Xidian University; Xi’an, China: 2017.
    1. Wan T., Fu X., Jiang K., Zhao Y., Tang B. Radar Antenna Scan Pattern Intelligent Recognition Using Visibility Graph. IEEE Access. 2019;7:175628–175641. doi: 10.1109/ACCESS.2019.2957769. - DOI
    1. Guo Q., Yu X., Ruan G. LPI Radar Waveform Recognition Based on Deep Convolutional Neural Network Transfer Learning. Symmetry. 2019;11:540. doi: 10.3390/sym11040540. - DOI

LinkOut - more resources