. 2022 Mar 31;27(7):2274.
doi: 10.3390/molecules27072274.

Bisphenol A Impairs Lipid Remodeling Accompanying Cell Differentiation in the Oligodendroglial Cell Line Oli-Neu

Affiliations

Bisphenol A Impairs Lipid Remodeling Accompanying Cell Differentiation in the Oligodendroglial Cell Line Oli-Neu

Vanessa Naffaa et al. Molecules. .

Abstract

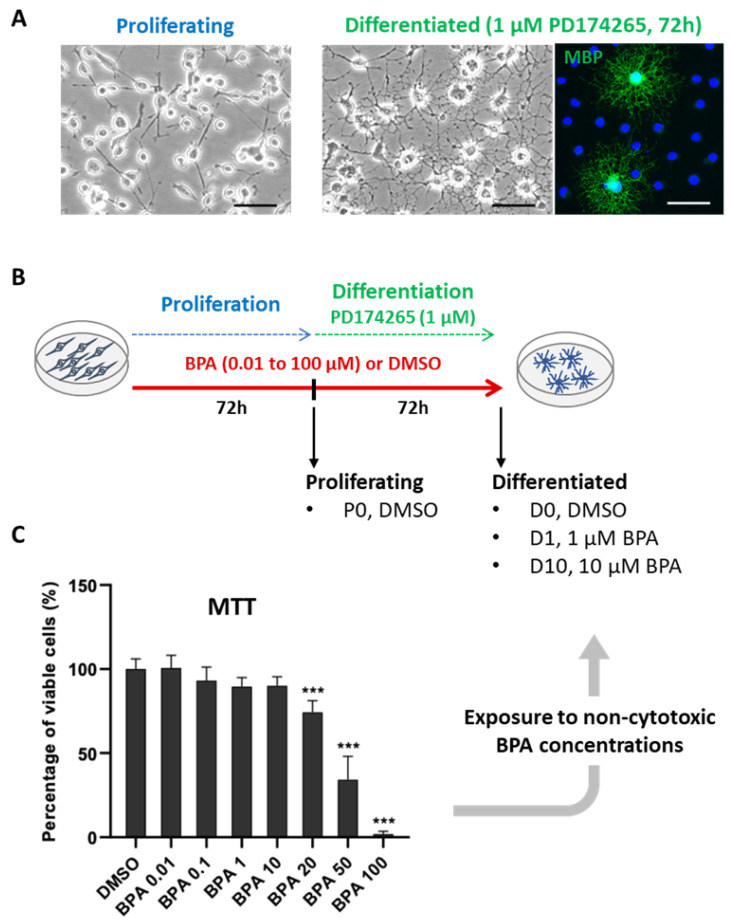
In the central nervous system, the process of myelination involves oligodendrocytes that wrap myelin around axons. Myelin sheaths are mainly composed of lipids and ensure efficient conduction of action potentials. Oligodendrocyte differentiation is an essential preliminary step to myelination which, in turn, is a key event of neurodevelopment. Bisphenol A (BPA), a ubiquitous endocrine disruptor, is suspected to disrupt this developmental process and may, thus, contribute to several neurodevelopmental disorders. In this study, we assessed the effect of BPA on oligodendrocyte differentiation through a comprehensive analysis of cell lipidome by UHPLC-HRMS. For this purpose, we exposed the oligodendroglial cell line Oli-neu to several BPA concentrations for 72 h of proliferation and another 72 h of differentiation. In unexposed cells, significant changes occurred in lipid distribution during Oli-neu differentiation, including an increase in characteristic myelin lipids, sulfatides, and ethanolamine plasmalogens, and a marked remodeling of phospholipid subclasses and fatty acid contents. Moreover, BPA induced a decrease in sulfatide and phosphatidylinositol plasmalogen contents and modified monounsaturated/polyunsaturated fatty acid relative contents in phospholipids. These effects counteracted the lipid remodeling accompanying differentiation and were confirmed by gene expression changes. Altogether, our results suggest that BPA disrupts lipid remodeling accompanying early oligodendrocyte differentiation.

Keywords: bisphenol A; differentiation; lipidomics; oligodendrocyte.


Conflict of interest statement

The authors declare that they have no competing interests.

Figures

Figure 1
Figure 1
Oli-neu morphology, protocol of exposure to BPA and viability assay: ((A), left panel) Proliferating Oli-neu cells displaying bipolar morphology; ((A), right panel) Oli-neu cells displaying ramifications and positive MBP immunostaining in a subset of cells after 72 h of differentiation induced by pharmacological agent PD174265 (1 µM), scale bars 50 µM; (B) protocol of exposure to bisphenol A (BPA) for 72 h of proliferation and 72 h of differentiation. P0— proliferating cells, D0—differentiated control cells, D1—differentiated cells exposed to 1 µM BPA, D10—differentiated cells exposed to 10 µM BPA; (C) cell viability determined by MTT assay (N = 5), results are expressed as mean ± SD percentage of viable cells as compared with the DMSO control (one-way ANOVA and Dunnett multiple comparison post-test, *** p < 0.001).
Figure 2
Figure 2
Myelin gene expression and CNPase immunoreactivity in Oli-neu cells: (A) Gene expression analysis of myelin proteins: myelin basic protein (Mbp), myelin-associated glycoprotein (Mag), 2′,3′-cyclic nucleotide 3′ phosphodiesterase (Cnp), myelin oligodendrocyte glycoprotein (Mog), and proteolipid protein 1 (Plp1), (N = 6–9), relative expression was normalized to reference gene Rpl13a, all groups were compared to D0 control group, (one-way ANOVA and Dunnett multiple comparison post-test, ** p < 0.01, and *** p < 0.001); (B) Western blot of CNPase and actin; (C) CNPase staining by immunocytofluorescence, with DAPI counterstaining. Scale bar, 50 µM. P0—proliferating cells, D0—differentiated control cells, D1—differentiated cells exposed to BPA 1 µM, D10—differentiated cells exposed to BPA 10 µM.
Figure 3
Figure 3
Lipid distribution of Oli-neu cells subjected to differentiation and BPA exposure: (A) Principal component analysis of proliferation (P0) and differentiated groups (D0, D1, and D10); (B) heatmap representing all studied lipid subclasses in proliferation (P0) and differentiation (D0, D1, and D10) groups (N = 6), created using the MetaboAnalyst 5.0 Software default parameters and Supplementary Table S4; (C) stacked bars representing percentages of fatty acid side chain distribution in phospholipids. P0—proliferating cells, D0—differentiated control cells, D1—differentiated cells exposed to BPA 1 µM, D10—differentiated cells exposed to BPA 10 µM, SFA—saturated fatty acid, MUFA—monounsaturated fatty acid, PUFA—polyunsaturated fatty acid. All groups were compared to D0 control group and expressed in percentages, as mean ± SD (multiple t-test, * p < 0.05, ** p < 0.01, and *** p < 0.001).
Figure 4
Figure 4
Gene expression of enzymes of lipid metabolism in Oli-neu cells: Gene expression analysis of sphingolipid metabolism (upper panel) and fatty acid elongation (lower panel): cerebroside sulfotransferase enzyme (Gal3st1), serine palmitoyltransferase long chain base subunit 1 (Sptlc1), serine palmitoyltransferase long chain base subunit 2 (Sptlc2), arylsulfatase A (Arsa), galactosylceramidase (Galc), sphingomyelin synthase 1 (Sgms1), sphingomyelin synthase 2 (Sgms2), UDP-glucose ceramide glucosyltransferase (Ugcg), glucosylceramidase beta (Gba), glucosylceramidase beta 2 (Gba2), UDP-galactosyltransferase (Ugt8a), sphingomyelin phosphodiesterase 1 (Smpd1), sphingomyelin phosphodiesterase 2 (Smpd2), elongases 1 to 7 (Elovl1 to 7). P0—proliferating cells, D0—differentiated control cells, D1—differentiated cells exposed to BPA 1 µM, D10—differentiated cells exposed to BPA 10 µM. N = 6–9, relative expression was normalized to reference gene Rpl13a, all groups were compared to D0 control group, (one-way ANOVA and Dunnett multiple comparison post-test, * p < 0.05, ** p < 0.01, and *** p < 0.001).
Figure 5
Figure 5
Impact of BPA on sphingolipid metabolism. Adapted from [19,20]: Genes impacted by exposure to BPA 10 µM according to RT-qPCR analysis: serine palmitoyltransferase long chain base subunit 2 (Sptlc2), arylsulfatase A (Arsa), galactosylceramidase (Galc), sphingomyelin synthase 1 (Sgms1), sphingomyelin synthase 2 (Sgms2), UDP-glucose ceramide glucosyltransferase (Ugcg), glucosylceramidase beta (Gba), glucosylceramidase beta 2 (Gba2), UDP-galactosyltransferase (Ugt8a), sphingomyelin phosphodiesterase 1 (Smpd1), sphingomyelin phosphodiesterase 2 (Smpd2) (one-way ANOVA and Dunnett multiple comparison post-test, * p < 0.05, ** p < 0.01, and *** p < 0.001).

References

    1. Vandenberg L.N. Non-Monotonic Dose Responses in Studies of Endocrine Disrupting Chemicals: Bisphenol a as a Case Study. Dose Response. 2014;12:259–276. doi: 10.2203/dose-response.13-020.Vandenberg. - DOI - PMC - PubMed
    1. Masuo Y., Ishido M. Neurotoxicity of Endocrine Disruptors: Possible Involvement in Brain Development and Neurodegeneration. J. Toxicol. Environ. Health B Crit. Rev. 2011;14:346–369. doi: 10.1080/10937404.2011.578557. - DOI - PubMed
    1. Naffaa V., Laprévote O., Schang A.-L. Effects of Endocrine Disrupting Chemicals on Myelin Development and Diseases. Neurotoxicology. 2021;83:51–68. doi: 10.1016/j.neuro.2020.12.009. - DOI - PubMed
    1. Grandjean P., Landrigan P.J. Neurobehavioural Effects of Developmental Toxicity. Lancet Neurol. 2014;13:330–338. doi: 10.1016/S1474-4422(13)70278-3. - DOI - PMC - PubMed
    1. WHO WHO|State of the Science of Endocrine Disrupting Chemicals. 2012. [(accessed on 30 March 2022)]. Available online: https://www.who.int/publications/i/item/state-of-the-science-of-endocrin....