. 2022 Mar 25;23(7):3590.
doi: 10.3390/ijms23073590.

Comparison of the Cisterna Maturation-Progression Model with the Kiss-and-Run Model of Intra-Golgi Transport: Role of Cisternal Pores and Cargo Domains

Affiliations

Comparison of the Cisterna Maturation-Progression Model with the Kiss-and-Run Model of Intra-Golgi Transport: Role of Cisternal Pores and Cargo Domains

Galina V Beznoussenko et al. Int J Mol Sci. .

Abstract

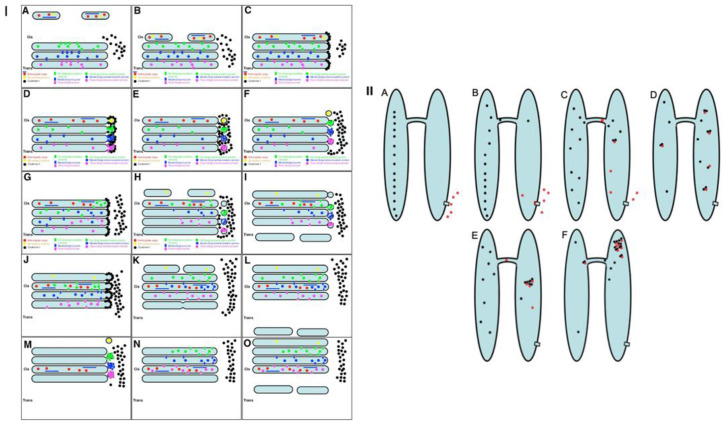
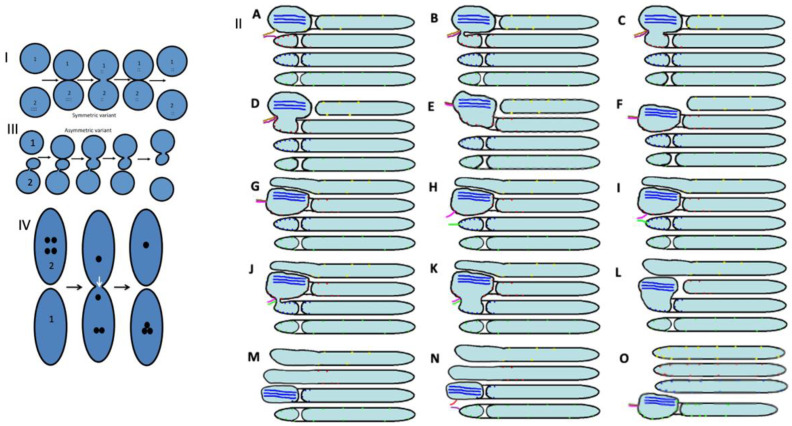
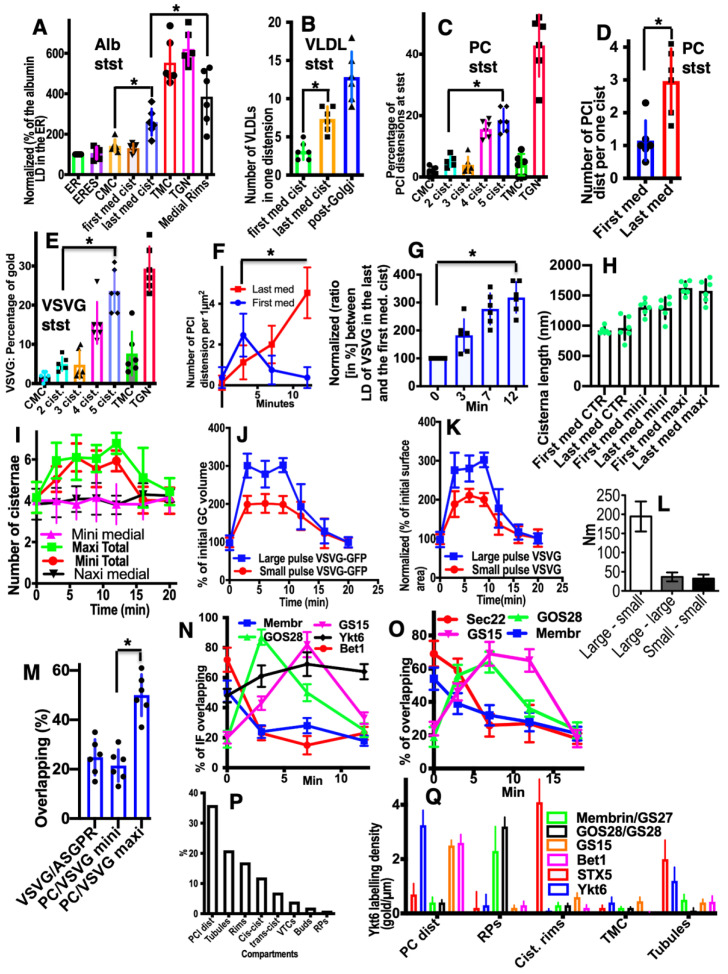
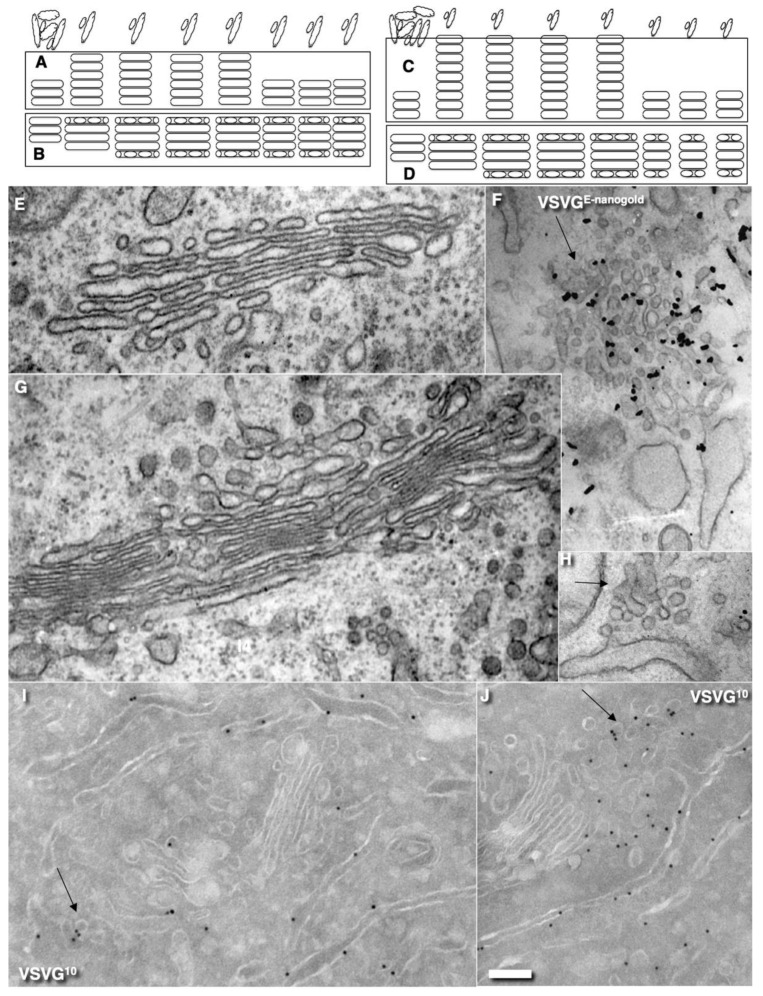
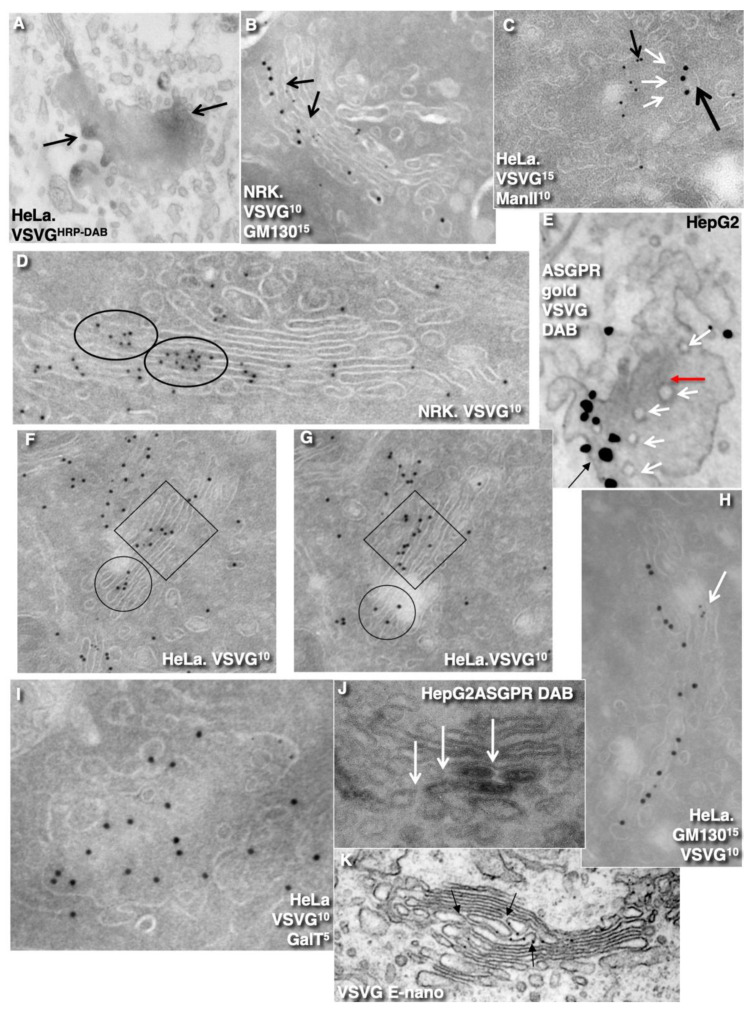
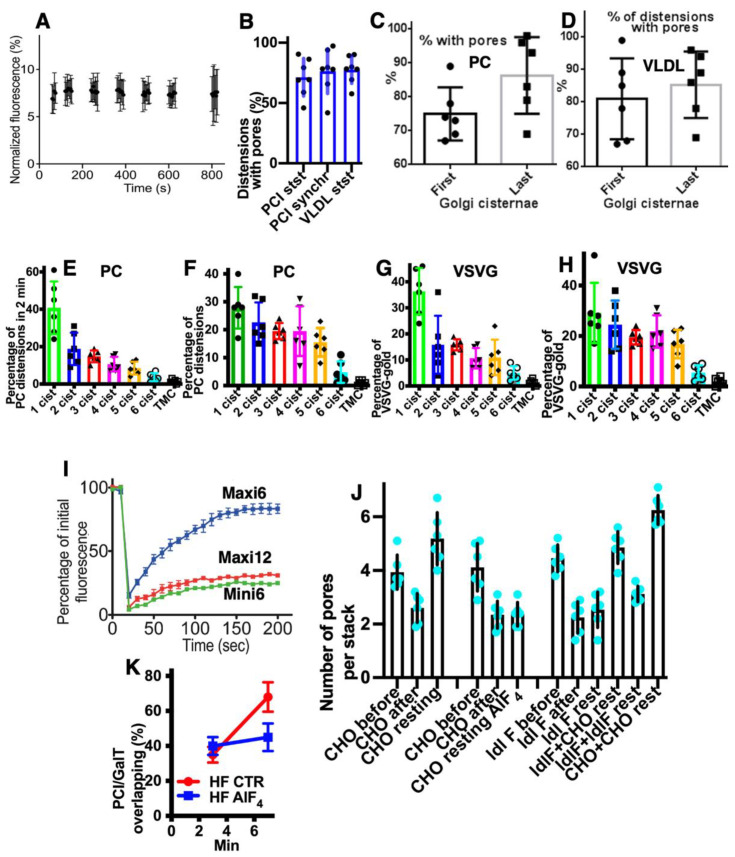
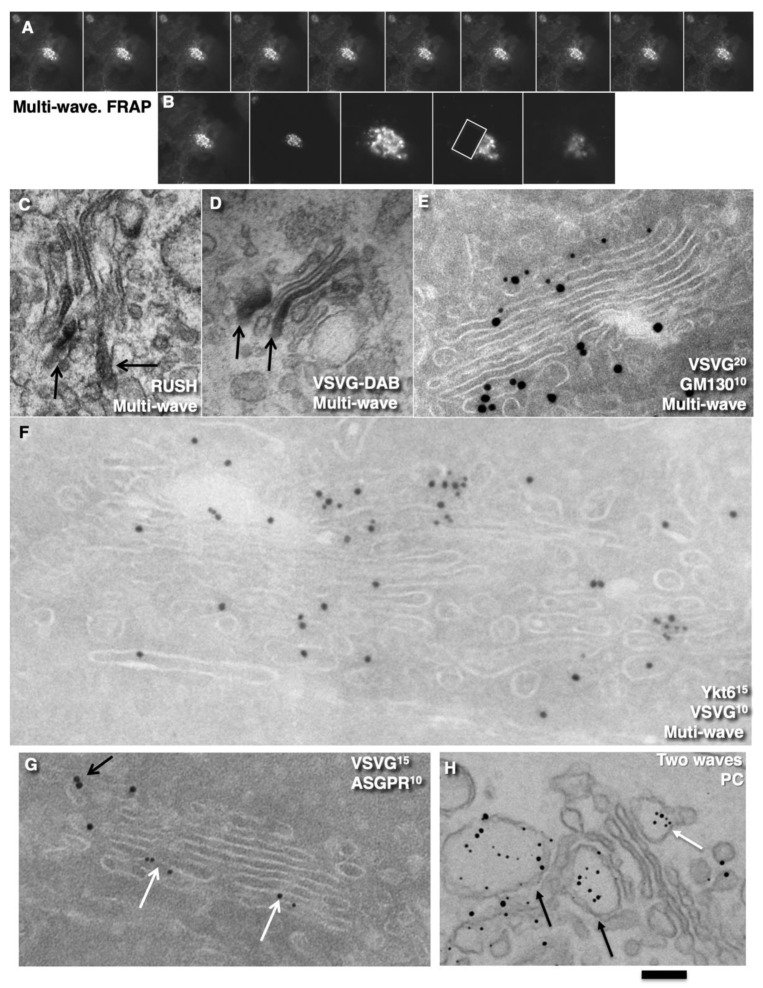
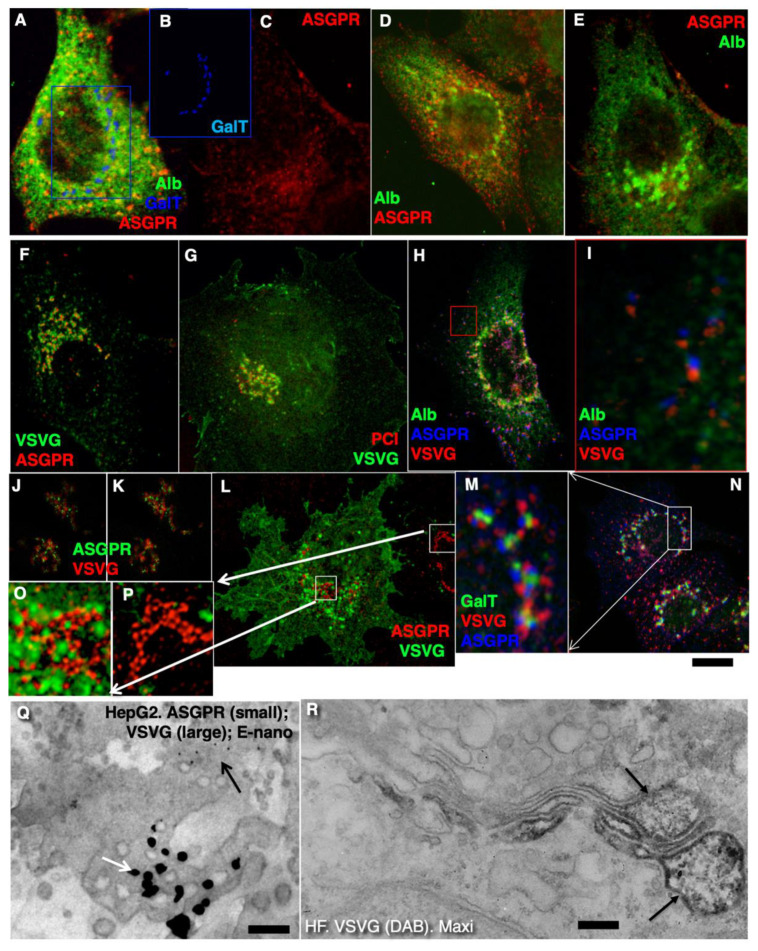
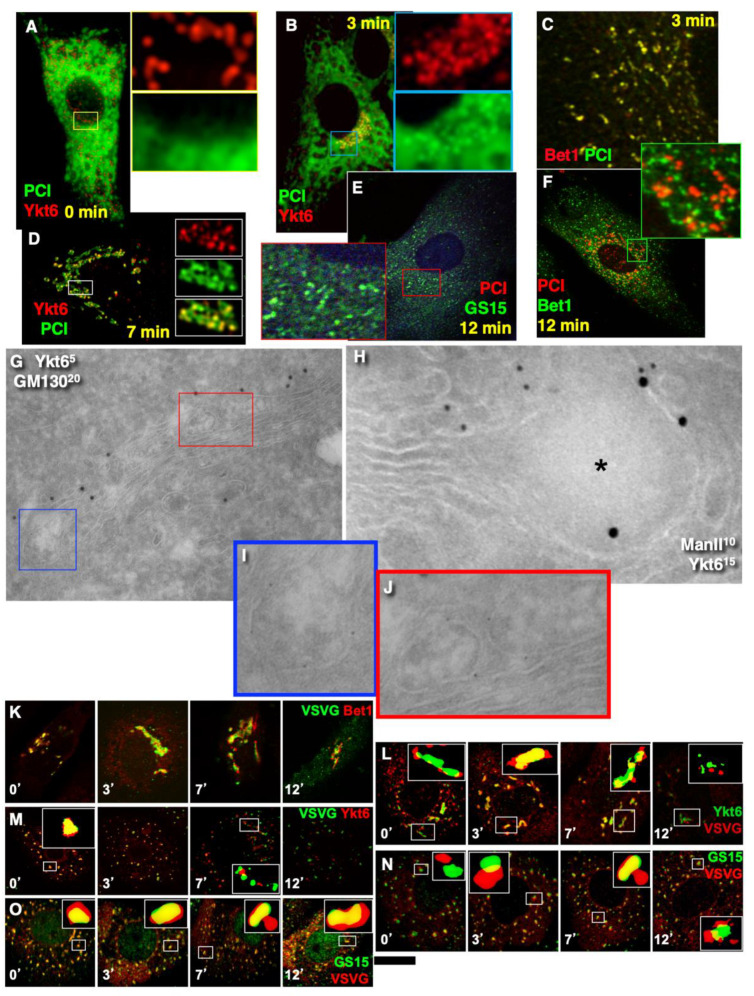
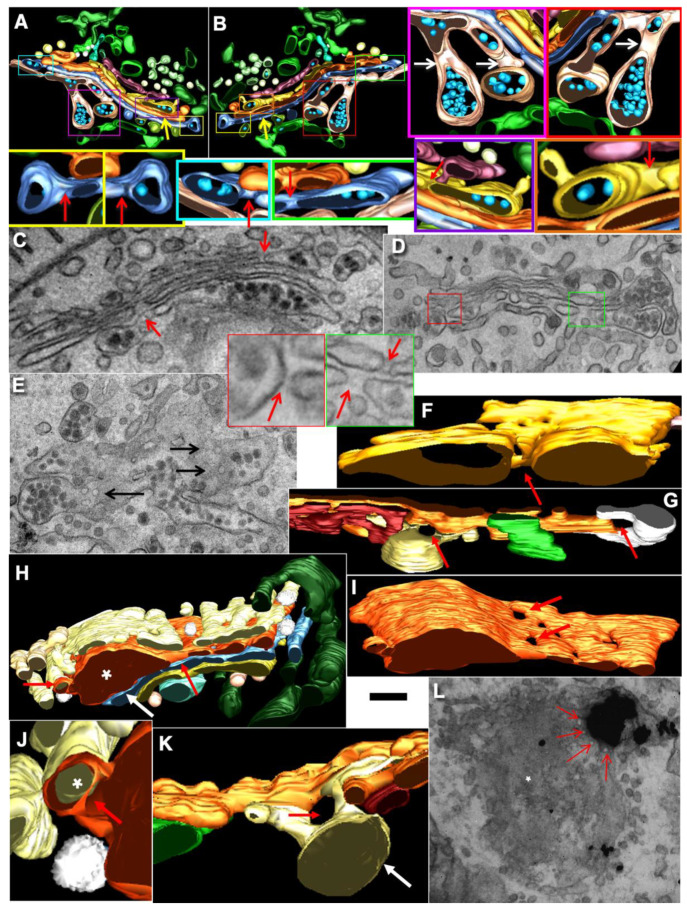
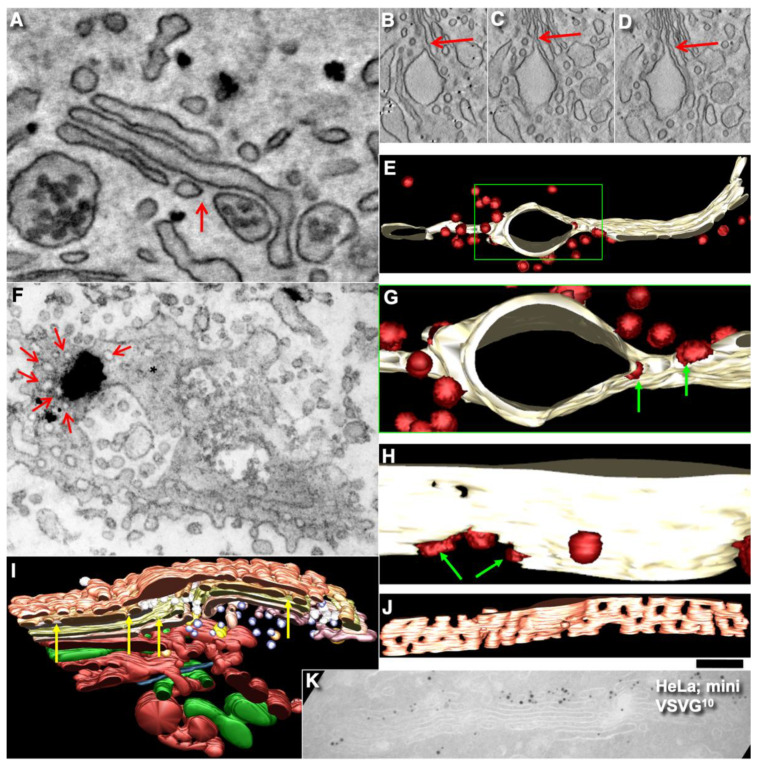
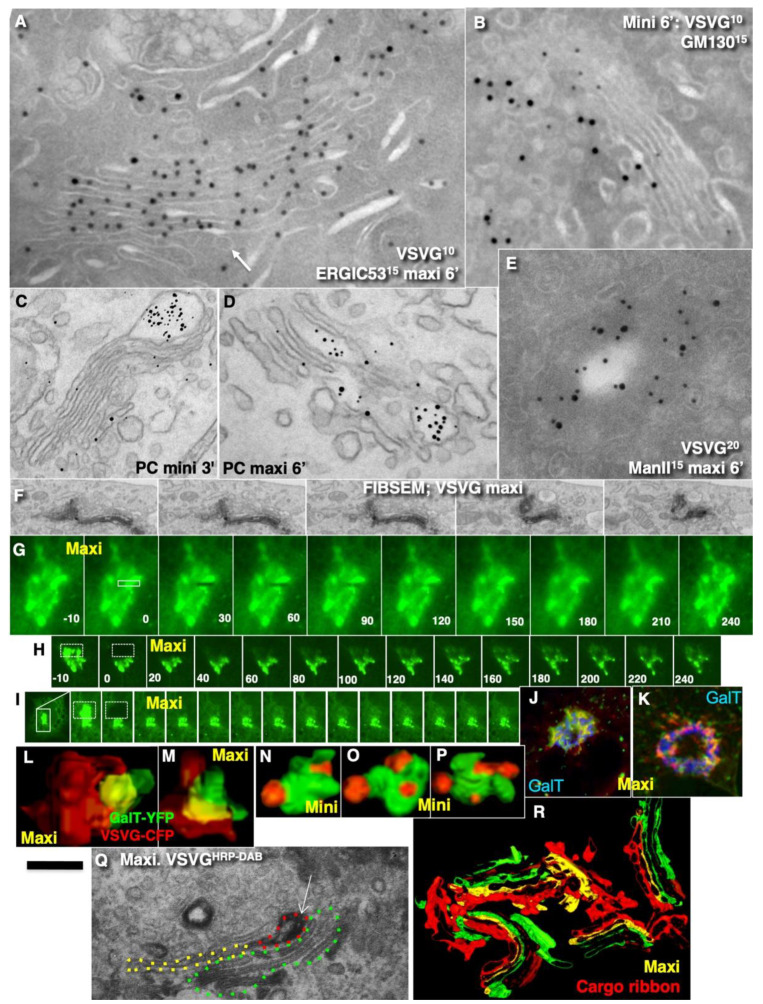
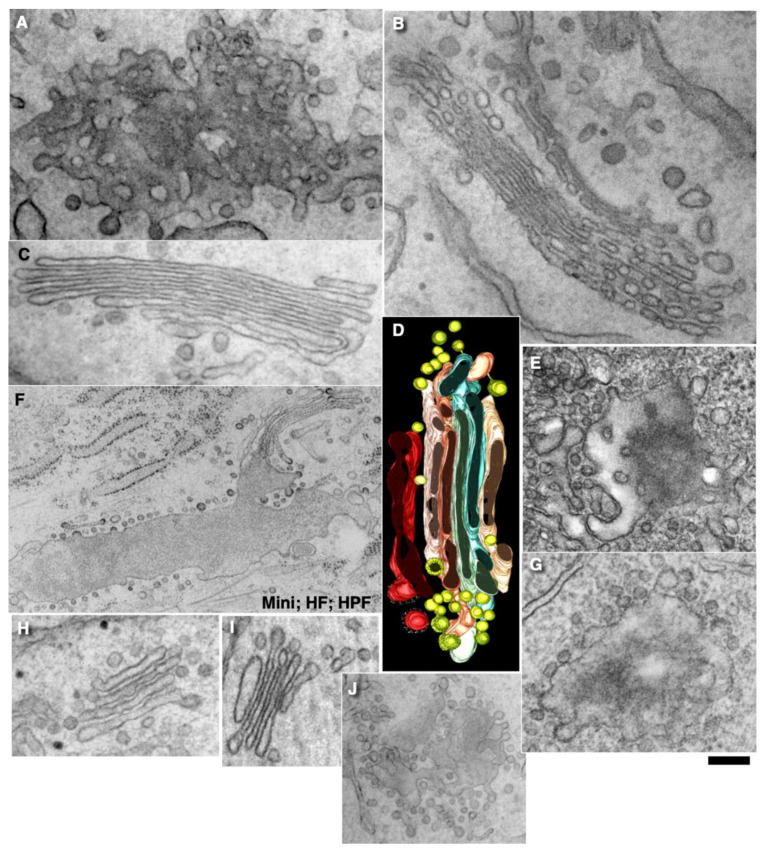
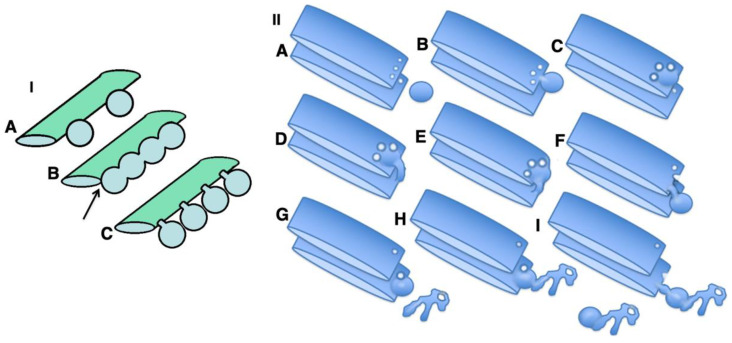
The Golgi complex is the central station of the secretory pathway. Knowledge about the mechanisms of intra-Golgi transport is inconsistent. Here, we compared the explanatory power of the cisterna maturation-progression model and the kiss-and-run model. During intra-Golgi transport, conventional cargoes undergo concentration and form cisternal distensions or distinct membrane domains that contain only one membrane cargo. These domains and distension are separated from the rest of the Golgi cisternae by rows of pores. After the arrival of any membrane cargo or a large cargo aggregate at the Golgi complex, the cis-Golgi SNAREs become enriched within the membrane of cargo-containing domains and then replaced by the trans-Golgi SNAREs. During the passage of these domains, the number of cisternal pores decreases. Restoration of the cisternal pores is COPI-dependent. Our observations are more in line with the kiss-and-run model.

Keywords: COPI; Golgi complex; Golgi dynamics; SNAREs; intracellular traffic; membrane fusion.


Conflict of interest statement

The authors declare that they have no conflict of interest. This article does not contain any study with humans, which was performed by the authors.

Figures

Figure 1
Figure 1
Schemes of intra-Golgi transport (IGT). ((I): (AO)) Mechanisms of IGT according to the cisterna maturation–progression model of intracellular Golgi transport (CMPM; see Movie S1). (A) Two ER-Golgi carriers (EGCs) are shown in the upper part of the Figure. They contain mega-cargo (blue lines) and soluble secreftory cargo (red dots). (B) These carriers arrive on the opposite side of the Golgi complex. (C) The EGCs fuse and form a new cis-cisterna that contains these mega- and soluble cargoes. Coatomer I (black dots) forms coats on cisternal rims. (D) Formation of COPI-coated buds on rims of all of the Golgi cisternae. These buds are enriched in Golgi glycosylation enzymes corresponding to the positions of the cisternae on which they are formed. (E) Division of the copy-covered kidneys. During division, these buds turn into ‘bubbles’ enriched with Golgi enzymes and then undergo coat removal. (F) Fusion of COPI-dependent vesicles with proximal cisterna. Recycling of Golgi enzymes into the corresponding proximal cisterna. (G) Attachment of COPI to the rims of the cisternae. (H) Arrival of new ER-Golgi carriers and formation of a new cis-cisterna, as well as fission of the neck of COPI-coated buds and division of bubbles, and formation of an empty trans-cisterna. (I) Merging of carriers to form a new cis- cisterna. Fusion of COPI-dependent vesicles with proximal cisternae and formation of two carriers after the Golgi from an empty trans-cisterna. (JO) Two consecutive rounds of the same process that occurs distally along the Golgi stack. As a result, the cis- cisterna containing the mega-cargo (blue lines) and soluble cargo (red dots) appears on the trans-position within the stack. ((II): (AF)) Mechanisms of concentration of soluble cargoes according to the symmetric KARM (the carrier maturation model). Black dots, soluble cargo; red dots, proton pumping inside the distal compartment. The soluble cargo can diffuse in both directions through a thin tube connecting the two compartments. In the bottom part of the distal compartment, there is a proton pump ((A); square), which moves protons into the lumen of the distal compartment (B). When a proton attaches to the cargo, the cargo molecule tends to form aggregates (C,D). Aggregates become larger than the original molecule and cannot move through the tubes in the retrograde direction. After several cycles of such transformation (E), the concentration of the cargo in the distal compartment becomes higher than in the proximal compartment (F).
Figure 2
Figure 2
Schemes of the kiss-and-run models of intracellular transport (IIV) and (AO). Adapted from Mironov and Beznoussenko [38]. (I) The symmetrical KARM poses that after fusion of the membranes of these two compartments (central image), cargo (black dots inside the ring 2) would diffuse into the lumen of compartment 1. The concentration of cargo would be similar in both compartments. (II) The asymmetric KARM poses that distal compartment 2 is composed of the main part and smaller parts where the cargoes are concentrated. These two parts are connected by thin tubules. Thus, the KARM suggests that the compartments initially fuse, and then for some reason, the tubules undergo fission. For instance, these tubules can be broken easily when lipids from the distal compartment diffuse into them. An additional demand for the asymmetrical KARM is the necessity for a mechanism responsible for the change in the cargoes in such a way that this would induce a greater formation of temporal aggregates by the cargoes. These temporally existing aggregates would be not able to diffuse through the thin tubules backwards. (AO) Function of the asymmetrical KARM within the Golgi stack (see Movie S1). (A) Formation of the SNARE complex composed of V- and T-SNAREs (brown and magenta lines, left) between the mega-cargo (blue lines) containing cisternal distensions and the rim of the distal cisterna. (B) Fusion between the distensions and the corresponding rim. (CF) Integration of the distension into the distal cisterna. (G) Elongation of the first cisternae. (H,I) Replacement of the SNAREs and formation of the new SNARE complex composed of another set of SNAREs (red and green line). (J) Fusion of the cargo-containing distension situated within the second cisterna with the rim of the third cisterna containing a pore. (KO) Additional rounds of fusion/fission processes.
Figure 3
Figure 3
Representative images show enrichment of cargoes at the trans-side of the Golgi complex. The type of cell, protein labelling and the state of transport (steady-state [StSt]; mini-wave [Mini]) are indicated on the images. (A) Enrichment of albumin (red arrows) in the last medial cisterna and in TMC (black arrows). Tokuyasu cryo-section. (B,C) Enrichment of albumin in the cisternal lumen near the rims. Tokuyasu cryo-section. (D,E) Enrichment of VLDL in one cisternal distension of a hepatocyte. (D) Three-dimensional model of EM tomography. (E) Routine transmission EM. (F) High concentration of PCI distensions (arrows) in the last medial cisternae of human fibroblasts. Enhanced nanogold. (G) Enrichment of procollagen I (PCI) distensions (arrows) at the trans-side of the Golgi. Tokuyasu cryo-section. (H) Enrichment of VSVG labelling (10 nm gold) at the trans-side of the Golgi stack. Tokuyasu cryo-section. (I) Enrichment of PCI distensions (arrows) within the last medial cisternae in human fibroblasts at steady-state. EM tomography. (J) Enrichment of PCI distensions (arrows) in the medial cisternae at the trans-side of the Golgi complex of human fibroblasts under a mini-wave. EM tomography. Scale bars: 130 nm (A,D,H); 200 nm (B,C,E); 240 nm (F,G,I,J).
Figure 4
Figure 4
Quantification of data. (AE) Steady-state (stst). Normalised (versus the ER) gold labelling of albumin (A) and VSVG (E). Normalised (versus the first medial cisterna) number of VLDLs in one cisternal distension (B). Normalised number of procollagen I-containing distensions in one cisterna (C,D). (A) Gold labelling for albumin in the last medial cisterna and the trans-most cisterna is significantly higher than that in the first medial cisterna (p < 0.05). (B) The number of VLDLs in one cisternal distension of the last medial cisterna is significantly higher than that in the first medial cisterna (p < 0.05). (C) Distribution of PCI distension within the Golgi complex. Its proportion in the last medial cisterna is significantly higher than that in the first medial cisterna (p < 0.05). (D) The numerical density of PC distensions in the last medial cisterna is significantly higher than that in the first medial cisterna (p < 0.05). (E) Distribution of VSVG gold labelling within the Golgi complex. The numeric density of gold in the last medial cisterna is significantly higher than in the first medial cisterna (p < 0.05). (F) The mini-wave. The number of PCI distensions per 1 µm2 of cisterna. Their maximal number in the last medial cisterna is significantly higher than in the first medial cisterna (p < 0.05). (G) Labelling for VSVG becomes significantly enriched in the last medial cisterna (p < 0.05). (H) The length of the first and last medial cisternae do not differ both at steady-state (CTR) and during synchronous IGT (mini and maxi-waves). (I) During IGT (according to the mini-wave and maxi-wave protocols), the number of medial Golgi cisternae does not change, whereas two additional cisternae (cis-most and trans-most cisterna) are attached. (J,K) Dynamics of Golgi volume (J) and surface area of Golgi compartments (K) during the synchronous IGT of VSVG-GFP according to the mini-wave (red line) and maxi-wave (blue line) protocols. During IGT, the volume of the Golgi complex and the surface area of the Golgi compartments (K) significantly increased (p < 0.05), but this depended on the amount of cargo transported. (L) Distance between large (VSVG) and small (ManII) gold particles is significantly higher than between large gold particles or between small gold particles (p < 0.05). (M) Overlapping of immunofluorescence (IF) labelling between PC and VSVG when maxi-wave synchronisation was applied is significantly higher than when the mini-wave was used (p < 0.05). During IGT synchronised according to the cycloheximide (CHM)-15-CHM protocol, overlap between ASGPR and VSVG was low, similar to that after the mini-wave PCI and VSVG IGT. (N,O) Dynamics of co-localisation between PCI (N) and VSVG (O) with different Golgi SNAREs during the synchronised IGT, according to the CHM-15-CHM protocol. (N) Overlapping of IF between PCI and different Golgi SNAREs during IGT. PCI lost (p < 0.05) its co-localisation with Bet1 and then acquired co-localisation with GOS28 and GS15. (O) Overlapping of IF between VSVG and different Golgi SNAREs during IGT. VSVG lost (p < 0.05) its co-localisation with Sec22 and membrane and then acquired co-localisation with GOS28 and GS15. (P) distribution of immune-EM labelling for Ykt6 during IGT of PCI. Mini-wave. Ykt6 is depleted in round profiles (RPs) and enriched over PCI distensions (PCI dist.). (Q) Distribution of labelling of different Golgi SNAREs over the Golgi compartments at 4 min after release of the transport block of PCI. Mini-wave. Membranes of PCI distensions contain Ykt6, GS15 and Bet1. RPs are enriched in membrane and GOS28. Cisternal rims are enriched in syntaxin-5 (STX5). * p < 0.05.
Figure 5
Figure 5
Dynamics of Golgi compartments during synchronous IGT. (AD) Schemes of predictions related to the numbers of medial Golgi cisternae during IGT derived from the CMPM (A,C) and the KARM (B,D) during the mini-wave (A,B) and maxi-wave (C,D). According to the KARM, the number of medial Golgi cisternae remains constant both before and after the release of the transport block and does not depend on the amount of VSVG moving through the Golgi complex. The volume of the Golgi complex (A) and the surface area of the Golgi compartments (B) depends on the amounts of cargo transported (indicated in upper row). The KARM predicts that during the maxi-wave, the cisterna length would be higher than during the mini-wave. (EJ) Representative EM images. (E,G,H) Routine EM. (F) Enhanced gold pre-embedding IEM (E-nanogold). (I,J) Tokuyasu cryo-sections. (E) The Golgi complex was small just before the release of the transport block (F,G), whereas the volume of the ERES was high (F). The Golgi volume increased after arrival of the cargo (G), whereas the volume of the ERES became small (H). Then the Golgi volume decreased again (I), whereas the volume of ERES became higher (J) if the delivery of the cargo was organised as a wave. Black arrows show ERES. Scale bars: 200 nm (C,E,F,G); 290 nm (D). Quantified in Figure 4H–K.
Figure 6
Figure 6
During intra-Golgi transport of small amounts of VSVG and ASGPR (CHM-15-CHM protocol), their distinct domains are formed. (A,E,J) HRP-DAB reaction. (BD,FI) Tokuyasu cryo-sections. (F,G) Serial Tokuyasu cryo-sections. (E,K) Enhanced-nanogold. (AI,K) Domains of VSVG and ASGPR (E,J) at 5 min after release of the transport block. Clusters (arrows) of 10-nm gold particles as indication of VSVG domains along the Golgi stacks. (C) Domains of VSVG (large black arrow) and ManII (small black arrows). White arrows indicate pores around VSVG domain. (E) Domains of ASGPR (gold; black arrow) and VSVG DAB (red arrow) are distinct. White arrows indicate pores around cargo domains. (J) Domain of ASGPR (DAB labelling) is surrounded with pores (white arrows). Markers and gold size are indicated on images. Circles and squares indicate VSVG domains. Scale bars: 280 nm (FL); 200 nm (M,Q).
Figure 7
Figure 7
Quantification of the results. (A). Fluorescence intensity of VSVG dots does not change during intra-Golgi transport. (B) Proportion of PCI and VLDL distensions separated with the pore row is high. (C,D) Proportions of cisternal distensions surrounded with pores. Pores surround cisternal distensions with PCI (C) and VLDL (D) in both the first and last Golgi cisternae. (EH) Distribution of gold labelling for PC distensions (E,F) and VSVG (G,H) at 2 min after release of transport block, according to the mini-wave (E,G) and maxi-wave (F,H) protocols. Labelling densities of gold and distensions in the first medial cisterna in (E,G) are significantly higher than in the last medial cisterna (p < 0.05), whereas this difference is less in (F,H). (I) Fluorescence recovery (dynamics of the ratio between fluorescence intensity between the bleached zone and ER). Synchronisation protocols and times after the release of the temperature blocks are indicated in the images. After the maxi-wave synchronisation, the recovery is greater at 6 min than those during the mini-wave and at 12 min after release using the maxi-wave. (I,J) Inhibition of the COPI function decreases the rate of pore restoration decrease. In CHO and ldlF cells, the COPI function was inhibited by heating cells to 40 °C for 2 min. In CHO cells, the bar after is lower than the bar resting. In ldlF cells, this difference is not significant. In heterokaryons composed of CHO cells, the restoration is high. In the heterokaryons composed of ldlF cells, it remains low. In heterokaryons composed of CHO and ldlF cells, the speed of the pore restoration is higher than in ldlF cells. (K) During intra-Golgi transport, co-localisation between PCI and GalT increases in control (CTR) cells but is inhibited in cells treated with AlF4.
Figure 8
Figure 8
Multi-wave synchronization protocol. HeLa (A-F), HepG2 (G) cells, and human fibroblasts (H) were subjected to multi-wave synchronisation protocols (see Methods). (A,B) Fluorescent microscopy. (A) Kymographs of VSVG-GFP dynamics within the Golgi mass. Carriers moved in both directions. (B) Kymographs of the same Golgi mass (two first images), higher magnification (middle image), and subsequent bleaching of half of the Golgi complex. (C) Immuno-peroxidase labelling for RUSH-TNF-α in different Golgi cisternae (arrows) after synchronisation according to multi-wave intra-Golgi transport (see Methods). (D) After the multi-wave protocol, VSVG is present in different cisternae (immuno-peroxidase labelling; DAB). (E) Tokuyasu cryo-sections. VSVG is present in the first near Golgi cisterna (GM130) and the last medial Golgi cisternae. (F) Tokuyasu cryo-sections. Distinct domains of VSVG (10-nm gold) contain enriched Ykt6 (15-nm gold). (G) Tokuyasu cryo-sections. In HepG2 cells infected with tsVSV and synchronised according to the CHM-15-CHM protocol, VSVG and ASGPR form distinct domains at 5 min after release of the transport block. (H) In human fibroblasts, after arrival of the second wave of PC, the first portion (white arrow) was already at the trans-side (black arrows) of the stack. Enhanced nano-gold. Scale bars: 8 µm (A); 6 µm (B); 210 nm (E); 250 nm (C,H); 85 nm (F); 170 nm (G).
Figure 9
Figure 9
During intra-Golgi transport, different membrane cargoes form distinct domains. (AC) Fluorescence microscopy. HepG2 cells are shown after the 15 °C temperature block. Albumin (green) is in the ER, ASGPR (red; (C)) is in the ER exit sites. (B) Labelling for GalT (blue) in the Golgi complex appears to be centrally fragmented. (D) At 2 min after release of the 15 °C temperature block, part of the albumin is in the Golgi complex, whereas ASGPR remains in ER exit sites. (E) Labelling for ASGPR (red) and albumin (green) at 4 min after release of the 15 °C temperature block. Albumin (green) is concentrated within the Golgi complex. (F,HP). Fluorescence microscopy. In HepG2 cells infected with tsVSV and synchronised according to the CHM-15-CHM protocol, VSVG and ASGPR form distinct dots at 5 min after release of the block. (G) In human fibroblasts infected with tsVSV, stimulated to synthesise PCI and incubated at 32 °C, PC and VSVG form distinct dots. (Q) Double silver enhancement. Distinct aggregates of different gold particles. (R) When the maxi-wave protocol was applied, VSVG (DAB) was present in the membrane surrounding PCI distensions (arrows). Scale bars: 2 µm (AG); 4 µm (H); 5 µm (L,N); 180 nm (C,Q); 280 nm (R).
Figure 10
Figure 10
Enrichment of SNAREs in membranes surrounding the cargo domains. (AJ) Human fibroblasts. (KO) HeLa cells. (AF,KO) Fluorescence microscopy. (GJ) Tokuyasu cryo-sections. (AO) Mini-wave. (A) Before the release of the transport block, Ykt6 was a little enriched at ER exit sites. (B) At 3 min after the release of the transport block, PCI formed dots where Yklt6 became enriched. (C) PCI dots co-localised with Bet1. (D) At 7 min after re-initiation of intra-Golgi transport, PCI and Ykt6 dots were co-localised. (E,F) At 12 min after re-initiation of intra-Golgi transport, PCI dots lost their co-localisation with Ykt6 and Bet1 but acquired co-localisation with GS15. (GJ) Enrichment of Ykt6 in membranes surrounding PCI distensions (blue, red boxes). (I,J) Enlargement of areas inside the blue and red boxes in (G). (K,L) VSVG-containing dots acquired Bet1, then Ykt6, and finally GS15, whereas Bet1 disappeared in these dots. (MP) Fluorescence microscopy. Ministacks (pre-treatment of cells with 33 µM nocodazole for 3 h). Times of IGT are indicated on images ((KO); quantified in Figure 2N,O). Scale bars: 4 µm (AF,KP); 130 nm (G); 90 nm (H).
Figure 11
Figure 11
At steady-state (AE) and during the mini-wave protocol (FL), cisternal distensions filled with VLDLs (AE) or procollagen-I (FL) were separated from the rest of the Golgi cisternae by rows of pores. (AB,FK) EM tomography. (CE,L) Representative transmission EM images. (A,B) Three-dimensional models of the Golgi complex of hepatocytes shown from opposite views (shown in Figure 3D). Green, ER. Several boxes with different colours of their borders were enlarged and demonstrated pores separating distensions filled with VLDLs. Red arrows, pores; yellow arrows, medial cisternae; blue spheres, VLDLs. (C,D) Pores (red arrows) between VLDL distensions and the rest of Golgi cisternae. Below: Enlargements of the areas inside the red and green-bordered boxes in (D). (E) Tangential section of Golgi cisternae with pores (black arrows). (FK) Three-dimensional models that show pores (red arrows) between cisternae and PCI distensions. White asterisks in (H) and (J) indicate the lumen of cisternal distensions. (J) Red arrow, continuity between PC distension and another cisterna. (L) Tangential section of the Golgi stack. White asterisk indicates Gollgi cisterna. Scale bars: 210 nm (A,B); 120 (C,FI,K); 170 nm (D,E); 240 nm (L).
Figure 12
Figure 12
Pores separate cisternal distensions, which are filled with VLDLs (A) in hepatocytes and procollagen I in human fibroblasts (BJ). (AD) All distensions are separated from the rest of the cisternae by pores (red arrows) around cisternal distensions. (E,G,H) Three-dimensional model of the Golgi cisterna during the mini-wave. Green arrows, COPI-coated buds (red) on the rim of the pore near the distension. (F) Mini-wave protocol. Tangential section of the medial Golgi cisterna. Immuno EM, enhanced nanogold particles show PC. Red arrows, pores surrounding PC aggregate (black blob) in the section. Asterisks indicate solid parts of Golgi cisternae. (I,J) Three-dimensional model of the Golgi complex with the PC-containing cisterna distension in the perforated cis-most cisterna at 2 min after the transport block. Yellow arrows, many pores in the medial cisternae. (K) HeLa cells. Mini-wave of VSVG. Low level of penetration of VSVG into the Golgi stack. Scale bars (nm): 165 (A); 420 (BD); 240 (E,F); 75 nm (H); 280 (I,K).
Figure 13
Figure 13
The pattern of intra-Golgi transport depends on the amount of cargo transported. (A,B,ER) Hela cells. (C,D) Human fibroblasts. Protocols of cargo synchronisation are shown in images, as the mini-wave (B,C,NP) and the maxi-wave (A,DM,Q,R). (A,B,E) Tokuyasu cryo-sections. HeLa cells were transfected with VSVG-GFP (10-nm gold immunolabelling) and subjected to the maxi-wave and mini-wave protocols of cargo synchronisation. When a large amount of VSVG-GFP was transported (A), this cargo penetrated up to the trans-most cisterna (white arrow). Intermixing of VSVG-GFP and ManII was higher than after the mini-wave ((E); compare with Figure 6C). During the mini-wave (B), the penetration of VSVG was lower (quantified in Figure 7G–H). (C,D) Enhanced nanogold. Human fibroblasts were stimulated to synthesise PCI and then subjected to the mini-wave (C) and maxi-wave (D) protocols of PCI synchronisation. During the maxi-wave, the penetration of PCI was deeper (quantified in Figure 7E,F). (F) Focused ion beam scanning EM (FIBSEM) analysis. Serial images show that the immune–EM labelling for VSVG–GFP is not interrupted and forms a ribbon. (GI) Fluorescence recovery after photobleaching (FRAP). HeLa cells were transfected with VSVG–GFP and then subjected to the maxi-wave protocol (see Methods). Then, the whole cell less half of its Golgi complex was bleached, and the FRAP was examined at 4 (G), 8 (H) and 12 (I) min after the initiation of intra-Golgi transport. Kymographs. Images were taken at times shown in (A,B) and every 30 s (G) or every 20 s (H,I). Fast FRAP was observed in (G,B). Lower FRAP was observed in (H). Very low FRAP was observed in (I). Data are quantified in Figure 7I. (J,K) Immunofluorescence. Overlapping of Golgi ribbon filled with VSVG-GFP before (green) and after bleaching and refilling (red). There is a high level of overlap. Significant areas of yellow colour suggest that the second portion of VSVG-GFP moved along the same structures where the first portion of VSVG-GFP was already present. The yellow zones show low co-localisation with GalT (blue). (LP) Immunofluorescence. Three-dimensional reconstruction of Golgi fragments visible at the immunofluorescence level after synchronisation of VSVG according to the maxi-wave (L,M) and mini-wave (NP) protocols. One large cargo sphere is formed in the first case, and several small spheres are formed in the second case. (Q) Immuno-EM labelling for VSVG with DAB reaction. The contour of the DAB-positive structures is traced with red dashed lines, the contours of the empty zones of the same cisternae are contoured with a yellow dashed line, and the other cisternae were contoured with green dashed lines. (R) Three-dimensional models of the Golgi cargo ribbons. Red structures form ribbons connecting different Golgi stacks. When a large amount of VSV-GFP was transported, these membranes formed a continuous ribbon. Previously we demonstrated that ManII-positive compartments of the Golgi form a ribbon [19]. Scale bars: 180 nm (A,B) 240 nm (C,D); 190 nm (E); 1.3 µm (F); 5 µm (G); 12 µm (H,I); 3 µm (J,K); 250 nm (Q); 450 (R).
Figure 14
Figure 14
Dynamics of pores during intra-Golgi transport and role of COPI in the generation of cisternal pores. (A,B) Before the release of the transport block, according to the CHM-15-CHM synchronisation protocol, the numerical density of the pores over all of the Golgi cisternae was high. (C,D) Disappearance of cisternal pores after the passage of VSVG. (F) High-pressure freezing. Human fibroblasts. Disappearance of cisternal pores after passage of PCI through the Golgi. (G) Addition of AlF4 blocked restoration of the cisterna pores after the passage of VSVG. (H,J) Restoration of the numerical density of pores in the first medial cisterna after intra-Golgi transport and its inhibition for 25 min was blocked in heated ldlF cells. (see Methods). (I) Ministacks (3 h of nocodazole pre-treatment) after the passage of VSVG. There were no pores in the medial cisternae and no CMC and TMC. (J) Impairment of restoration of the cisternal pores in the ldlF cell heated to 40 °C for 2 min. Scale bars: 160 nm (A,D,G); 175 (B,H,I); 210 nm (C,E); 415 nm (F); 260 nm (J).
Figure 15
Figure 15
Scheme demonstrating the mechanism of IGT according to the KARM. (I). Formation of the cargo ribbon. (A) Arrival of two cargo domains. (B) Arrival of new domains and their fusion, leading to the parallel ribbon. (C) Budding of the cargo domains from the Golgi cisternae. (II). (A) The asymmetric KARM (carrier maturation) poses that a cargo domain (sphere in the upper-left image fuses with the cisternal rims containing several pores. This is shown in (B,C). (D,E) The cargo domain fuses with the distal cisterna with the tubule. (F) Break of the tubules within the zone where pores were situated. (G) Fission of the tubule connecting the cargo domain and the proximal cisterna. (H,I) Arrival of the trans-Golgi network, its fusion with the cargo domain, and the consecutive fission of the tubule connecting the cargo domain and the distal cisterna.

References

    1. Velasco A., Hendricks L., Moreman K.W., Tulsiani D.R.P., Touster O., Farquhar M.G. Cell-type dependent variations in the subcellular distribution of a-mannosidase I and II. J. Cell Biol. 1993;122:39–51. doi: 10.1083/jcb.122.1.39. - DOI - PMC - PubMed
    1. Jamieson J.D., Palade G.E. Intracellular transport of secretory proteins in the pancreatic exocrine cell. I. Role of the peripheral elements of the Golgi complex. J. Cell Biol. 1967;34:577–596. doi: 10.1083/jcb.34.2.577. - DOI - PMC - PubMed
    1. Jamieson J.D., Palade G.E. Intracellular transport of secretory proteins in the pancreatic exocrine cell. II. Transport to condensing vacuoles and zymogen granules. J. Cell Biol. 1967;34:597–615. doi: 10.1083/jcb.34.2.597. - DOI - PMC - PubMed
    1. Jamieson J.D., Palade G.E. Intracellular transport of secretory proteins in the pancreatic exocrine cell. IV. Metabolic requirements. J. Cell Biol. 1968;39:589–603. doi: 10.1083/jcb.39.3.589. - DOI - PMC - PubMed
    1. Jamieson J.D., Palade G.E. Intracellular transport of secretory proteins in the pancreatic exocrine cell. 3. Dissociation of intracellular transport from protein synthesis. J. Cell Biol. 1968;39:580–588. doi: 10.1083/jcb.39.3.580. - DOI - PMC - PubMed

MeSH terms

LinkOut - more resources