. 2022 Mar 28;23(7):3727.
doi: 10.3390/ijms23073727.

Transcriptome Analysis of Populus euphratica under Salt Treatment and PeERF1 Gene Enhances Salt Tolerance in Transgenic Populus alba × Populus glandulosa

Affiliations

Transcriptome Analysis of Populus euphratica under Salt Treatment and PeERF1 Gene Enhances Salt Tolerance in Transgenic Populus alba × Populus glandulosa

Xiao-Lan Ge et al. Int J Mol Sci. .

Abstract

Populus euphratica is mainly distributed in desert environments with dry and hot climate in summer and cold in winter. Compared with other poplars, P. euphratica is more resistant to salt stress. It is critical to investigate the transcriptome and molecular basis of salt tolerance in order to uncover stress-related genes. In this study, salt-tolerant treatment of P. euphratica resulted in an increase in osmo-regulatory substances and recovery of antioxidant enzymes. To improve the mining efficiency of candidate genes, the analysis combining both the transcriptome WGCNA and the former GWAS results was selected, and a range of key regulatory factors with salt resistance were found. The PeERF1 gene was highly connected in the turquoise modules with significant differences in salt stress traits, and the expression levels were significantly different in each treatment. For further functional verification of PeERF1, we obtained stable overexpression and dominant suppression transgenic lines by transforming into Populus alba × Populusglandulosa. The growth and physiological characteristics of the PeERF1 overexpressed plants were better than that of the wild type under salt stress. Transcriptome analysis of leaves of transgenic lines and WT revealed that highly enriched GO terms in DEGs were associated with stress responses, including abiotic stimuli responses, chemical responses, and oxidative stress responses. The result is helpful for in-depth analysis of the salt tolerance mechanism of poplar. This work provides important genes for poplar breeding with salt tolerance.

Keywords: PeERF1; Populus euphratica; WGCNA; salt stress; transcriptome.


Conflict of interest statement

The authors declare no conflict of interest.

Figures

Figure 1
Figure 1
Physiological response to salt stress in the young leaves of P. euphratica. (AC) Comparison of peroxidase (POD), superoxide dismutase (SOD), and malonaldehyde (MDA) contents between t different times and concentrations in P. euphratica; the control is water. Three biological replicates and three technical replicates were used in the studies. The student’s t-test was used to assess the data. p < 0.05 of three-time intervals (12, 24, and 48 h) versus the control (0 h) and two treatment concentrations (150 mM and 300 mM) versus the control (0 mM), respectively. Abbreviations: PeuC, P. euphratica control; A, 150 mM NaCl salt-stressed; B, 300 mM NaCl salt-stressed; 12, salt stress for 12 h; 24, salt stress for 24 h; 48, salt stress for 48 h (* p-value < 0.05).
Figure 2
Figure 2
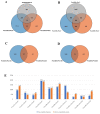
Statistics of DEGs of P. euphratica under Salt Stress. (A) Group I: Overlap of comparison Peu12A vs. PeuC, Peu24A vs. PeuC, and Peu48A vs. PeuC of up-regulated or down-regulated genes after NaCl treatment. (B) Group II: Overlap of comparison Peu12B vs. PeuC, Peu24B vs. PeuC, and Peu48B vs. PeuC of DEGs after 300 mM NaCl treatment. (C) Group III: Overlap of comparison Peu24A vs. Peu12A and Peu48A vs. Peu24A of DEGs after NaCl treatment. (D) Group IV: Overlap of comparison Peu24B vs. Peu12B and Peu48B vs. Peu24B of DEGs after NaCl treatment. (E) The number of up-regulated and down-regulated genes in all comparison combinations. Abbreviations: PeuC, P. euphratica control; A, 150 mM NaCl salt-stressed; B, 300 mM NaCl salt-stressed; 12, salt stress for 12 h; 24, salt stress for 24 h; 48, salt stress for 48 h.
Figure 3
Figure 3
Weighted gene co-expression network analysis of DEGs. (A) Module–trait relationships. Correlations between module–trait weights and their accompanying p-values (in parenthesis). The 17 modules are depicted in the left panel, along with the number of genes in each module. The color scale on the right displays module–trait correlation from −1 (blue) to 1 (red). (B) Cytoscape depiction of co-expressed genes in module–trait turquoise. Yellow and red nodes represent transcription factors and high connectivity genes, respectively. Purple represents genes that overlap with GWAS results. (C) Cytoscape representation of co-expressed genes in module–trait green. (D) Cytoscape representation of co-expressed genes in module–trait blue.
Figure 4
Figure 4
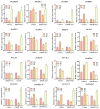
RT-PCR was used to validate the expression of eight genes. The left gray histogram represents the qRT-PCR results. The red broken line on the right represents the FPKM. Values are presented as means ± SD of three independent measurements.
Figure 5
Figure 5
Self-activation experiment and Y1H analysis of PeERF1. (A) As a negative control, yeast cells transformed with the empty pGBKT7 vector were employed. As a positive control, pGADT7-T co-transformed yeast cells were employed. (B) PeERF1 binding to the GCC-box, DRE, and TTG motif was studied using Y1H. DDO (Double Dropout Medium): SD medium devoid of leucine (Leu) and tryptophan (Trp), TDO (Triple Dropout Medium): SD medium devoid of leucine (Leu), tryptophan (Trp), and histidine (His). 1, 0.1, 0.01, 0.001: each spot, yeast cells were serially diluted 1, 10, 100, or 1000 times. P: Positive control, p53HIS2 + pGADT7-Rec2-53, N: negative control, p53HIS2 + pGADT7-PeERF1; 1, 5, 8 and 11: PeERF1 binding to GCC-box, DRE motif, TGG1 and TGG2 core sequence; 2–4, 6–7, 9–10, 12–13: PeERF1 binding to the GCC-box, DRE, TGG1 and TGG2 motif mutations.
Figure 6
Figure 6
Transgenic P. alba × P. glandulosa morphological traits under salt stress. SE1, SE2, OE1, OE2: various transgenic poplar lines; WT, wild type poplar. (AD) 1-month-old P. alba × P. glandulosa phenotypes on 0, 50, 75, and 100 mM NaCl rooting media. Under salt stress, the height, root length, and fresh weight were measured in transgenic and WT. The standard deviation is shown by the error bar. The presence of an asterisk implies that there is a substantial difference between transgenic and WT (t-test, * p < 0.05).
Figure 7
Figure 7
WT and 1-month-old transgenic P. alba × P. glandulosa were given a 7-day treatment with 150 mm salt. (AC) Under salt stress, the growth state, height, and fresh weight were measured in transgenic and WT (* p-value < 0.05).
Figure 8
Figure 8
Analysis of physiology and gene expression in response to salt stress. OE5, OE7, OE11, SE4, SE6, SE7: different transgenic lines; WT, wild type. (AF) POD, SOD, MDA, soluble sugar, chlorophyll, and relative conductivity levels were compared between transgenic and WT; the control is water (* p-value < 0.05; ** p-value < 0.01).
Figure 9
Figure 9
Staining with histochemical agents. (A) DAB staining of hydrogen peroxide. (B) NBT superoxide staining; WT, wild type; OE, transgenic poplar with 35S: PeERF1 overexpression. SE, 35S: SRDX-PeERF1 suppresses transgenic poplar expression.
Figure 10
Figure 10
Statistics on gene expression differences between transgenic and WT before and after salt stress. (A) In all comparison combinations, the number of up-regulated and down-regulated genes. (B) Overlap of comparison C-WT vs. C-OE and T-WT vs. T-OE, of up-regulated or down-regulated genes after NaCl treatment. (C) Overlap of comparison C-WT vs. C-SE and T-WT vs. T-SE, of up-regulated or down-regulated genes after NaCl treatment.
Figure 11
Figure 11
Analysis of GO enrichment of DEGs in the transcriptome under salt stress.
Figure 12
Figure 12
RT-qPCR verified the DEGs of RNA-seq (* p-value < 0.05; ** p-value < 0.01).

Similar articles

Cited by

References

    1. Godfray H.C., Beddington J.R., Crute I.R., Haddad L., Lawrence D., Muir J.F., Pretty J., Robinson S., Thomas S.M., Toulmin C. Food security: The challenge of feeding 9 billion people. Science. 2010;327:812–818. doi: 10.1126/science.1185383. - DOI - PubMed
    1. Zhang C., Luo W., Li Y., Zhang X., Bai X., Niu Z., Zhang X., Li Z., Wan D. Transcriptomic analysis of seed germination under salt stress in two desert sister species (Populus euphratica and P. pruinosa) Front. Genet. 2019;10:231. doi: 10.3389/fgene.2019.00231. - DOI - PMC - PubMed
    1. Kazuo S., Kazuko Y.S. Gene networks involved in drought stress response and tolerance. J. Exp. Bot. 2007;58:221–227. - PubMed
    1. Zeng F., Shabala S., Maksimović J.D., Maksimović V., Bonales-Alatorre E., Shabala L., Yu M., Zhang G., Živanović B.D. Revealing mechanisms of salinity tissue tolerance in succulent halophytes: A case study for Carpobrotus rossi. Plant Cell Environ. 2018;41:2654–2667. doi: 10.1111/pce.13391. - DOI - PubMed
    1. Kurt-Kızıldoğan A., Abanoz B., Okay S. Global transcriptome analysis of Halolamina sp. to decipher the salt tolerance in extremely halophilic archaea. Gene. 2017;601:56–64. doi: 10.1016/j.gene.2016.11.042. - DOI - PubMed

MeSH terms

LinkOut - more resources