. 2022 Mar 29;23(7):3734.
doi: 10.3390/ijms23073734.

Specific Attenuation of Purinergic Signaling during Bortezomib-Induced Peripheral Neuropathy In Vitro

Affiliations

Specific Attenuation of Purinergic Signaling during Bortezomib-Induced Peripheral Neuropathy In Vitro

Anna-Katharina Holzer et al. Int J Mol Sci. .

Abstract

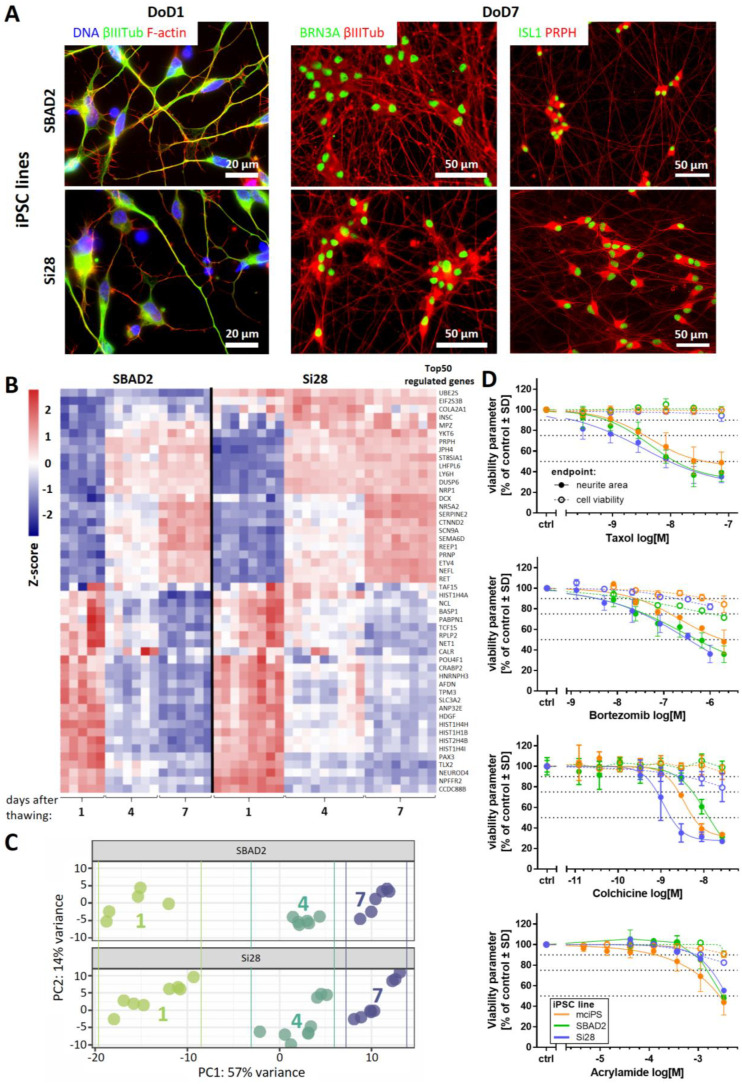
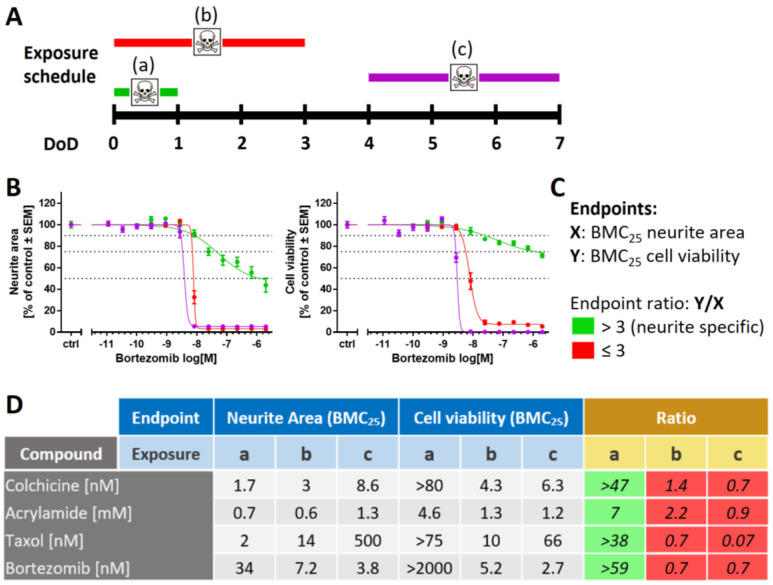
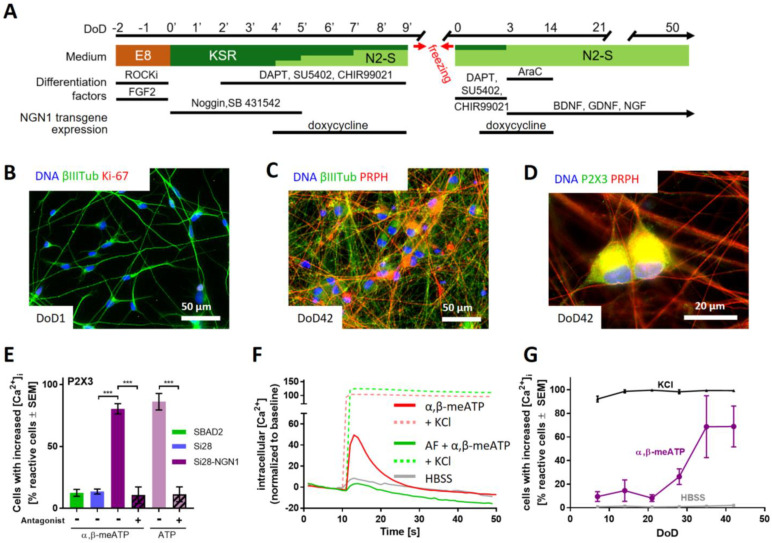
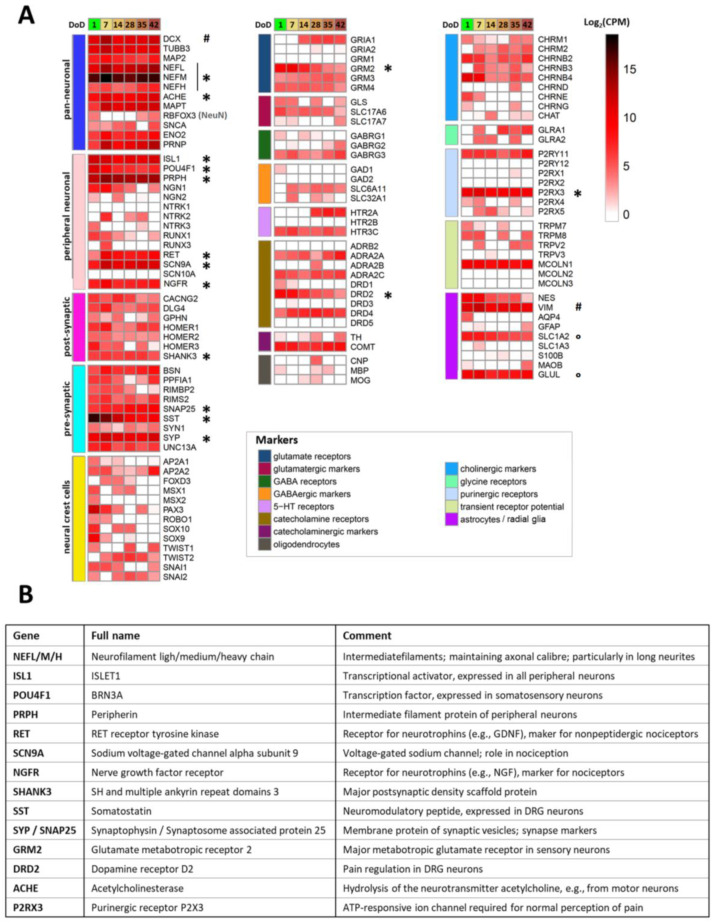
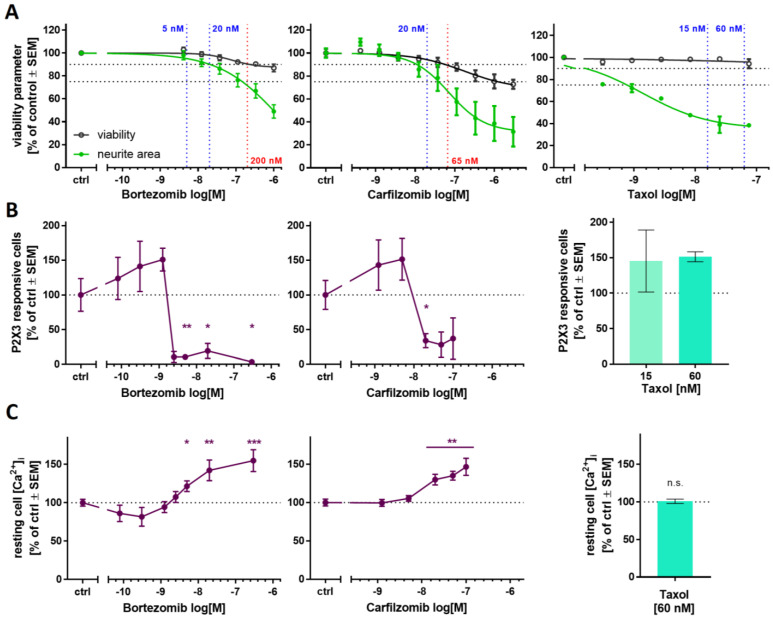
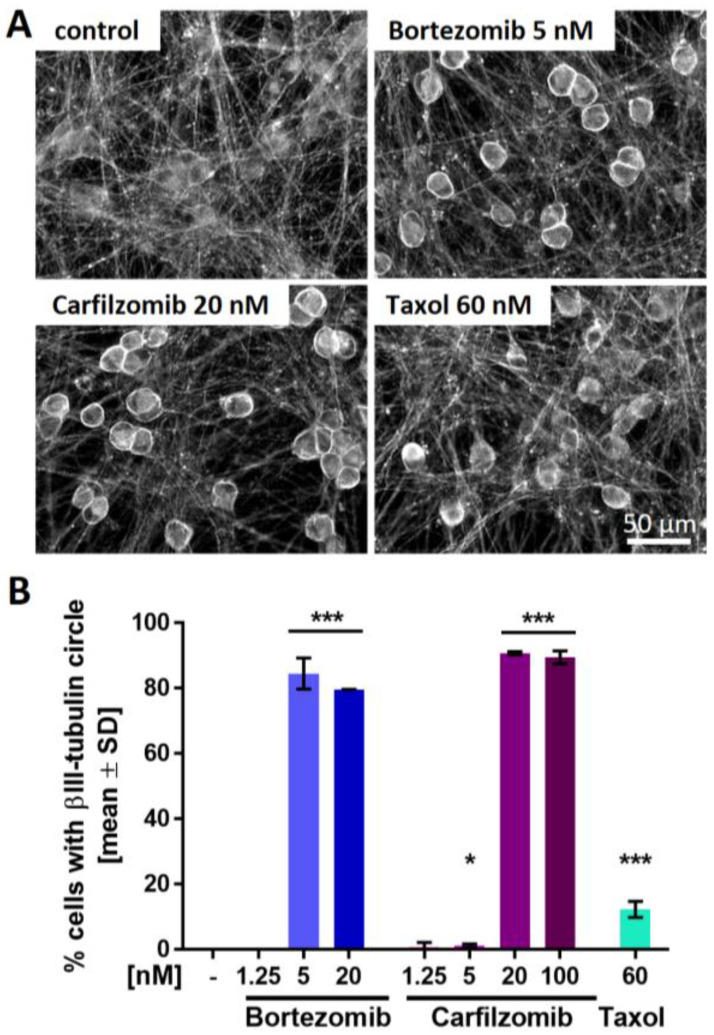
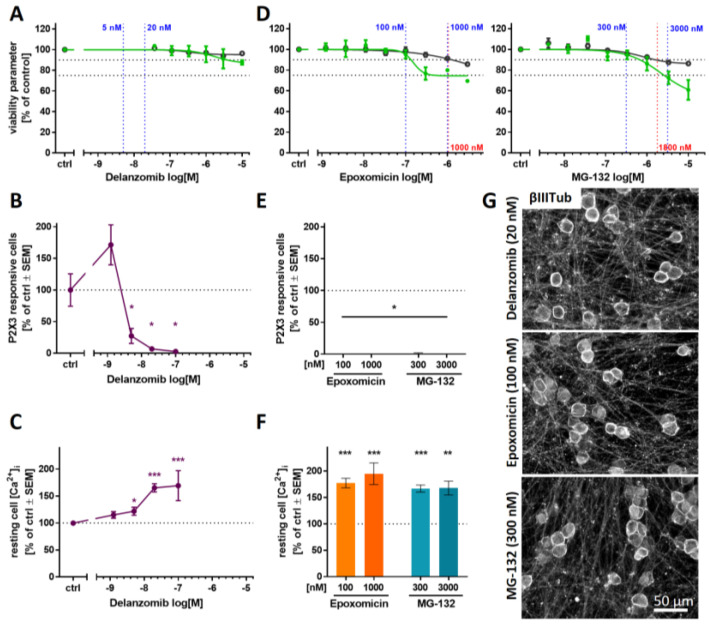
Human peripheral neuropathies are poorly understood, and the availability of experimental models limits further research. The PeriTox test uses immature dorsal root ganglia (DRG)-like neurons, derived from induced pluripotent stem cells (iPSC), to assess cell death and neurite damage. Here, we explored the suitability of matured peripheral neuron cultures for the detection of sub-cytotoxic endpoints, such as altered responses of pain-related P2X receptors. A two-step differentiation protocol, involving the transient expression of ectopic neurogenin-1 (NGN1) allowed for the generation of homogeneous cultures of sensory neurons. After >38 days of differentiation, they showed a robust response (Ca2+-signaling) to the P2X3 ligand α,β-methylene ATP. The clinical proteasome inhibitor bortezomib abolished the P2X3 signal at ≥5 nM, while 50−200 nM was required in the PeriTox test to identify neurite damage and cell death. A 24 h treatment with low nM concentrations of bortezomib led to moderate increases in resting cell intracellular Ca2+ concentration but signaling through transient receptor potential V1 (TRPV1) receptors or depolarization-triggered Ca2+ influx remained unaffected. We interpreted the specific attenuation of purinergic signaling as a functional cell stress response. A reorganization of tubulin to form dense structures around the cell somata confirmed a mild, non-cytotoxic stress triggered by low concentrations of bortezomib. The proteasome inhibitors carfilzomib, delanzomib, epoxomicin, and MG-132 showed similar stress responses. Thus, the model presented here may be used for the profiling of new proteasome inhibitors in regard to their side effect (neuropathy) potential, or for pharmacological studies on the attenuation of their neurotoxicity. P2X3 signaling proved useful as endpoint to assess potential neurotoxicants in peripheral neurons.

Keywords: bortezomib; nociceptors; peripheral nervous system diseases; proteasome inhibitors; purinergic receptor P2X3.


Conflict of interest statement

The authors declare no conflict of interest.

Figures

Figure 1
Figure 1
Reproducible generation of peripheral neurons from different iPSC lines and their use in the PeriTox test. (A) Peripheral neurons derived from the iPSC lines SBAD2 and Si28 were fixed and stained on DoD1 (left) for the neuronal cytoskeletal marker βIII-tubulin (βIIITub, green) and F-actin (red) and on DoD7 (middle, right) for the sensory neuronal transcription factors BRN3A or ISL1 (green) and the cytoskeletal proteins βIIITub or peripherin (PRPH) (red). Color codes and scale bars are given in the images, and the details are shown in Figure S1. DoDx—day of differentiation, counting from thawing of frozen neural precursors on DoD0. (B,C) Whole transcriptome analysis (19,000 genes) was performed for early differentiation states (DoD1, 4, and 7) of SBAD2- and Si28-derived neurons. Data are derived from three independent differentiations (full data in Supplementary File S1). (B) The heatmap depicts the row-wise Z-scores of the top 50 regulated genes (exhibiting the highest variance across all samples). The upper group, as defined by the clustering algorithm, mainly consists of genes upregulated (red) during differentiation and the lower group mainly consists of genes downregulated (blue). (C) For the top 500 variable genes of this data set, a principal component analysis (PCA) was performed. In the two-dimensional PCA display, three differentiation stages are color-coded according to their DoD. Data points and heatmap columns correspond to all technical replicates measured in the 3 experiments per cell line. (D) Peripheral neurons derived from the iPSC lines mciPS (orange), SBAD2 (green) and Si28 (blue) were used in the PeriTox test. The peripheral neurotoxicants taxol, bortezomib, colchicine, and acrylamide were used as positive controls. Effects on the neurite area (solid symbols and lines) and the cell viability (open symbols, dashed lines) are shown. Data are expressed as the mean ± SD of three biological replicates.
Figure 2
Figure 2
Variation of the exposure schedule to assess compound toxicity. (A) Schematic representation of the applied exposure schedules with a 24 h treatment starting on DoD0 (a, standard PeriTox test, green), immediate 72 h treatment (b, DoD0-3, red), and delayed 72 h treatment (c, DoD4-7, purple). DoDx—day of differentiation, counting from thawing of frozen neural precursors on DoD0. (B) SBAD2-derived peripheral neurons were exposed to bortezomib according to the three exposure schedules. Effects on the neurite area and the cell viability were assessed. Data are expressed as the mean ± SEM of 3 independent experiments. (C) Prediction model for the classification of compound-induced effects. The concentrations relating to the benchmark response level of a 25% decrease of a test endpoint (BMC25) were calculated for both endpoints: neurite area (X) and cell viability (Y). A ratio of Y/X > 3 is classified as a “neurite-specific” compound effect (green). Y/X ≤ 3 marks effects that are “not neurite-specific”, and such effects were classified as “cytotoxic” (red). (D) BMC25 values were calculated for both test endpoints in all three exposure scenarios. Effects induced by colchicine, acrylamide, taxol, and bortezomib were classified according to the prediction model. Respective concentration–response curves are given in Figure S4.
Figure 3
Figure 3
Sensory neurons exhibiting functional P2X3 receptor signaling. (A) Schematic representation of the differentiation protocol for the generation of functional sensory neurons from the genetically modified iPSC line Si28-NGN1. During the standard differentiation procedure, transient NGN1-transgene expression was induced from DoD4’ until DoD9’ and from DoD1 until DoD14 by addition of doxycycline. DoDx’—day of differentiation, counting from pluripotent state (DoD0’); DoDx—day of differentiation, counting from thawing of frozen neural precursors on DoD0. Other factors added (e.g., ROCKi) are detailed in the methods section. (BD) Representative immunofluorescence images of cells fixed on DoD1 and stained for (B) βIII-tubulin (βIIITub) and the proliferation marker Ki-67 or on DoD42 and stained for (C) peripherin (PRPH) and βIIITub or (D) P2X3. Nuclei were stained using H33342 (DNA). Color codes and scale bars are given in the images. Details are shown in Figure S5. (E) Peripheral neurons derived from the iPSC lines SBAD2 (green), Si28 (blue), and Si28-NGN1 (purple) were differentiated for >38 days and used for Ca2+ imaging experiments. The P2X3-specific agonist α,β-methylene ATP (α,β-meATP) was used to determine the expression of functional P2X3 receptors. ATP was used as a general agonist for purinergic receptors. AF-353, a P2X3-specific antagonist, was used to confirm exclusive P2X3 expression. (F) Exemplary traces (red) of changes in intracellular Ca2+ concentration ([Ca2+]i) upon α,β-meATP (1 µM) application (solid lines). After the primary stimulus, KCl (dashed lines) was added. Some cells were pre-treated with AF-353 (0.1 µM) (green). The grey line depicts changes upon application of the negative control (HBSS, grey). (G) Time dependency of the expression of functional P2X3 receptors. Sensory neurons were tested weekly for their potential to respond to HBSS, α,β-meATP, and general membrane depolarization induced by KCl. (E,G) Data are expressed as the mean ± SEM of three independent biological replicates. ***, p < 0.0001.
Figure 4
Figure 4
Transcriptome profiling of Si28-NGN1-derived sensory neurons. Neurons were pre-differentiated to immature sensory neurons and frozen. (A) After thawing, gene expression levels were determined for 6 differentiation stages (on day of differentiation (DoD) 1, 7, 14, 28, 35 and 42) by the TempO-Seq method. The heatmap visualizes the normalized counts for each gene (rows) and the DoD (columns). The neuronal overview panel of 122 genes is clustered by gene groups (e.g., neuronal/glial subtypes, and receptor/ion channel classes). The gene groups are indicated by color bars (left). The absolute expression levels are given in counts of the corresponding gene per 1 million reads (CPM). The color scale uses log2 (CPM) units (see the supplementary files for complete data sets) and ranges from white (no expression) to dark red (high expression). Data are derived from 3 independent differentiations. A subset of genes that that may be used for routine culture controls is highlighted (*). High expression levels of VIM and DCX (#) indicate a still relatively young state of the cells that may be even further matured. SLC1A2 and GLUL (°) are often considered glial markers, but the absence of GFAP, AQP, S100B, and MBP indicate that the cultures do not contain classical astrocytes or Schwann cells. (B) Overview of the highly expressed differentiation markers highlighted in (A) with an asterisk, with their full names and a brief explanation of their biological functions.
Figure 5
Figure 5
Ca2+ signaling as a sensitive functional endpoint to assess proteasome inhibitor toxicity. The compounds bortezomib (left), carfilzomib (middle), and taxol (right) were investigated regarding their effects on different test endpoints. (A) The PeriTox test was used to assess their effects on neurite area and viability. Horizontal dashed lines at 90% and 75% indicate the cytotoxicity threshold and the neurite effect threshold, respectively. Vertical dashed lines indicate the lowest cytotoxicity-inducing concentration (red) and the concentrations further used for Ca2+ imaging experiments (blue). (B,C) Sensory neurons (>DoD38) were pre-treated with the test compounds for 24 h, before Ca2+ imaging experiments were performed. (B) The number of cells responsive towards stimulation with the P2X3-specific agonist α,β-methylene ATP was assessed. (C) Baseline fluorescence, indicating the resting intracellular Ca2+ concentration ([Ca2+]i) was quantified for whole sensory neuron cultures. Exemplary single cell fluorescence traces are shown in Figure S9. (AC) Data are given as % of untreated control cells and are expressed as the mean ± SEM of at least 3 biological replicates. *, p < 0.05; **, p < 0.001; ***, p < 0.0001.
Figure 6
Figure 6
Proteasome inhibitor-induced reorganization of the microtubule structure in neuronal somata. Sensory neurons were differentiated for at least 38 days after thawing and exposed to bortezomib, carfilzomib, or taxol for 24 h before fixation. (A) Representative immunofluorescence images of cells stained for βIII-tubulin. A scale bar is given in the images, and further details are shown in Figure S11. (B) Cells exhibiting intense, circular βIII-tubulin staining around the cell somata (covering at least 50% of a full circle) were quantified. Data are given as % of the total cell count (number of viable cell nuclei) and are expressed as the mean ± SD of 2–3 biological replicates. *, p < 0.05; ***, p < 0.0001.
Figure 7
Figure 7
Attenuation of P2X3 signaling and microtubule reorganization as potential PI class effects. The PIs delanzomib (AC,G), epoxomicin, and MG-132 (DG), representing different PI classes, were investigated regarding their effects on various test endpoints. (A,D) The compounds’ effects on neurite area and viability were assessed with the standard PeriTox test. Horizontal dashed lines at 90% and 75% indicate the cytotoxicity threshold and the neurite effect threshold, respectively. Vertical dashed lines indicate the lowest cytotoxicity-inducing concentration (red) and concentrations further used for Ca2+ imaging experiments (blue). (B,C,E,F) Sensory neurons (>DoD38) were pre-treated with the test compounds for 24 h before Ca2+ imaging experiments were performed. (B,E) The number of cells responding to stimulation with the P2X3-specific agonist α,β-methylene ATP (1 µM) was assessed. (C,F) Baseline fluorescence, indicating the resting intracellular Ca2+ concentration ([Ca2+]i) was quantified for whole sensory neuron cultures. (AF) Data are given as % of untreated control cells and are expressed as the mean ± SEM of at least 3 biological replicates. *, p < 0.05; **, p < 0.001; ***, p < 0.0001. (G) After differentiation of >38 days, sensory neurons were exposed to the PIs for 24 h, fixed, and stained for βIII-tubulin. Representative immunofluorescence images are shown. The scale bar is given in the images. Further details and quantification of cells with circular βIII-tubulin staining are given in Figure S12.

Similar articles

Cited by

References

    1. Kane R.C., Bross P.F., Farrell A.T., Pazdur R. Velcade: U.S. FDA approval for the treatment of multiple myeloma progressing on prior therapy. Oncologist. 2003;8:508–513. doi: 10.1634/theoncologist.8-6-508. - DOI - PubMed
    1. Richardson P.G., Barlogie B., Berenson J., Singhal S., Jagannath S., Irwin D., Rajkumar S.V., Srkalovic G., Alsina M., Alexanian R., et al. A phase 2 study of bortezomib in relapsed, refractory myeloma. N. Engl. J. Med. 2003;348:2609–2617. doi: 10.1056/NEJMoa030288. - DOI - PubMed
    1. Zheng H., Xiao W.H., Bennett G.J. Mitotoxicity and bortezomib-induced chronic painful peripheral neuropathy. Exp. Neurol. 2012;238:225–234. doi: 10.1016/j.expneurol.2012.08.023. - DOI - PubMed
    1. Csizmadia V., Raczynski A., Csizmadia E., Fedyk E.R., Rottman J., Alden C.L. Effect of an experimental proteasome inhibitor on the cytoskeleton, cytosolic protein turnover, and induction in the neuronal cells in vitro. Neurotoxicology. 2008;29:232–243. doi: 10.1016/j.neuro.2007.11.003. - DOI - PubMed
    1. Staff N.P., Podratz J.L., Grassner L., Bader M., Paz J., Knight A.M., Loprinzi C.L., Trushina E., Windebank A.J. Bortezomib alters microtubule polymerization and axonal transport in rat dorsal root ganglion neurons. Neurotoxicology. 2013;39:124–131. doi: 10.1016/j.neuro.2013.09.001. - DOI - PMC - PubMed

MeSH terms