. 2022 Mar 29;23(7):3745.
doi: 10.3390/ijms23073745.

Pyruvate Dehydrogenase Kinase Inhibition by Dichloroacetate in Melanoma Cells Unveils Metabolic Vulnerabilities

Affiliations

Pyruvate Dehydrogenase Kinase Inhibition by Dichloroacetate in Melanoma Cells Unveils Metabolic Vulnerabilities

Jiske F Tiersma et al. Int J Mol Sci. .

Abstract

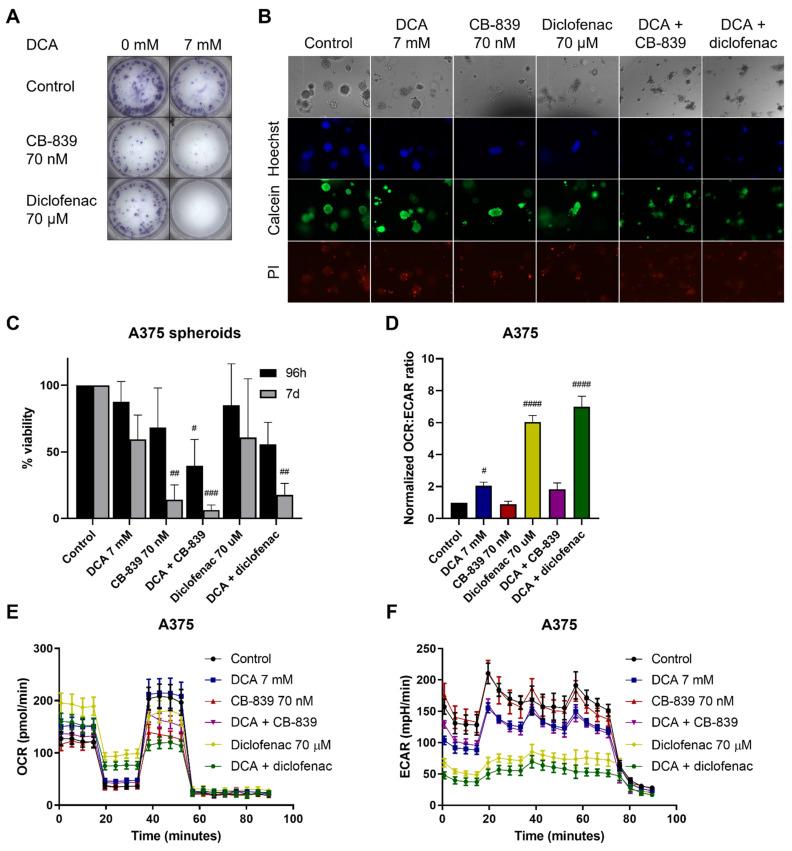
Melanoma is characterized by high glucose uptake, partially mediated through elevated pyruvate dehydrogenase kinase (PDK), making PDK a potential treatment target in melanoma. We aimed to reduce glucose uptake in melanoma cell lines through PDK inhibitors dichloroacetate (DCA) and AZD7545 and through PDK knockdown, to inhibit cell growth and potentially unveil metabolic co-vulnerabilities resulting from PDK inhibition. MeWo cells were most sensitive to DCA, while SK-MEL-2 was the least sensitive, with IC50 values ranging from 13.3 to 27.0 mM. DCA strongly reduced PDH phosphorylation and increased the oxygen consumption rate:extracellular acidification rate (OCR:ECAR) ratio up to 6-fold. Knockdown of single PDK isoforms had similar effects on PDH phosphorylation and OCR:ECAR ratio as DCA but did not influence sensitivity to DCA. Growth inhibition by DCA was synergistic with the glutaminase inhibitor CB-839 (2- to 5-fold sensitization) and with diclofenac, known to inhibit monocarboxylate transporters (MCTs) (3- to 8-fold sensitization). CB-839 did not affect the OCR:ECAR response to DCA, whereas diclofenac strongly inhibited ECAR and further increased the OCR:ECAR ratio. We conclude that in melanoma cell lines, DCA reduces proliferation through reprogramming of cellular metabolism and synergizes with other metabolically targeted drugs.

Keywords: dichloroacetate; melanoma; metabolic reprogramming; metabolism.


Conflict of interest statement

The authors declare no conflict of interest. The funders had no role in the design of the study; in the collection, analyses, or interpretation of data; in the writing of the manuscript; or in the decision to publish the results.

Figures

Figure 1
Figure 1
Effect of PDK inhibition on melanoma cell proliferation. (A) Viability curves after 96 h of treatment with DCA in all cell lines. Viability curve of A375 cells grown in Matrigel treated with DCA for either (B) 96 h after 3 days of initial spheroid development or (C) treated continuously for 7 days. (D) Representative image of Hoechst/Calcein/PI staining of A375 spheroids treated with 14 mM DCA either continuously for 7 days or 24 h after 6 days of initial spheroid formation. 10× magnification. (AC) Data represent mean ± SD of 3 independent experiments, each performed in triplicate. PI: propidium iodide.
Figure 2
Figure 2
Effect of PDK inhibition on PDH and PDK levels in melanoma cells. (A) Schematic view of PDH/PDK axis. (B) Representative image of protein levels of metabolic enzymes at baseline with no treatment in all four cell lines. Representative image of protein levels after 24 h treatment with DCA in (C) A375 and (D) MeWo. Fold change in RNA levels of PDH and PDK1-4 after 24 h treatment with DCA compared to control in (E) A375 and (F) MeWo. (E,F) Data represent mean ± SD of 3 independent experiments, each performed in quadruplicate. Student’s t-test, * p < 0.05, ** p < 0.01, **** p < 0.0001, DCA-treated vs. control.
Figure 3
Figure 3
Metabolic adaptation upon PDK inhibition. (A) Representative image of OCR in A375 cells measured by Seahorse, mean ± SD of 6–8 technical replicates are shown. (B) Representative image of ECAR in A375 cells measured by Seahorse, mean ± SD of 6–8 technical replicates are shown. (C) Spare capacity, e.g., maximal OCR minus basal OCR, is decreased by DCA treatment in A375 cells. DCA treatment does not affect (D) basal OCR, whereas it dose-dependently decreases (E) ECAR in A375 cells. DCA treatment increases the OCR:ECAR ratio in (F) A375, (G) MeWo, (H) SK-MEL-28 and (I) SK-MEL-2 cells. (CI) Data represent mean ± SD of 3–6 independent experiments, each consisting of 6–8 technical replicates. One-way ANOVA followed by Dunnett’s multiple comparison test, # p < 0.05, ## p < 0.01, ### p < 0.001, #### p < 0.0001, DCA-treated vs. control.
Figure 4
Figure 4
Effect of PDK knockdown on RNA levels, protein levels and viability under DCA treatment. (A) Fold change in RNA levels of PDH and PDK1-4 after PDK knockdown compared to the mock knockdown. Data represent mean ± SD of 3 independent experiments, each performed in quadruplicate. One-way ANOVA followed by Dunnett’s multiple comparison test, ## p < 0.01, #### p < 0.0001, shPDK1-4 vs. shLuc. (B) Representative image of protein levels after PDK knockdown and/or DCA treatment. (C) Representative image of OCR in PDK knockdown cell lines measured by Seahorse, mean ± SD of 6–8 technical replicates are shown. (D) Representative image of ECAR in PDK knockdown cell lines measured by Seahorse, mean ± SD of 6–8 technical replicates are shown. (E) PDK knockdown increases the OCR:ECAR ratio, whereas OCR:ECAR ratio is even further increased after DCA treatment in all knockdowns. Data represent mean ± SD of 3 independent experiments, each consisting of 6–8 replicates. One-way ANOVA followed by Dunnett’s multiple comparison test, # p < 0.05, ## p < 0.01, ### p < 0.001, shPDK1-4 vs. shLuc (black bars). Student’s t-test * p < 0.05, ** p < 0.01, **** p < 0.0001, DCA-treated vs. control of the same shRNA (grey bars). (F) The sensitivity of A375 cells to DCA does not change after PDK knockdown. Data are mean ± SD of 3 independent experiments, each performed in triplicate.
Figure 5
Figure 5
DCA shows synergy with other metabolic inhibitors. (A) Viability curve of A375 cells after 96 h of treatment with CB-839 with and without DCA. (B) Viability curve of A375 cells after 96 h of treatment with diclofenac with and without DCA. Data represent mean ± SD of 3 independent experiments, each performed in triplicate.
Figure 6
Figure 6
Clonogenicity and metabolic phenotype of A375 cells under DCA treatment combined with CB-839 and diclofenac. (A) Representative image of clonogenic assay of A375 after 9 days of treatment with DCA and CB-839 or diclofenac. (B) Representative image of Hoechst/Calcein/PI staining of A375 spheroids treated with DCA and CB-839 for 96 h. 10× magnification. (C) Viability of A375 cells grown in Matrigel treated with DCA and CB-839 or diclofenac for either 96 h after initial spheroid development or treated continuously for 7 days. (D) OCR:ECAR ratio (here, normalized to untreated cells) after DCA, CB-839, diclofenac and combination treatments. (E) Representative image of OCR in A375 cells measured by Seahorse, mean ± SD of 6–8 technical replicates are shown. (F) Representative image of ECAR in A375 cells measured by Seahorse, mean ± SD of 6–8 technical replicates are shown. (C,D) Data represent mean ± SD of 3 independent experiments, each performed in quadruplicate. One-way ANOVA followed by Dunnett’s multiple comparison test, # p < 0.05, ## p < 0.01, ### p < 0.001, #### p < 0.0001, drug-treated vs. control.

References

    1. Luebker S.A., Koepsell S.A. Diverse Mechanisms of BRAF Inhibitor Resistance in Melanoma Identified in Clinical and Preclinical Studies. Front. Oncol. 2019;9:268. doi: 10.3389/fonc.2019.00268. - DOI - PMC - PubMed
    1. Robert C., Grob J.J., Stroyakovskiy D., Karaszewska B., Hauschild A., Levchenko E., Chiarion Sileni V., Schachter J., Garbe C., Bondarenko I., et al. Five-Year Outcomes with Dabrafenib plus Trametinib in Metastatic Melanoma. N. Engl. J. Med. 2019;381:626–636. doi: 10.1056/NEJMoa1904059. - DOI - PubMed
    1. Abildgaard C., Guldberg P. Molecular Drivers of Cellular Metabolic Reprogramming in Melanoma. Trends Mol. Med. 2015;21:164–171. doi: 10.1016/j.molmed.2014.12.007. - DOI - PubMed
    1. Ratnikov B.I., Scott D.A., Osterman A.L., Smith J.W., Ronai Z.A. Metabolic Rewiring in Melanoma. Oncogene. 2017;36:147–157. doi: 10.1038/onc.2016.198. - DOI - PMC - PubMed
    1. Shi H., Hugo W., Kong X., Hong A., Koya R.C., Moriceau G., Chodon T., Guo R., Johnson D.B., Dahlman K.B., et al. Acquired Resistance and Clonal Evolution in Melanoma during BRAF Inhibitor Therapy. Cancer Discov. 2014;4:80–93. doi: 10.1158/2159-8290.CD-13-0642. - DOI - PMC - PubMed