. 2022 Mar 29;23(7):3775.
doi: 10.3390/ijms23073775.

In Pancreatic Adenocarcinoma Alpha-Synuclein Increases and Marks Peri-Neural Infiltration

Affiliations

In Pancreatic Adenocarcinoma Alpha-Synuclein Increases and Marks Peri-Neural Infiltration

Matteo Bianchini et al. Int J Mol Sci. .

Abstract

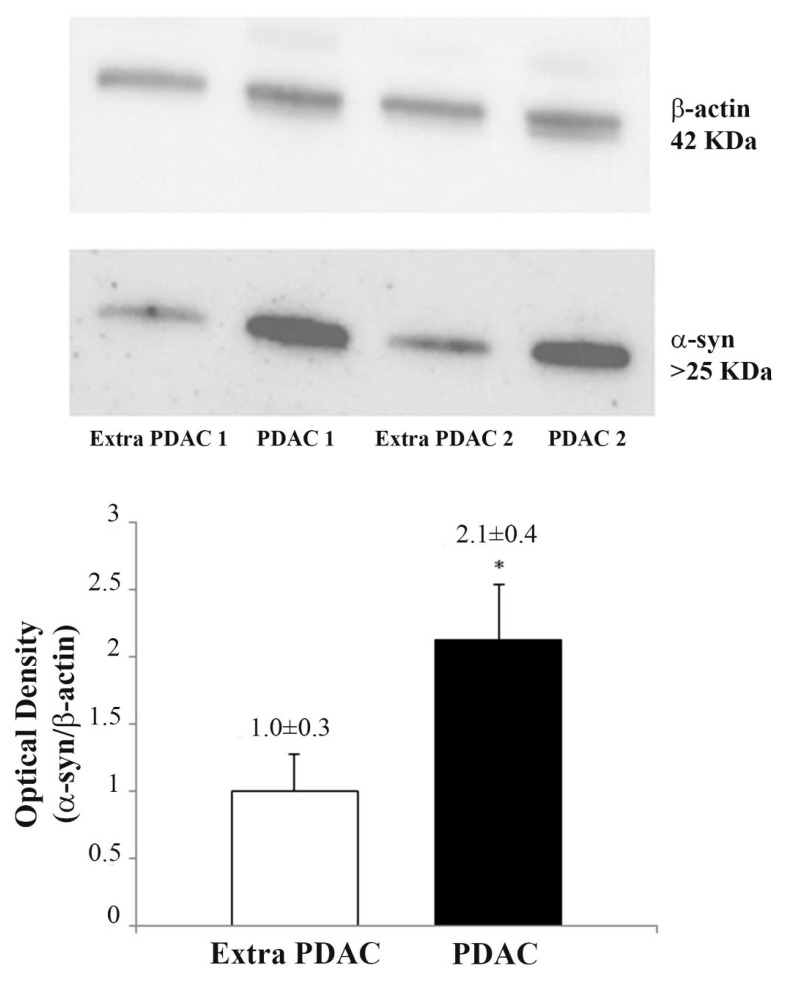
α-Synuclein (α-syn) is a protein involved in neuronal degeneration. However, the family of synucleins has recently been demonstrated to be involved in the mechanisms of oncogenesis by selectively accelerating cellular processes leading to cancer. Pancreatic ductal adenocarcinoma (PDAC) is one of the most lethal human cancers, with a specifically high neurotropism. The molecular bases of this biological behavior are currently poorly understood. Here, α-synuclein was analyzed concerning the protein expression in PDAC and the potential association with PDAC neurotropism. Tumor (PDAC) and extra-tumor (extra-PDAC) samples from 20 patients affected by PDAC following pancreatic resections were collected at the General Surgery Unit, University of Pisa. All patients were affected by moderately or poorly differentiated PDAC. The amount of α-syn was compared between tumor and extra-tumor specimen (sampled from non-affected neighboring pancreatic areas) by using in situ immuno-staining with peroxidase anti-α-syn immunohistochemistry, α-syn detection by using Western blotting, and electron microscopy by using α-syn-conjugated immuno-gold particles. All the methods consistently indicate that each PDAC sample possesses a higher amount of α-syn compared with extra-PDAC tissue. Moreover, the expression of α-syn was much higher in those PDAC samples from tumors with perineural infiltration compared with tumors without perineural infiltration.

Keywords: Western blotting; electron microscopy; electron-microscopy; neuroinvasion; pancreatic ductal adenocarcinoma; ultrastructural stoichiometry; α-synuclein.


Conflict of interest statement

The authors declare no conflict of interest.

Figures

Figure 1
Figure 1
Histology of pancreatic tissue. Extra-PDAC (a) and PDAC, (b) following H & E histochemistry. Extra-PDAC tissue shows normal architecture with well-preserved ductal system (D). In contrast, PDAC tissue is composed of desmoplastic stroma in which the cells lose their integrity. The ducts (D) are enlarged and irregularly shaped. Scale bar = 25 µm.
Figure 2
Figure 2
Expression of α-syn in pancreatic tissue in two patients. Immuno-peroxidase shows weak α-syn staining in extra-PDAC tissue (a,b). Immunoperoxidase shows α-syn-specific labelling in ductal cells (arrows) from PDAC samples (c,d). Anti-α-syn immuno-staining occurring in PDAC tissue is mainly focused in two areas, namely the ductal cells and some intense zones. These include stromal areas from PDAC, which possess intense α-syn immuno-staining according to patches and axon-like linear patterns (Figure 2). The identification of “intense zones” was based on detecting those stromal areas, which were intensely stained by immuno-peroxidase following exposure to α-syn primary antibodies. Scale bar = 30 µm.
Figure 3
Figure 3
Measurement of α-syn immune-histochemistry. Representative picture from PDAC tissue (a). α-syn immune-staining is highly evident in both ductal and stromal regions. The dotted lines encircle the periductal (light blue) and stromal (black) areas as they are selected to carry out the measurement of α-syn immuno-stained areas. The counts of these areas are reported in the graphs. In detail, (b) measures the mean ± S.E.M. of α-syn immuno-stained ductal area given mm2 while (c) reports the percentage of α-syn immuno-stained ductal area in PDAC compared with extra-PDAC (extra-PDAC = 100). The difference between b and c is due to a larger ductal area in PDAC compared with extra-PDAC tissue, and it serves as a reference. (d) Stromal α-syn immuno-stained area is given in mm2. Values are given as the mean ± S.E.M. of N = 100 measures expressed either in surface units (mm2) or in percentage (c) mm2 per group. * p < 0.0001 (bd). Scale bar = 30 µm.
Figure 4
Figure 4
α-Syn immunocytochemistry in PDAC cells at TEM. Representative pictures show α-syn immuno-gold particles (arrows) within pancreatic ductal cells from extra PDAC (a) and PDAC (b,c) areas. Detection of α-syn was carried out for each single molecule. These counts allow stoichiometric quantitative measurement since each immuno-gold particles binds a single α-syn particle. The figures are representative images of how many immuno-gold particles are detectable in PDAC cells. The number of immuno-gold particles is counted both in cells from PDAC and extra-PDAC areas in order to build the graphs and to compare these measurements in Figure 5. Scale bar = 217 nm (low magnification); scale bar = 120 nm (inserts at high magnification).
Figure 5
Figure 5
α-Syn immuno-gold particles per cell. Values are given as the mean ± S.E.M., from N = 60 cells per group. Immuno-gold particles are counted in single cells either from PDAC or extra-PDAC areas. The number are given as the mean + S.E.M. of 60 cells per group. Comparisons were made by using Student t-test. * p < 0.05.
Figure 6
Figure 6
Representative Western blotting of α-syn. In the upper panels, four representative Western blots of a-syn and the house-keeping protein β-actin are reported for extra-PDAC and PDAC tissue. In the lower graph, relative optical density from N = 20 blots is reported. Values are given as the mean ± S.E.M., from N = 20 blots. Comparisons are made by using Student t-test. * p < 0.05.
Figure 7
Figure 7
Comparison of α-synuclein expression between patients without PNI (N = 4) and patients with PNI (N = 16). α-syn immune-blot values are given as the mean ± S.E.M. Comparisons were made by using Student t-test. * p < 0.05.

Similar articles

Cited by

References

    1. Lavedan C., Leroy E., Dehejia A., Buchholtz S., Dutra A., Nussbaum R.L., Polymeropoulos M.H. Identification, localization and characterization of the human γ-synuclein gene. Hum. Genet. 1998;103:106–112. doi: 10.1007/s004390050792. - DOI - PubMed
    1. Lavedan C. The synuclein family. Genome Res. 1998;8:871–880. doi: 10.1101/gr.8.9.871. - DOI - PubMed
    1. Clayton D.F., George J.M. The synucleins: A family of proteins involved in synaptic function, plasticity, neurodegeneration and disease. Trends Neurosci. 1998;21:249–254. doi: 10.1016/S0166-2236(97)01213-7. - DOI - PubMed
    1. Barba L., Paolini Paoletti F., Bellomo G., Gaetani L., Halbgebauer S., Oeckl P., Otto M., Parnetti L. Alpha and Beta Synucleins: From Pathophysiology to Clinical Application as Biomarkers. Mov. Disord. 2022 doi: 10.1002/mds.28941. - DOI - PMC - PubMed
    1. Burré J., Sharma M., Südhof T.C. Cell biology and pathophysiology of α-synuclein. Cold Spring Harb. Perspect. Med. 2018;8:a024091. doi: 10.1101/cshperspect.a024091. - DOI - PMC - PubMed

MeSH terms