. 2022 Mar 30;23(7):3814.
doi: 10.3390/ijms23073814.

Transcriptional Regulation of RIP2 Gene by NFIB Is Associated with Cellular Immune and Inflammatory Response to APEC Infection

Affiliations

Transcriptional Regulation of RIP2 Gene by NFIB Is Associated with Cellular Immune and Inflammatory Response to APEC Infection

Hongyan Sun et al. Int J Mol Sci. .

Abstract

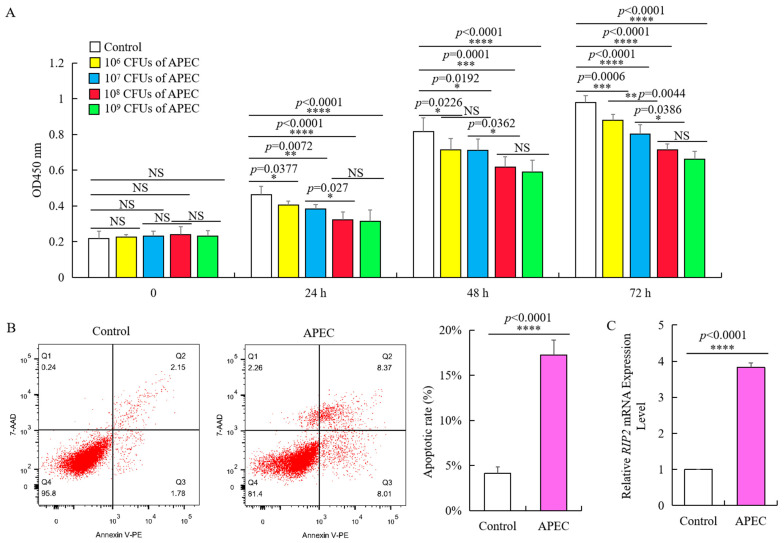
Avian pathogenic E. coli (APEC) can cause localized or systemic infection, resulting in large economic losses per year, and impact health of humans. Previous studies showed that RIP2 (receptor interacting serine/threonine kinase 2) and its signaling pathway played an important role in immune response against APEC infection. In this study, chicken HD11 cells were used as an in vitro model to investigate the function of chicken RIP2 and the transcription factor binding to the RIP2 core promoter region via gene overexpression, RNA interference, RT-qPCR, Western blotting, dual luciferase reporter assay, CHIP-PCR, CCK-8, and flow cytometry assay following APEC stimulation. Results showed that APEC stimulation promoted RIP2 expression and cells apoptosis, and inhibited cells viability. Knockdown of RIP2 significantly improved cell viability and suppressed the apoptosis of APEC-stimulated cells. Transcription factor NFIB (Nuclear factor I B) and GATA1 (globin transcription factor 1) binding site was identified in the core promoter region of RIP2 from -2300 bp to -1839 bp. However, only NFIB was confirmed to be bound to the core promoter of RIP2. Overexpression of NFIB exacerbated cell injuries with significant reduction in cell viability and increased cell apoptosis and inflammatory cytokines levels, whereas opposite results were observed in NFIB inhibition treatment group. Moreover, RIP2 was up-regulated by NFIB overexpression, and RIP2 silence mitigated the effect of NFIB overexpression in cell apoptosis, inflammation, and activation of NFκB signaling pathways. This study demonstrated that NFIB overexpression accelerated APEC-induced apoptosis and inflammation via up-regulation of RIP2 mediated downstream pathways in chicken HD11 cells.

Keywords: APEC; NFIB; RIP2; apoptosis; gene expression; immune response.


Conflict of interest statement

The authors have no conflict of interest to declare.

Figures

Figure 1
Figure 1
The expression level of genes in NOD-like receptor signaling pathway in different immune tissues of the same individual bird with APEC infection. (A) The expression level of IL8L2, IL1B, IL18, RIP2, PSTPIP1, NOD1, HSP90B1, CARD9, MAPK1, MAPK11, and CASP8 in NOD-like receptor signaling pathway in bone marrow upon APEC infection based on the data of GSE67302. (B) The expression level of IL8L2, IL18, IL8L1, MAPK12, MAPK11, BIRC2, CARD9, NOD1, and RIP2 in NOD-like receptor signaling pathway in thymus upon APEC infection based on the data of GSE69014. (C) The expression level of MAPK8, IL18, TRAF6, HSP90AB1, NOD1, RIP2, and ITA in NOD-like receptor signaling pathway in bursa upon APEC infection based on the data of GSE70334. (D) The expression level of MAPK11, MAPK1, CASP8, ERBB2IP, IL8L2, RIP2, and NOD1 in NOD-like receptor signaling pathway in leukocytes in blood upon APEC infection based on the data of GSE31387. (E) The expression level of IL1B, IL18, IL6, RIP2, NOD1, and CASP8 in NOD-like receptor signaling pathway in spleen upon APEC infection based on the data of GSE25511.
Figure 2
Figure 2
APEC promoted RIP2 expression and apoptosis, and suppressed the viability of chicken HD11 cells. (A) Viability of chicken HD11 cells analyzed at 24, 48, and 72 h after APEC infection (data are shown as mean ± SD, n = 5 independent experiments. * p < 0.05, ** p < 0.01, *** p < 0.001, and **** p < 0.0001, one-way ANOVA, LSD. OD, optical density). (B) Flow cytometry was used to detect apoptosis of chicken HD11 cells treated with APEC at 24 h (data are shown as mean ± SD, n = 5 independent experiments. **** p < 0.0001, one-way ANOVA, LSD). (C) RIP2 expression in APEC-treated chicken HD11 cells after 24 h was determined using RT-qPCR (data are shown as mean ± SD, n = 5 independent experiments. **** p < 0.0001, one-way ANOVA, LSD).
Figure 3
Figure 3
RIP2 knockdown reverses the APEC-induced effects on viability and apoptosis of chicken HD11 cells. (A) RT-qPCR analysis of RIP2 expression in normal HD11 cells, and HD11 cell transfected with negative control (Sh-NC), and Sh-RIP2 (data are shown as mean ± SD, n = 5 independent experiments. **** p < 0.0001, one-way ANOVA, LSD). (B) RT-qPCR analysis of RIP2 expression in normal HD11 cells, and HD11 cell transfected with negative control (Sh-NC), and Sh-RIP2 chicken HD11 cell at 24 h post APEC treatment (data are shown as mean ± SD, n = 5 independent experiments. **** p < 0.0001, one-way ANOVA, LSD). (C) Viability was evaluated in chicken HD11 cells transfected with either Sh-NC or Sh-RIP2 at 24, 48, and 72 h after treatment with APEC (data are shown as mean ± SD, n = 5 independent experiments. **** p < 0.0001, one-way ANOVA, LSD). (D) Apoptotic rate of chicken HD11 cells treated with APEC and transfected with Sh-NC or Sh-RIP2 (data are shown as mean ± SD, n = 5 independent experiments. **** p < 0.0001, one-way ANOVA, LSD). (E) Flow cytometry was used to detect the apoptosis change of chicken HD11 cells after treatment with APEC and transfection with Sh-NC or Sh-RIP2.
Figure 4
Figure 4
Identification of chicken RIP2 promoter through luciferase activity of the different inserted fragments and prediction of regulatory elements. (A) Luciferase activity of the different inserted fragments of the chicken RIP2 promoter in HD11 cells (data are shown as mean ± SD, n = 5 independent experiments. **** p < 0.0001, one-way ANOVA, LSD). (B) Luciferase activity of the different inserted fragment of the chicken RIP2 promoter in DF1 cells (data are shown as mean ± SD, n = 5 independent experiments. ** p < 0.01, **** p < 0.0001, one-way ANOVA, LSD). (C) Prediction of binding sites for transcription factors at −1839 to +54 bp of RIP2 in the genomic assembly of Gllus gallus 6.0.
Figure 5
Figure 5
Identification of transcription factor binding sites in the promoter of RIP2. (A,B) Agarose gel electrophoresis of amplified NFIB (A) and GATA1 (B) insertion. (C,D) Identification of inserted fragment in pcDNA3.1-GATA1 (C) and pcDNA3.1-NFIB (D) through double enzyme digestion. (E) Luciferase activity analysis of RIP2 promoter in different conditions with or without pcDNA3.1-GATA1 (data are shown as mean ± SD, n = 5 independent experiments. **** p < 0.0001, one-way ANOVA, LSD). (F) Luciferase activity analysis of RIP2 promoter in different conditions with or without pcDNA3.1-NFIB (data are shown as mean ± SD, n = 5 independent experiments. **** p < 0.0001, one-way ANOVA, LSD). (G) Agarose gel electrophoresis analysis of the sonicated DNA fragments for CHIP-PCR experiment. (H) Binding of NFIB to the promoter region of RIP2 in chicken HD11 cells analyzed by ChIP-PCR (Input is the PCR amplification product of the sample without immunoprecipitation reaction (input control); IgG is the PCR amplification product of mouse IgG antibody (negative control); anti-NFIB is the PCR amplification product of fragments bound by NFIB and isolated with NFIB antibody; data are shown as mean ± SD, n = 3 independent experiments. *** p < 0.001, **** p < 0.0001, one-way ANOVA, LSD).
Figure 6
Figure 6
siRNA knockdown of NFIB expression in chicken HD11 cells. (A) Transfection efficiency was tested by small interfering RNA under a fluorescence microscope. (B) Levels of NFIB mRNA expression in chicken HD11 cells transfected with Si-NFIB-1, Si-NFIB-2, or Si-NFIB-3, and the control groups (data are shown as the mean ± SD, n = 5 independent experiments. *** p < 0.001, **** p < 0.0001, one-way ANOVA, LSD). (C) Western blotting of protein extracted from chicken HD11 cells transfected with Si-NFIB-1, Si-NFIB-2, or Si-NFIB-3 and the control groups; GAPDH was included as a loading control. (D) Image J software was used for gray-level analysis of NFIB in HD11 cells transfected with Si-NFIB-1, Si-NFIB-2, or Si-NFIB-3 and the control groups (data are shown as the mean ± SD, n = 3 independent experiments. *** p < 0.001, **** p < 0.0001, one-way ANOVA, LSD).
Figure 7
Figure 7
RIP2 expression level was positively modulated by NFIB expression in HD11 cells regardless of APEC infection. (A) The mRNA expression of RIP2 was detected in HD11 cells with overexpression or knockdown of NFIB in comparison to negative controls under conditions with or without APEC treatment by RT-qPCR (data are shown as the mean ± SD, n = 5 independent experiments. * p < 0.05, *** p < 0.001, and **** p < 0.0001, one-way ANOVA, LSD). (B) The protein expression of RIP2 in the same experiment was measured by Western blot. (C) Image J software was used for gray-level analysis of RIP2 in different treatments in the same experiment (data are shown as the mean ± SD, n = 3 independent experiments. ** p < 0.01, **** p < 0.0001, one-way ANOVA, LSD).
Figure 8
Figure 8
NFIB enhanced APEC-induced injuries through modulation of RIP2 in chicken HD11 cells. Chicken HD11 cells were transfected with Sh-RIP2, pcDNA3.1-NFIB, APEC, co-transfected with pcDNA3.1-NFIB and APEC, or co-transfected with pcDNA3.1-NFIB, Sh-RIP2, and APEC, respectively. (A) Cell viability was measured by cell counting kit-8 (CCK8) in different treatment conditions (data are shown as the mean ± SD, n = 5 independent experiments. * p < 0.05, *** p < 0.001, and **** p < 0.0001, one-way ANOVA, LSD). (B) The mRNA expression level of IL1β in different treatment conditions (data are shown as the mean ± SD, n = 5 independent experiments. ** p < 0.01, **** p < 0.0001, one-way ANOVA, LSD). (C) The mRNA expression level of IL8 in different treatment conditions (data are shown as the mean ± SD, n = 5 independent experiments. * p < 0.05, ** p < 0.01, and **** p < 0.0001, one-way ANOVA, LSD). (D) Cell apoptosis was measured by flow cytometry with annexin V-PE/7-AAD in different treatment conditions. (E) The mRNA expression level of IL6 in different treatment conditions (data are shown as the mean ± SD, n = 5 independent experiments. ** p < 0.01, *** p < 0.001, and **** p < 0.0001, one-way ANOVA, LSD). (F) The protein expression of IL1β, IL8, and IL6 was measured by Western blotting with different treatment conditions. (G) Nitric oxide production in different treatments (data are shown as the mean ± SD, n = 5 independent experiments. * p < 0.05, **** p < 0.0001, one-way ANOVA, LSD). (HJ) Image J software was used for gray-level analysis of protein expression of IL1β (H), IL8 (I), and IL6 (J) in different treatments (data are shown as the mean ± SD, n = 3 independent experiments. ** p < 0.01, *** p < 0.001, and **** p < 0.0001, one-way ANOVA, LSD).
Figure 9
Figure 9
NFIB overexpression activated NFκB signaling pathway by up-regulating RIP2. Chicken HD11 cells were transfected with Sh-RIP2, pcDNA3.1-NFIB, and APEC, co-transfected with pcDNA3.1-NFIB and APEC, or co-transfected with pcDNA3.1-NFIB, Sh-RIP2, and APEC. (A,B) The mRNA expression of NFκBp65 (A) and IκBα (B) was detected by RT-qPCR (data are shown as the mean ± SD, n = 5 independent experiments. * p < 0.05, *** p < 0.001, and **** p < 0.0001, one-way ANOVA, LSD). (C) The protein expression of NFκBp65 and IκBα were measured by Western blot. (D,E) Image J software was used for gray-level analysis of NFκBp65 (D) and IκBα (E) in different treatments (data are shown as the mean ± SD, n = 3 independent experiments. * p < 0.05, ** p < 0.01, *** p < 0.001 and **** p < 0.0001, one-way ANOVA, LSD).

Similar articles

Cited by

References

    1. Guabiraba R., Schouler C. Avian colibacillosis: Still many black holes. FEMS Microbiol. Lett. 2015;362:fnv118. doi: 10.1093/femsle/fnv118. - DOI - PubMed
    1. Nolan L.K., John B.H., Vaillancourt J.P., Abdul-Aziz T., Logue C.M. Colibacillosis. In: Swayne D.E., editor. Diseases of Poultry. John Wiley & Sons, Ltd.; Hoboken, NJ, USA: 2017. pp. 751–805.
    1. Huja S., Oren Y., Trost E., Brzuszkiewicz E., Biran D., Blom J., Goesmann A., Gottschalk G., Hacker J., Ron E.Z. Genomic avenue to avian colisepticemia. MBio. 2015;6:e01681-14. doi: 10.1128/mBio.01681-14. - DOI - PMC - PubMed
    1. Mellata M. Human and avian extraintestinal pathogenic Escherichia coli: Infections, zoonotic risks, and antibiotic resistance trends. Foodborne Pathog. Dis. 2013;10:916–932. doi: 10.1089/fpd.2013.1533. - DOI - PMC - PubMed
    1. Clermont O., Bonacorsi S., Bingen E. Rapid and simple determination of the Escherichia coli phylogenetic group. Appl. Environ. Microbiol. 2000;66:4555–4558. doi: 10.1128/AEM.66.10.4555-4558.2000. - DOI - PMC - PubMed

MeSH terms

Substances

LinkOut - more resources