. 2022 Mar 30;23(7):3832.
doi: 10.3390/ijms23073832.

Crocetin Prolongs Recovery Period of DSS-Induced Colitis via Altering Intestinal Microbiome and Increasing Intestinal Permeability

Affiliations

Crocetin Prolongs Recovery Period of DSS-Induced Colitis via Altering Intestinal Microbiome and Increasing Intestinal Permeability

Peishi Feng et al. Int J Mol Sci. .

Abstract

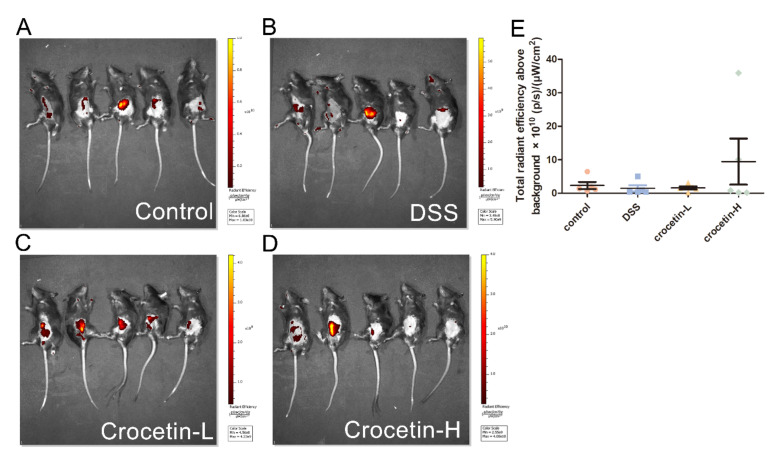
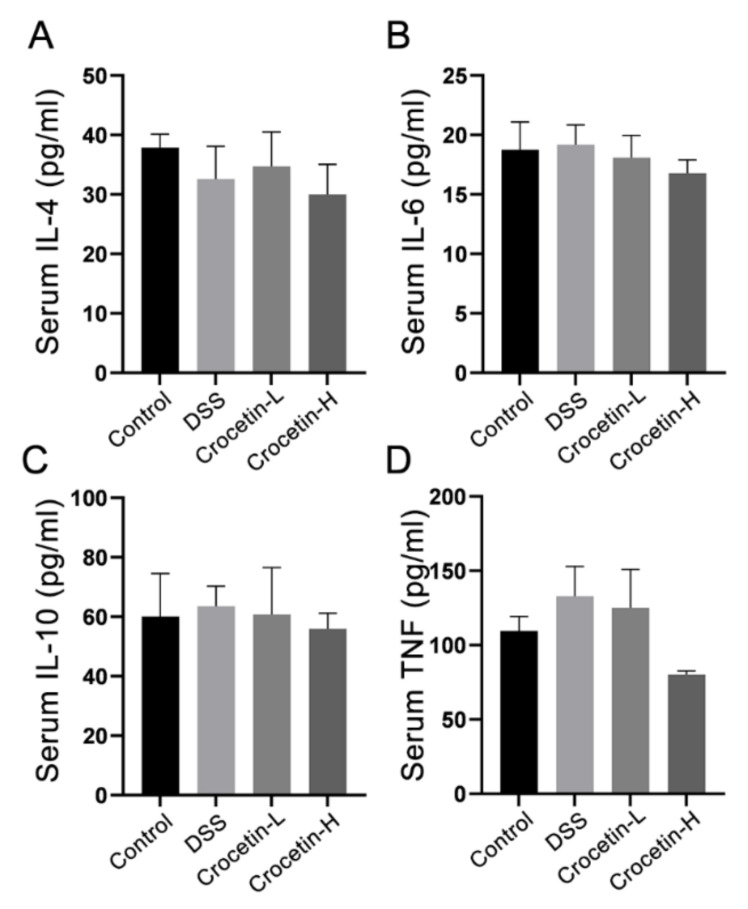
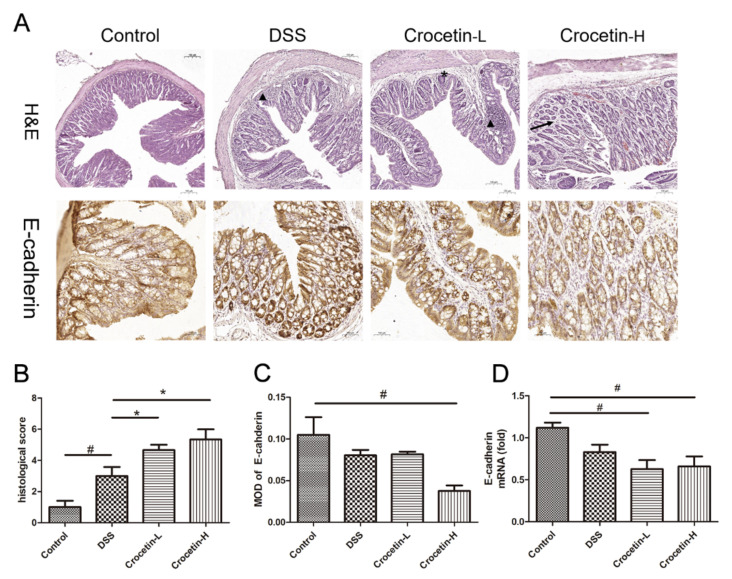
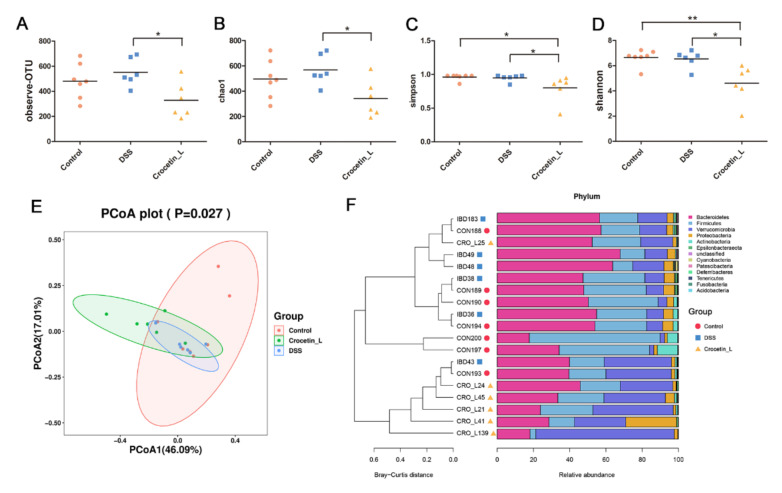
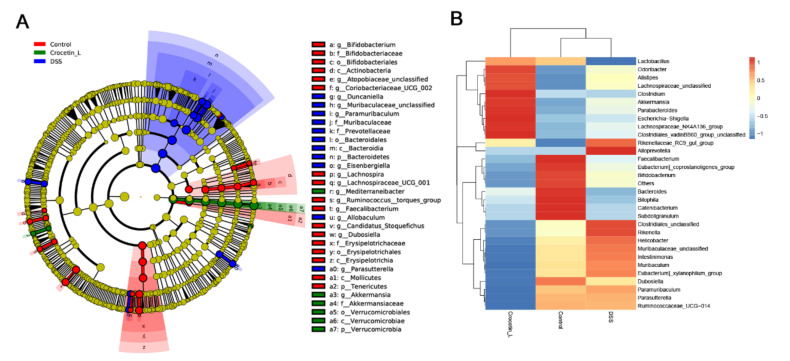
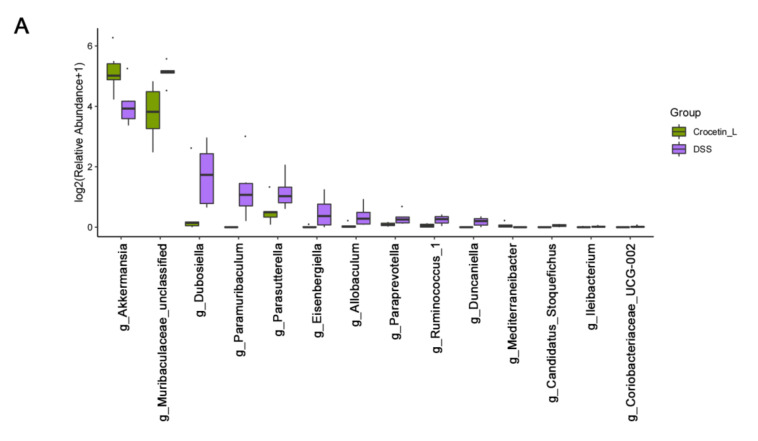
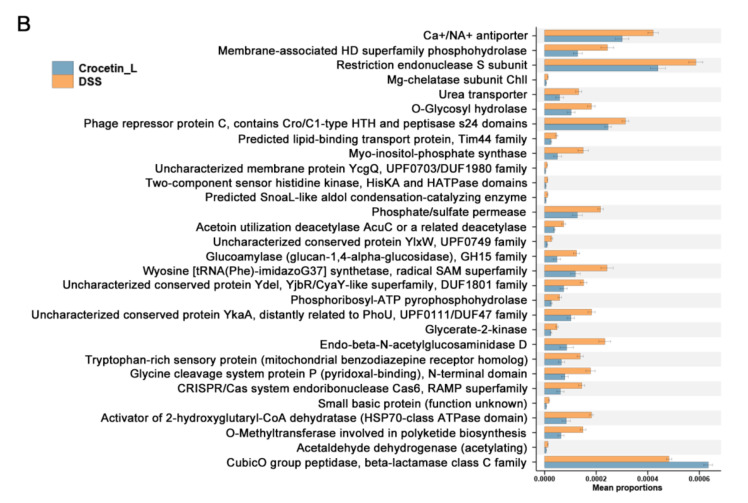
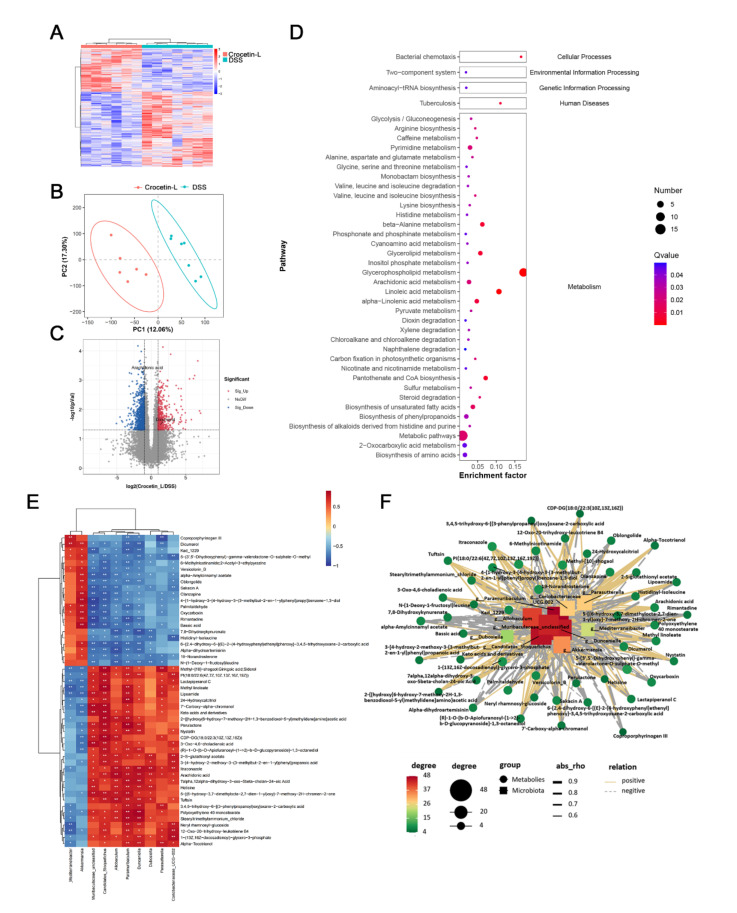
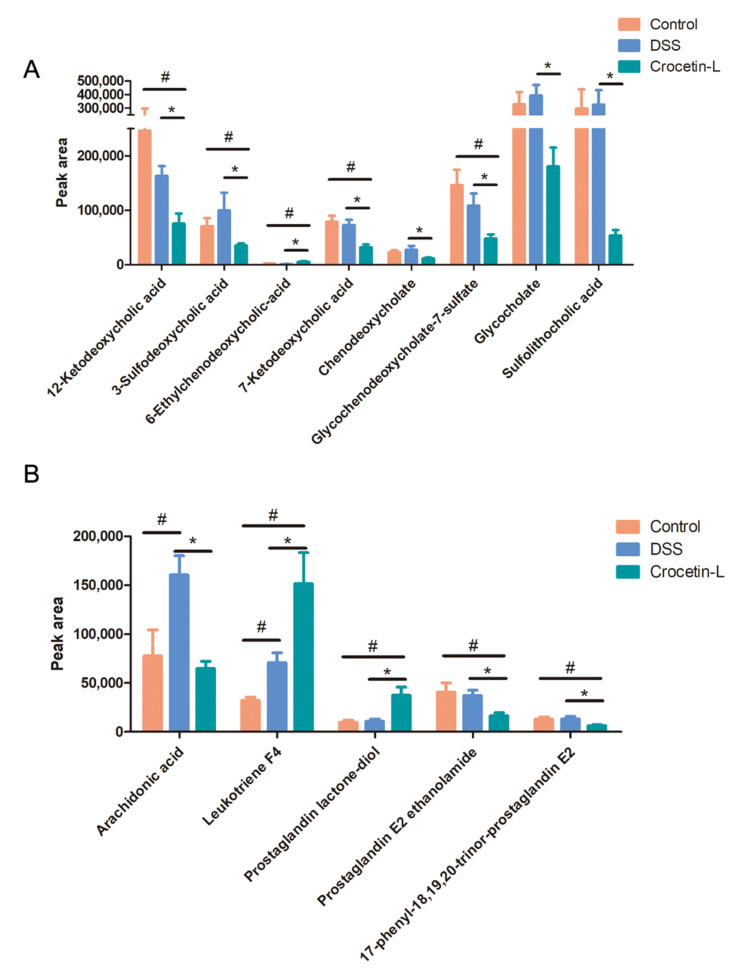
Crocetin is one of the major active constituents of saffron (Crocus sativus L.) which has a reputation for facilitating blood circulation and dispersing blood stasis in traditional Chinese medicine. However, there is little evidence showing the relationship between crocetin intake and the risk of gastrointestinal diseases such as colitis. In order to investigate the effect of crocetin on the regulation of intestinal barrier function and intestinal microbiota composition, mice were treated with crocetin after 3% dextran sulfate sodium (DSS) administration for one week. We found that crocetin intake at 10 mg/kg aggravated colitis in mice, showing increased weight loss and more serious histological abnormalities compared with the DSS group. The 16s rDNA sequencing analysis of the feces samples showed that mice treated with 10 mg/kg crocetin had lower species diversity and richness than those treated with DSS. At the genus level, a higher abundance of Akkermansia and Mediterraneibacter, and a lower abundance of Muribaculaceae, Dubosiella, Paramuribaculum, Parasutterella, Allobaculum, Duncaniella, Candidatus Stoquefichus, and Coriobacteriaceae UCG-002 were observed in the crocetin group. Untargeted metabolomic analyses revealed that crocetin reduced the levels of primary and secondary bile acids such as 12-ketodeoxycholic acid, 7-ketodeoxycholic acid, 3-sulfodeoxycholic acid, 6-ethylchenodeoxycholic acid, chenodeoxycholate, glycochenodeoxycholate-7-sulfate, glycocholate, and sulfolithocholic acid in the colon. In conclusion, crocetin intake disturbed intestinal homeostasis and prolonged recovery of colitis by promoting inflammation and altering gut microbiota composition and its metabolic products in mice. Our findings suggest that patients with gastrointestinal diseases such as inflammatory bowel disease should use crocetin with caution.

Keywords: crocetin; gut microbiota; inflammatory bowel disease; intestinal metabolites; ulcerative colitis.


Conflict of interest statement

The authors declare no conflict of interest.

Figures

Figure 1
Figure 1
Genome-wide identification and expression profiles of the HEX genes in B. mori. (A) Gene structure and (B) protein domains of nine GH20 HEX genes identified in B. mori. Glycohydro 20b2 and Glyco hydro 20 are abbreviations of glycoside hydrolase 20b2 and glycoside hydrolase 20 in SMART. (C) Phylogenetic analysis of HEXs of B. mori and other species. The phylogenetic tree was constructed using neighbor-joining method and bootstrap support values on 1000 replicates by MEGA7. The HEX proteins in B. mori are labeled with a red line. (D) Heatmap of the expression level of eight HEX genes in 12 tissues (from the outside to the inside: anterior silk gland, epidermis, fat body, head, hemolymph, Mal-pighian tubule, middle silk gland, midgut, ovary, posterior silk gland, testis, and trachea) on day three of the fifth instar and wandering stage. Red dots indicate epidermis. 5L3D: day three of fifth instar and W: wandering stage. (E) Heatmap of the expression level of eight HEX genes in seven developmental stages (from the outside to the inside: day three of fourth instar; molting phase in the fourth instar; the start of the fifth instar; day three of fifth instar; W, wandering stage; PP, pre-pupa stage; and P1, day one of pupa) of the epidermis, ovary, and testis in Bombyx mori. Blue indicates low expression and red indicates high expression.
Figure 2
Figure 2
Influence of crocetin in DSS-induced colitis mice on intestinal permeability. FMI of Control (A), DSS (B), Crocetin-L (C), and Crocetin-H (D) mice gavaged with FD4. (E) Quantification of in vivo FD4. Data are presented as mean ± SD.
Figure 3
Figure 3
Effect of crocetin on serum concentration of IL-4 (A), IL-6 (B), IL-10 (C), and TNF (D). Data are presented as mean ± SD.
Figure 4
Figure 4
Evaluation of the effect of crocetin in DSS-induced colitis mice by histological examination and immunohistochemistry. (A) H&E staining and immunohistochemistry of E-cadherin in colon of all groups. Arrow indicates crypt loss, asterisk indicates goblet cell loss, triangle indicates infiltration of inflammatory cells. (B) Histological score in DSS induced colitis. (C) Mean optical density (MOD) of E-cadherin. MOD = sum integrated optical density/area. (D) mRNA expression levels of E-cadherin are shown relative to Control. Data are presented as mean ± SD. * p < 0.05, compared to DSS group; # p < 0.05, compared to Control.
Figure 5
Figure 5
Gut microbial community abundance at the phylum level. (A) Alpha diversity based on observing OTU level. (B) Alpha diversity based on Chao1 index. (C) Alpha diversity based on Simpson index. (D) Alpha diversity based on Shannon index. (E) The PCoA plots were constructed with the weighted UniFrac PCoA method. (F) The compositions and relationship of intestine microbiota in Control, DSS, and Crocetin-L group. * p < 0.05, ** p < 0.01.
Figure 6
Figure 6
Differences in composition of the gut microbiota among Control, DSS, and Crocetin-L group. (A) Differential abundance microbiota taxonomic cladogram obtained from LEfSe analysis. (B) Heatmap plot depicting the normalized abundance of each microbiota genus in Control, DSS, and Crocetin-L group.
Figure 7
Figure 7
Comparison of gut microbiota between DSS and Crocetin-L group. (A) Differences in the relative abundances of intestine microbiota between DSS and Crocetin-L group at the genus level (Mann-Whitney U test). The box presented the 95% Cls, the line inside denotes the median. (B) Comparison of COG pathway abundance between DSS and Crocetin-L group using PICRUSt2.
Figure 7
Figure 7
Comparison of gut microbiota between DSS and Crocetin-L group. (A) Differences in the relative abundances of intestine microbiota between DSS and Crocetin-L group at the genus level (Mann-Whitney U test). The box presented the 95% Cls, the line inside denotes the median. (B) Comparison of COG pathway abundance between DSS and Crocetin-L group using PICRUSt2.
Figure 8
Figure 8
Gut metabolomic profiling. (A) Heatmap showing the significantly changed metabolites of individuals in Crocetin-L group compared with DSS group. (B) PLS-DA scores plot revealed a clear separation of gut metabolites between the Crocetin-L and DSS groups. (C) Volcano plots of differential metabolites between Crocetin-L and DSS groups, red dots represent significantly up-regulated metabolites, blue dots represent significantly down-regulated metabolites, and grey dots represent metabolites with no significant change. (D) KEGG enriched pathways of differential gut metabolites in Crocetin-L group compared with DSS group. (E) Correlation of gut metabolites and microbiota between the Crocetin-L and DSS group. (F) Correlation network of differential metabolites and microbiota between the Crocetin-L and DSS group.
Figure 9
Figure 9
Results of absolute peak area analysis. (A) Primary and secondly bile acid. (B) Arachidonic acid and its metabolites. * p < 0.05, compared to DSS group; # p < 0.05 compared to Control.

Similar articles

Cited by

References

    1. Dmochowska N., Wardill H., Hughes P. Advances in Imaging Specific Mediators of Inflammatory Bowel Disease. Int. J. Mol. Sci. 2018;19:2471. doi: 10.3390/ijms19092471. - DOI - PMC - PubMed
    1. Ng S.C., Shi H.Y., Hamidi N., Underwood F.E., Tang W., Benchimol E.I., Panaccione R., Ghosh S., Wu J., Chan F., et al. Worldwide incidence and prevalence of inflammatory bowel disease in the 21st century: A systematic review of population-based studies. Lancet. 2017;390:2769–2778. doi: 10.1016/S0140-6736(17)32448-0. - DOI - PubMed
    1. Pavel F.M., Vesa C.M., Gheorghe G., Diaconu C.C., Stoicescu M., Munteanu M.A., Babes E.E., Tit D.M., Toma M.M., Bungau S. Highlighting the Relevance of Gut Microbiota Manipulation in Inflammatory Bowel Disease. Diagnostics. 2021;11:1090. doi: 10.3390/diagnostics11061090. - DOI - PMC - PubMed
    1. Huang P., Jiang A., Wang X., Zhou Y., Tang W., Ren C., Qian X., Zhou Z., Gong A. NMN Maintains Intestinal Homeostasis by Regulating the Gut Microbiota. Front. Nutr. 2021;8:714604. doi: 10.3389/fnut.2021.714604. - DOI - PMC - PubMed
    1. Shastry R.P., Rekha P.D. Bacterial cross talk with gut microbiome and its implications: A short review. Folia Microbiol. 2021;66:15–24. doi: 10.1007/s12223-020-00821-5. - DOI - PubMed

LinkOut - more resources