. 2022 Mar 31;23(7):3845.
doi: 10.3390/ijms23073845.

The Evidence for Effective Inhibition of INa Produced by Mirogabalin ((1R,5S,6S)-6-(aminomethyl)-3-ethyl-bicyclo [3.2.0] hept-3-ene-6-acetic acid), a Known Blocker of CaV Channels

Affiliations

The Evidence for Effective Inhibition of INa Produced by Mirogabalin ((1R,5S,6S)-6-(aminomethyl)-3-ethyl-bicyclo [3.2.0] hept-3-ene-6-acetic acid), a Known Blocker of CaV Channels

Chao-Liang Wu et al. Int J Mol Sci. .

Abstract

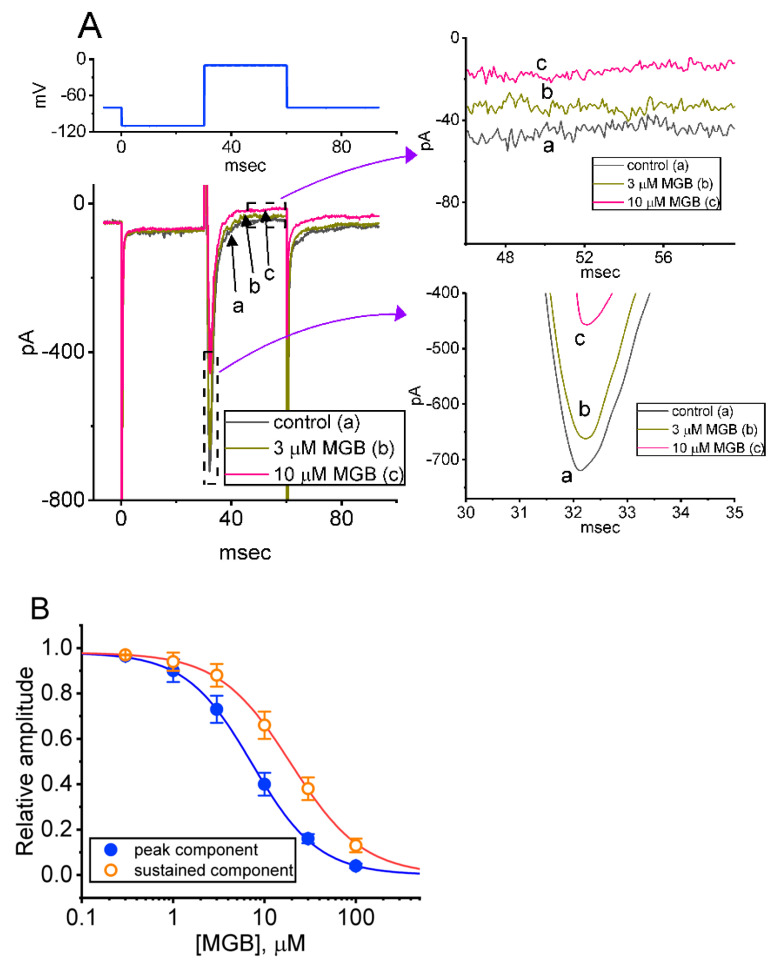
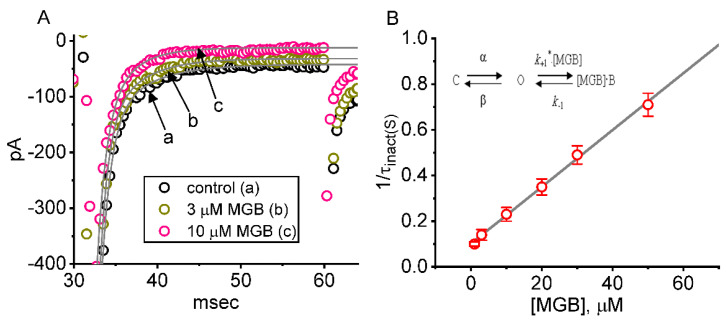
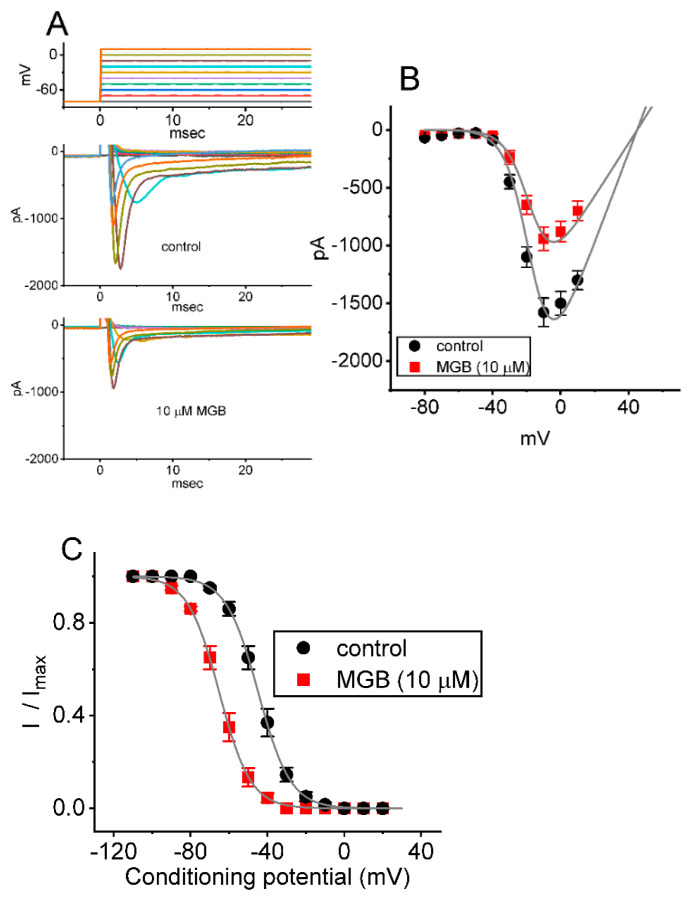
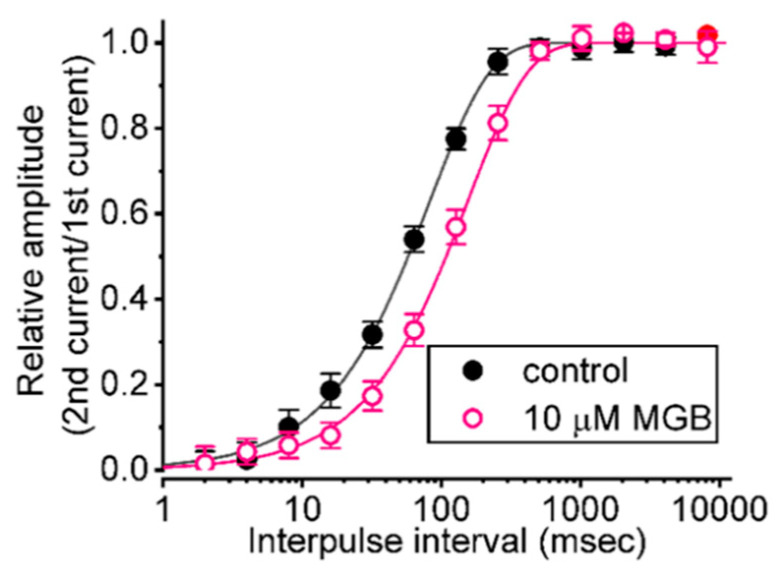
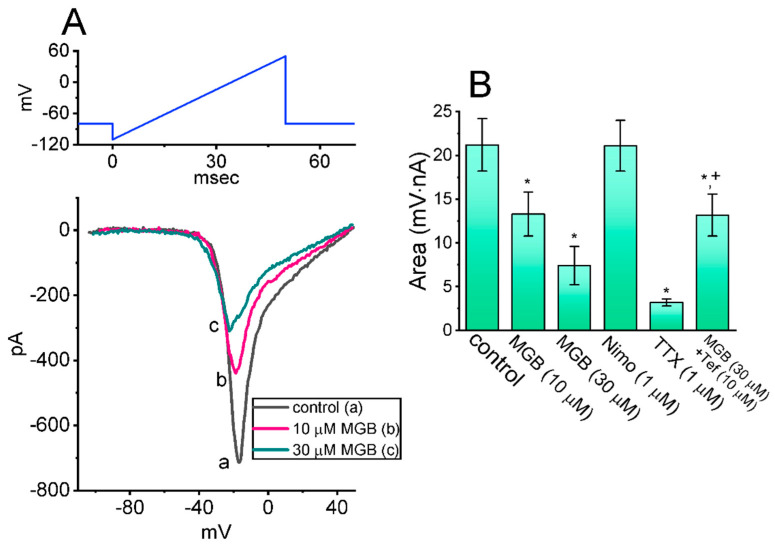
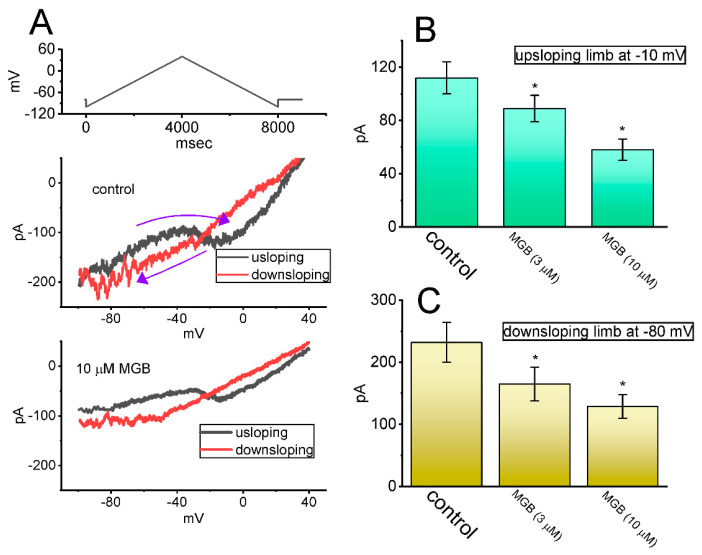
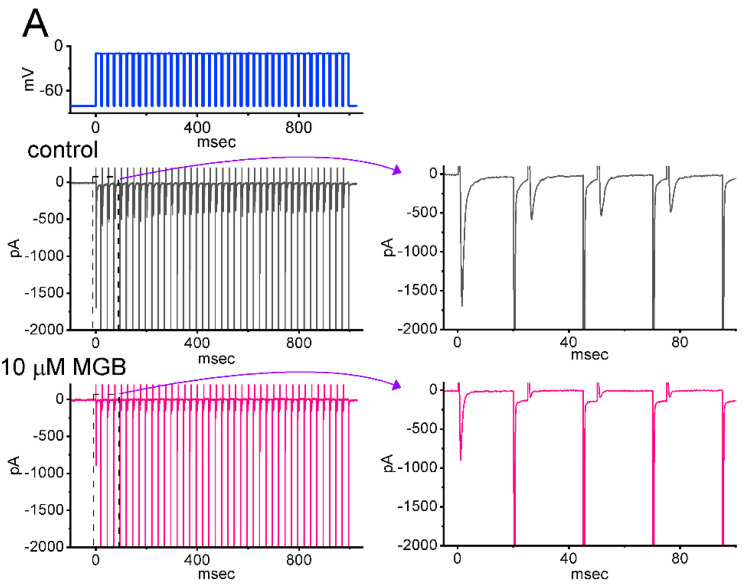
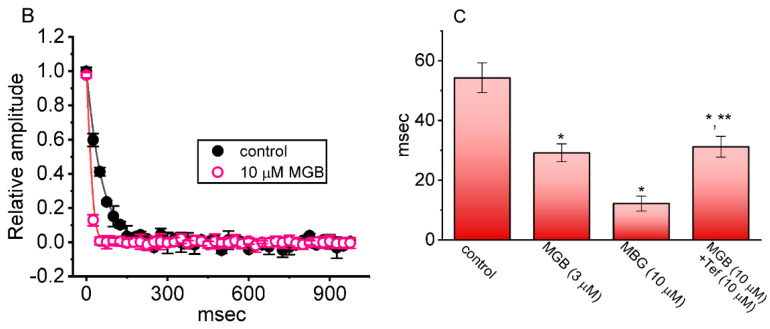
Mirogabalin (MGB, Tarlige®), an inhibitor of the α2δ-1 subunit of voltage-gated Ca2+ (CaV) channels, is used as a way to alleviate peripheral neuropathic pain and diabetic neuropathy. However, to what extent MGB modifies the magnitude, gating, and/or hysteresis of various types of plasmalemmal ionic currents remains largely unexplored. In pituitary tumor (GH3) cells, we found that MGB was effective at suppressing the peak (transient, INa(T)) and sustained (late, INa(L)) components of the voltage-gated Na+ current (INa) in a concentration-dependent manner, with an effective IC50 of 19.5 and 7.3 μM, respectively, while the KD value calculated on the basis of minimum reaction scheme was 8.2 μM. The recovery of INa(T) inactivation slowed in the presence of MGB, although the overall current-voltage relation of INa(T) was unaltered; however, there was a leftward shift in the inactivation curve of the current. The magnitude of the window (INa(W)) or resurgent INa (INa(R)) evoked by the respective ascending or descending ramp pulse (Vramp) was reduced during cell exposure to MGB. MGB-induced attenuation in INa(W) or INa(R) was reversed by the further addition of tefluthrin, a pyrethroid insecticide known to stimulate INa. MGB also effectively lessened the strength of voltage-dependent hysteresis of persistent INa in response to the isosceles triangular Vramp. The cumulative inhibition of INa(T), evoked by pulse train stimulation, was enhanced in its presence. Taken together, in addition to the inhibition of CaV channels, the NaV channel attenuation produced by MGB might have an impact in its analgesic effects occurring in vivo.

Keywords: current kinetics; hysteresis; mirogabalin (Tarlige®, 1R,5S,6S)-6-(aminomethyl)-3-ethyl-bicyclo [3.2.0] hept-3-ene-6-acetic acid); persistent Na+ current; pulse train stimulation; resurgent Na+ current; voltage-gated Na+ current; window Na+ current.


Conflict of interest statement

The authors have no conflicts of interest to disclose. The content and writing of this paper are solely the responsibility of the authors.

Figures

Figure 1
Figure 1
Effect of mirogabalin (MGB) on voltage-gated Na+ current (INa) identified in pituitary GH3 cells. In this series of experiments, we bathed cells in Ca2+-free Tyrode’s solution, which contained 10 mM tetraethylammonium chloride (TEA) and 0.5 mM CdCl2, and the electrode that was used was filled up with a solution containing Cs+. (A) Representative current traces acquired in the control period (a) (i.e., absence of MGB) and during the exposure to 3 μM MGB (b) or 10 μM MGB (c). The voltage clamp protocol that we applied is illustrated in the upper part. The graphs shown in the right side of (A) indicate the expanded records from the left side (dashed boxes). (B) Concentration–response curve of MGB-induced block of peak (transient) INa (INa(T)) or sustained (late) INa (INa(L)) occurring in GH3 cells. The continuous line drawn represents the goodness-of-fit to the modified Hill equation, as described in Section 4. The IC50 values for the MGB-induced inhibition of INa(T) and INa(L) were optimally estimated to be 19.5 and 7.3 μM, respectively. Each point represents the mean ± SEM (n = 8–10).
Figure 2
Figure 2
Kinetic assessment of MGB-induced block of INa. (A) Inactivation time courses of INa evoked by the depolarizing step from −100 to −10 mV for a duration of 30 ms. Each current trajectory in the absence (a), and the presence of 3 μM MGB (b), or 10 μM MGB (c) was well fitted with a least squares criterion by two-exponential decay, i.e., the sum of two exponentials (indicated by the gray smooth line). The values of the fast or slow component (i.e., τinact(S)) in the inactivation time constants of INa(T) obtained in the control period and during exposure to 3 and 10 μM MGB were 1.11, 0.098, and 0.091 ms (fast component), or 4.96, 4.13, and 3.31 ms (slow component), respectively. (B) Relationship of the MGB concentration as a function of the slow component in the inactivation rate constant (1/τinact(S)) (mean ± SEM; n = 7 for each point). Of note, the value of 1/τinact(S) is linearly proportionally to the MBG concentration. Based on the heuristic minimal binding scheme (shown in the Supplementary Information), the value of k+1 * and k−1 were estimated to be 0.0124 ms−1μM−1 and 0.102 ms−1, respectively; therefore, the KD value (k−1/k+1*, i.e., dissociation constant) turned out to be 8.2 μM, a value which shares a similarity with the IC50 value required for its inhibitory effect on INa(L), but smaller than that on INa(T) amplitude.
Figure 3
Figure 3
Mean current-voltage (I-V) relationship of INa(T) in GH3 cells. The preparations made during this series of experiments are the same as those described in Figure 1 and Figure 2. The examined cell was maintained at −80 mV and a series of depolarizing command voltages ranging from −80 to +10 mV in 10 mV steps were applied to it. (A) Representative current traces taken in the control period (upper) and during cell exposure to 10 μM MGB. The uppermost part shows the voltage protocol applied. (B) Mean I-V relationship of INa(T) in the absence (filled black circles) and presence (filled red squares) of 10 μM MGB (mean ± SEM; n = 7 for each point). Current amplitude was measured at the beginning of each depolarizing pulse. Of these, the overall I-V relationship of INa(T) (or peak INa) seen in GH3 cells was unaltered in the presence of MGB. (C) Quasi-steady-state inactivation curve of INa(T) in the control (filled black circles) and during exposure to 10 μM MGB (filled red squares) (mean ± SEM; n = 7 for each point). The Boltzmann equations for the I-V relation and inactivation curve of INa(T) least squares fitted to generate the smooth lines are described in Materials and Methods.
Figure 4
Figure 4
Effect of MGB on the recovery of INa(T) inactivation evoked by varying interpulse intervals with a geometric progression. In these recording experiments, we kept cells bathed in Ca2+-free Tyrode’s solution, while the recording pipette was backfilled with K+-enriched solution. The examined GH3 cells were depolarized from −80 to −10 mV for a duration of 30 ms, and subsequently different interpulse durations with a geometric progression (indicated in the upper part) were delivered to them. The time course of recovery from INa(T) inactivation taken in the absence of (filled black circles) and presence (open pink circles) of 10 μM MGB is illustrated. The relative amplitude of peak INa was measured as a ratio of the second peak amplitude divided by the first peak amplitude peak. The recovery time course (indicated by the smooth line) in the absence of and presence of 10 μM MGB displays an exponential rise as a function of the interpulse interval, with a time constant of 83.2 and 156 ms, respectively. Of note, the x-axis is illustrated with a logarithmic scale. Each point is the mean ± SEM (n = 7).
Figure 5
Figure 5
Effect of MGB on window INa (INa(W)) elicited by short ascending ramp voltage (Vramp). The experiments were conducted with the tested cell voltage-clamped at −80 mV, and the Vramp with a range from −110 to +50 mV was applied for a duration of 50 ms. (A) Representative current traces were acquired in the control period (a, black) and during cell exposure to 10 μM MGB (b, pink) or 30 μM MGB (c, green). The voltage protocol used is illustrated in the upper part, and the downward deflection indicates the occurrence of inward current. (B) Summary bar graph showing the effect of MGB, nimodipine (Nimo), tetrodotoxin (TTX), and MGB plus tefluthrin (Tef) on the area of INa(W) (mean ± SEM; n = 8). Each area was measured at the voltages ranging between −40 and +40 mV during the upsloping Vramp. * This result is significantly different from control (p < 0.05) and + significantly different from MGB (30 μM) alone group (p < 0.05).
Figure 6
Figure 6
Effect of MGB on resurgent INa (INa(R)) evoked by the descending Vramp. The tested cell was held at −100 mV and the 30 ms depolarizing pulse at +30 mV was applied. Following the step depolarization, the downsloping Vramp from +30 to −80 mV was delivered to the cell for a duration of 60 ms. (A) Representative I-V relationships of INa(R) evoked by the descending Vramp in the absence (a, black) and presence (b, pink) of 10 μM MGB. The upper part signifies the voltage protocol used, and the x-axis at the lower part is indicated from +40 to −80 mV. (B) Summary bar graph showing effects of MGB and MGB plus tefluthrin (Tef) on INa(R) (mean ± SEM; n = 7 for each bar). Current amplitude was measured at the level of −20 mV during the descending Vramp. * This result is significantly different from control (p < 0.05) and ** significantly different from the MGB (10 μM) alone group (p < 0.05).
Figure 7
Figure 7
Effect of MGB on persistent INa (INa(P)) activated in response to upright isosceles triangular Vramp, which was utilized to mimic the depolarizing or repolarizing slopes of bursting patterns in electrically excitable cells. (A) Representative current traces activated by isosceles triangular Vramp for a duration of 8 s, or with a ramp speed of ± 75 mV/s (indicated in the uppermost part). The black color in the upper and lower part of (A) indicates the current trace activated by the ascending limb of the Vramp, while the red color shows trace activated by the Vramp’s descending limb. The uppermost part depicts the voltage protocol applied. The purple curved arrow indicates the direction of the current over which time goes during the activation of the triangular ramp pulse. Of note, there is a voltage-dependent hysteresis Vhys (i.e., figure of eight configuration) of INa(P) evoked by the isosceles triangular Vramp with or without the MGB (10 μM) addition. In (B,C), summary bar graphs, respectively, show inhibitory effects of MGB (3 or 10 μM) on the amplitude of INa(P) activated by the upsloping (at −10 mV) and downsloping (at −80 mV) limb of the triangular Vramp (mean ± SEM; n = 7 for each bar). * This result is significantly different from controls (p < 0.05).
Figure 8
Figure 8
Effect of MGB on INa(T) activated by a train of depolarizing pulses in GH3 cells. The train was designed to consist of 40 20 ms pulses (stepped to −10 mV) separated by 5 ms intervals at −80 mV for a duration of 1 s. (A) Representative current traces taken in the control period (a, absence of MGB) and during cell exposure to 10 μM MGB. The voltage-clamp protocol is illustrated in the uppermost part. To provide a single INa trace, the right side of (A) denotes the expanded records from the dashed box of the left side. (B) The relationship of peak INa (INa(T)) versus the pulse train duration in the absence (filled black circles) and presence (open pink circles) of 10 μM MGB (mean ± SEM; n = 7 for each point). The continuous smooth lines over which the data points are overlaid are well-fitted by a single exponential. Of note, the presence of MGB can quicken the time course of INa(T) inactivation in response to a train of depolarizing pulses. (C) Summary bar graph showing the effect of MGB and MGB plus tefluthrin (Tef) on the time constant of current decay in response to a train of depolarizing command voltage from −80 to −10 mV (mean ± SEM; n = 7 for each bar). Current amplitude was measured at the beginning of each depolarizing pulse. Of note, the presence of MGB produces a significant shortening in the time constant in the decline of peak INa activated by a train of pulses. * Significantly different from control (p < 0.05) and ** significantly different from MGB (10 μM) alone group (p < 0.05).
Figure 8
Figure 8
Effect of MGB on INa(T) activated by a train of depolarizing pulses in GH3 cells. The train was designed to consist of 40 20 ms pulses (stepped to −10 mV) separated by 5 ms intervals at −80 mV for a duration of 1 s. (A) Representative current traces taken in the control period (a, absence of MGB) and during cell exposure to 10 μM MGB. The voltage-clamp protocol is illustrated in the uppermost part. To provide a single INa trace, the right side of (A) denotes the expanded records from the dashed box of the left side. (B) The relationship of peak INa (INa(T)) versus the pulse train duration in the absence (filled black circles) and presence (open pink circles) of 10 μM MGB (mean ± SEM; n = 7 for each point). The continuous smooth lines over which the data points are overlaid are well-fitted by a single exponential. Of note, the presence of MGB can quicken the time course of INa(T) inactivation in response to a train of depolarizing pulses. (C) Summary bar graph showing the effect of MGB and MGB plus tefluthrin (Tef) on the time constant of current decay in response to a train of depolarizing command voltage from −80 to −10 mV (mean ± SEM; n = 7 for each bar). Current amplitude was measured at the beginning of each depolarizing pulse. Of note, the presence of MGB produces a significant shortening in the time constant in the decline of peak INa activated by a train of pulses. * Significantly different from control (p < 0.05) and ** significantly different from MGB (10 μM) alone group (p < 0.05).

Similar articles

Cited by

References

    1. Calandre E.P., Rico-Villademoros F., Slim M. Alpha2delta ligands, gabapentin, pregabalin and mirogabalin: A review of their clinical pharmacology and therapeutic use. Expert Rev. Neurother. 2016;16:1263–1277. doi: 10.1080/14737175.2016.1202764. - DOI - PubMed
    1. Hutmacher M.M., Frame B., Miller R., Truitt K., Merante D. Exposure-response modeling of average daily pain score, and dizziness and somnolence, for mirogabalin (DS-5565) in patients with diabetic peripheral neuropathic pain. J. Clin. Pharm. 2016;56:67–77. doi: 10.1002/jcph.567. - DOI - PubMed
    1. Domon Y., Kitano Y., Makino M. Analgesic effects of the novel α2δ ligand mirogabalin in a rat model of spinal cord injury. Pharmazie. 2018;73:659–661. - PubMed
    1. Domon Y., Arakawa N., Inoue T., Matsuda F., Takahashi M., Yamamura N., Kai K., Kitano Y. Binding characteristics and analgesic effects of mirogabalin, a novel ligand for the α2δ subunit of voltage-gated calcium channels. J. Pharm. Exp. 2018;365:573–582. doi: 10.1124/jpet.117.247551. - DOI - PubMed
    1. Javed S., Alam U., Malik R.A. Mirogabalin and emerging therapies for diabetic neuropathy. J. Pain Res. 2018;11:1559–1566. doi: 10.2147/JPR.S145999. - DOI - PMC - PubMed