. 2022 Apr 2;23(7):3983.
doi: 10.3390/ijms23073983.

Suppression of CCT3 Inhibits Tumor Progression by Impairing ATP Production and Cytoplasmic Translation in Lung Adenocarcinoma

Affiliations

Suppression of CCT3 Inhibits Tumor Progression by Impairing ATP Production and Cytoplasmic Translation in Lung Adenocarcinoma

Shuohua Chen et al. Int J Mol Sci. .

Abstract

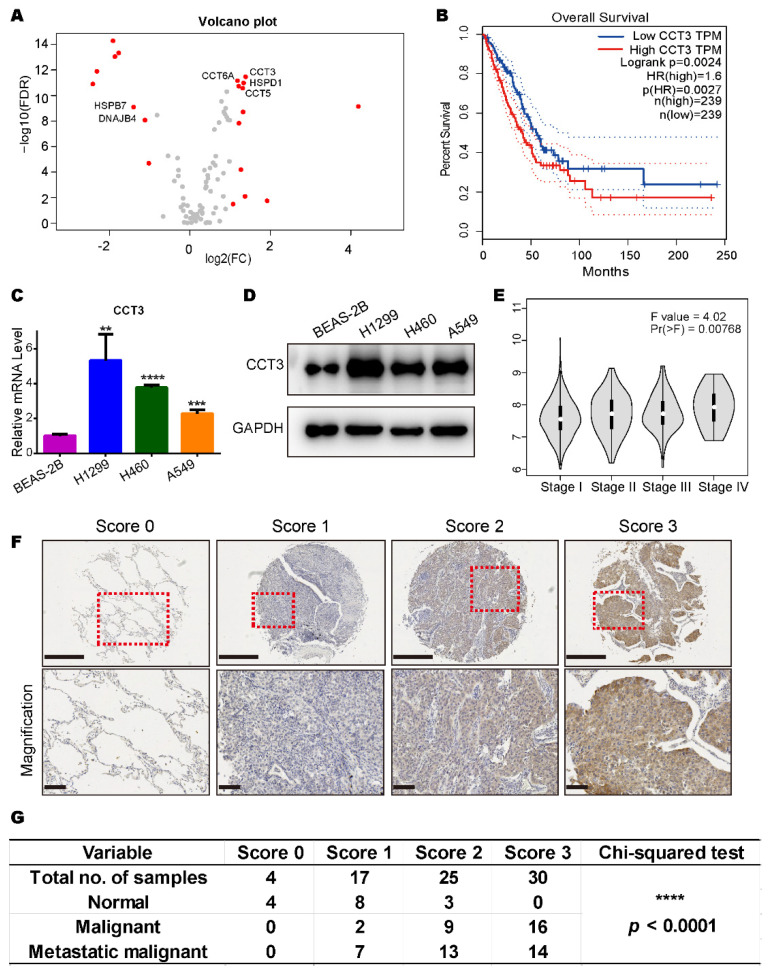
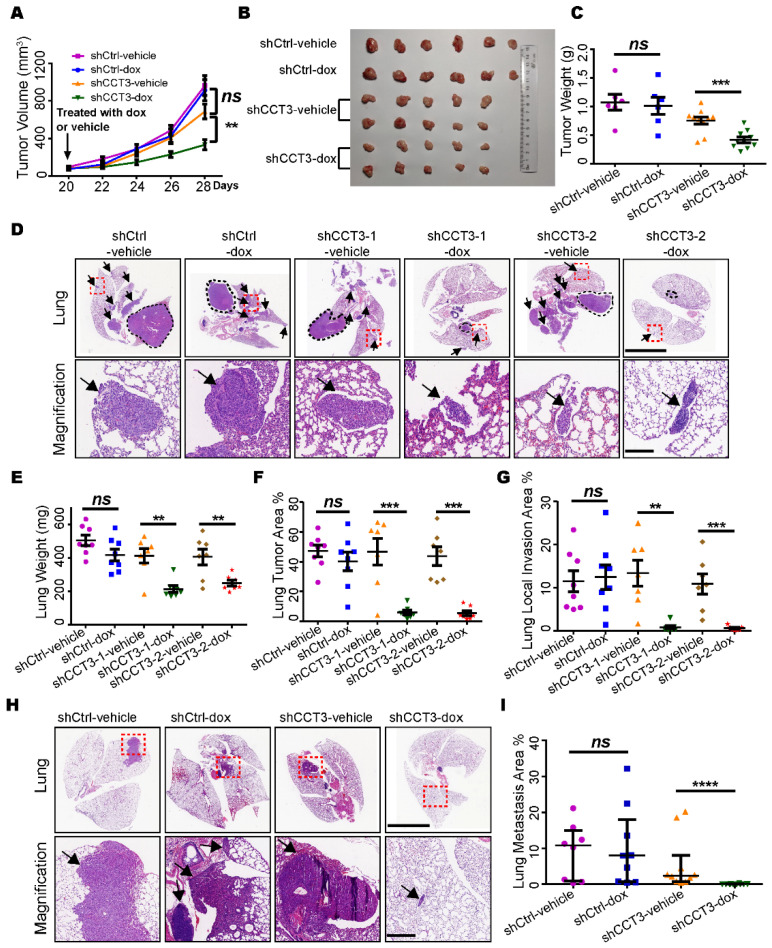
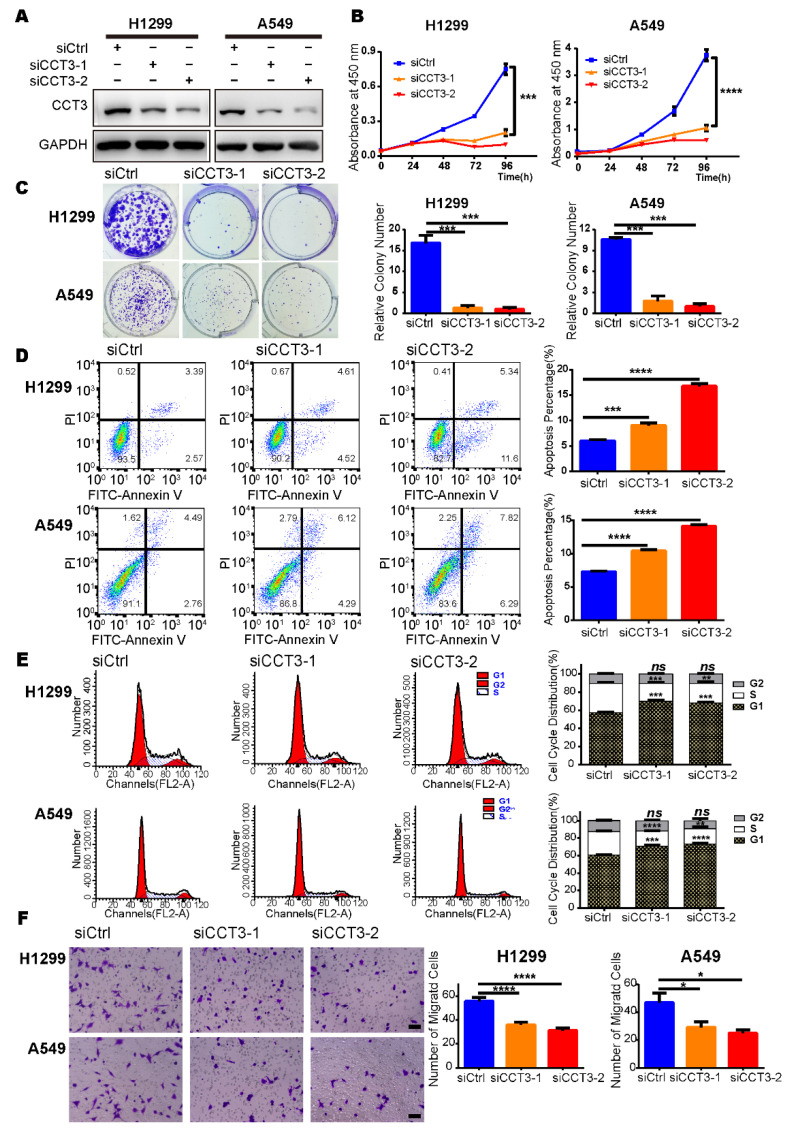
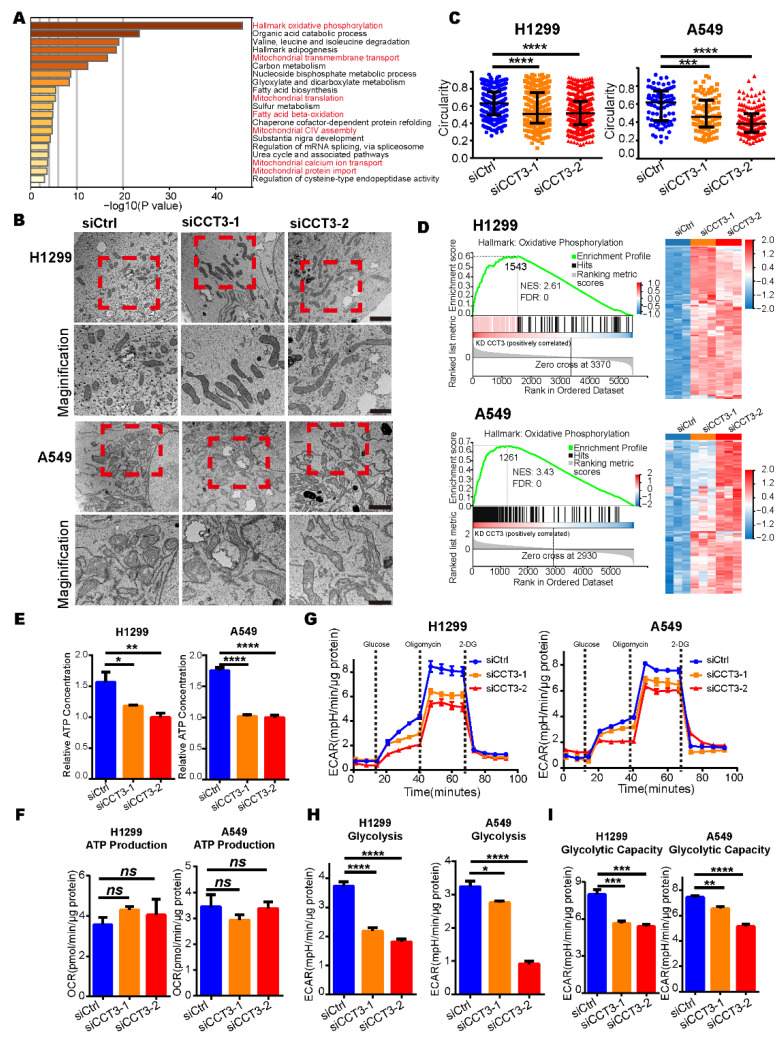
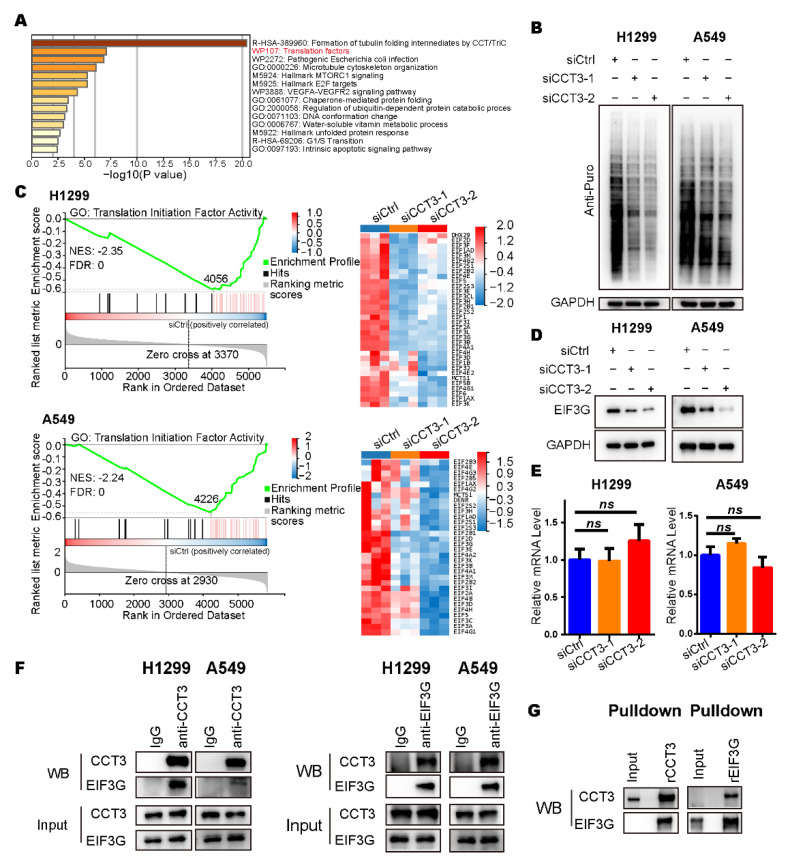
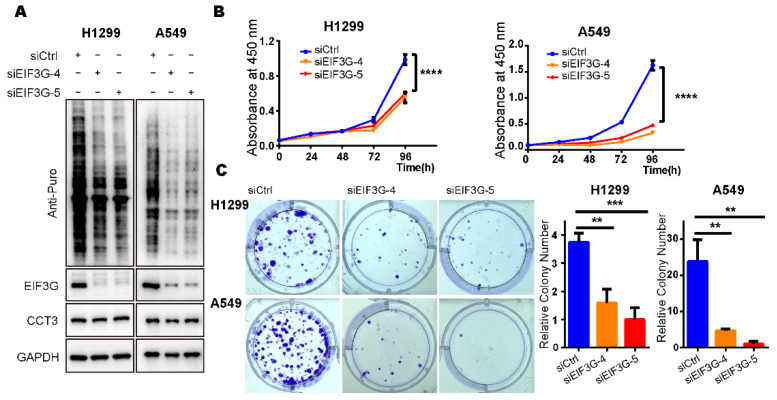
Heat shock proteins are highly expressed in various cancers and exert critical functions in tumor progression. However, their expression patterns and functions in lung adenocarcinoma (LUAD) remain largely unknown. We identified that chaperonin-containing T-complex protein-1 subunit 3 (CCT3) was highly expressed in LUAD cells and was positively correlated with LUAD malignancy in the clinical samples. Animal studies showed that silencing CCT3 dramatically inhibited tumor growth and metastasis of LUAD. Proliferation and migration were markedly suppressed in CCT3-deficient LUAD cells. Moreover, the knockdown of CCT3 promoted apoptosis and cell cycle arrest. Mechanistically, the function of glycolysis was significantly inhibited and the total intracellular ATP levels were reduced by at least 25% in CCT3-deficient cells. In addition, the knockdown of CCT3 decreased the protein translation and led to a significant reduction in eukaryotic translation initiation factor 3 (EIF3G) protein, which was identified as a protein that interacts with CCT3. Impaired protein synthesis and cell growth in EIF3G-deficient cells were consistent with those caused by CCT3 knockdown in LUAD cells. Taken together, our study demonstrated in multiple ways that CCT3 is a critical factor for supporting growth and metastasis of LUAD, and for the first time, its roles in maintaining intracellular ATP levels and cytoplasmic translation are reported. Our novel findings provide a potential therapeutic target for lung adenocarcinoma.

Keywords: ATP production; CCT3; cytoplasmic translation; growth; lung adenocarcinoma; metastasis.


Conflict of interest statement

The authors declare no conflict of interest. The funders had no role in the design of the study; in the collection, analyses, or interpretation of data; in the writing of the manuscript, or in the decision to publish the results.

Figures

Figure 1
Figure 1
CCT3 is abundantly expressed in lung adenocarcinoma and positively correlated with tumor malignancy. (A) Volcano plot of HSP gene expression (535 LUAD tissues vs. 59 normal tissues). Red dots represent genes with |log2 (FC)| > 1 and FDR < 0.05. FC, fold change. FDR, false discovery rate. Raw data were downloaded from TCGA database. (B) Kaplan–Meier curve for overall survival of LUAD patients with high or low CCT3 expression. HR, hazard ratio. The plot was created by Gene Expression Profiling Interactive Analysis (GEPIA). Difference was assessed using the log-rank test. The dashed lines represent the 95% confidence interval. (C,D) CCT3 mRNA (C) and protein (D) levels in BEAS-2B, H1299, H460 and A549 cells. Relative mRNA levels of CCT3 were normalized to the mRNA levels of GAPDH. Representative data were from three independent experiments. Data are shown as mean + SD, ** p < 0.01, *** p < 0.001, **** p < 0.0001, two-tailed Student’s t-test. (E) Expression levels of CCT3 in different tumor stages of LUAD. The pathological stage plot was made by GEPIA. One-way ANOVA was employed to analyze the differences in gene expression in different stages of LUAD. (F) Representative images of the protein levels of CCT3 in the lung tissues with the corresponding IHC scores. Tissues were scored based on the staining intensity. The red dashed boxes represent the amplified views. Upper image scale bar = 500 μm, lower image scale bar = 100 μm. (G) Scores represent the IHC staining intensity of CCT3 in (F). 0 = negative, 1 = low positive, 2 = positive and 3 = high positive. The chi-squared test was used to evaluate the association among the categorical variables. **** p < 0.0001.
Figure 2
Figure 2
Silencing CCT3 inhibits the tumor growth and lung metastasis of LUAD. (A) Tumor growth in the subcutaneous tumor model. When the tumor volume reached 100 mm3, the mice were administrated with dox or vehicle, as indicated, to induce the knockdown of CCT3 in tumor cells. N = 6 or 10/group. (B) Tumors resected from each group (A). (C) Final tumor weight in each group (A). (D) Orthotopic tumor model. Representative H&E images of the lungs inoculated with different cell-line groups (n = 7 or 8/group) treated with dox or vehicle as indicated. The black dotted lines mark the primary tumors. The black arrows indicate the lung local invasion of tumor cells. The red dashed boxes indicate the amplified positions. The scale bar of upper lung images is 5 mm, and the scale bar of bottom amplified views is 200 μm. (EG) Lung wet weight (E), lung tumor area (F) and lung local invasion area (G) were quantitated in the orthotopic tumor model (D). (H) Lung metastasis in mice after intravenous injection with tumor cells treated as indicated in the different groups (n ≥ 8/group). The red dashed line boxes indicate the amplified positions, the black arrows indicate the metastasis tumor. The scale bar of upper lung images is 5 mm, and the scale bar of bottom amplified views is 200 μm. (I) Quantification of lung metastasis areas. Dox, 2 mg/mL doxycycline in 5% sucrose water; vehicle, 5% sucrose water. Data are represented as mean ± SEM or median with interquartile range; ns, not significant; ** p < 0.01, *** p < 0.001, **** p < 0.0001, Mann–Whitney or two-tailed Student’s t-tests.
Figure 3
Figure 3
Suppression of CCT3 inhibits the growth and motility of LUAD cells. (A) The CCT3 knockdown efficiencies were evaluated by Western blot. (B) Cell proliferation (n = 5/group) and (C) colony formation (n = 3/group) in CCT3 knockdown cells and corresponding control cells. Representative images of colony formation assays (left) and relative colony numbers (right). (D) Representative images (left) and quantitative results (right) of apoptosis in LUAD cells treated for 72 h with siRNAs targeting CCT3 or a control. (E) Representative images (left) and quantitative results (right) of cell cycle distribution of LUAD cells after transfection with siRNAs targeting CCT3 or a control for 48 h. (F) Representative images (left) and quantitative results (right) of the transwell assays to evaluate the migration of H1299 and A549 cells with different treatments. At least five fields were quantitated in each well. Scale bar = 100 μm. Data are shown as mean + SD; ns, not significant; * p < 0.05, ** p < 0.01, *** p < 0.001, **** p < 0.0001, two-tailed Student’s t-test.
Figure 4
Figure 4
The intracellular ATP levels are decreased in CCT3-knockdown LUAD cells. (A) Pathway enrichment analysis of up-regulated proteins in CCT3 knockdown groups was performed with Metascape. Red font represents the pathways associated with the mitochondrion. (B) Representative mitochondrial images via transmission electron microscopy in H1299 and A549 cells with indicated treatments. The red dashed boxes represent the amplified visuals. Scale bar of top images = 2 μm, scale bar of bottom images = 1μm. (C) Quantification of the circularity of mitochondria in (B). Data are represented as median with interquartile range; *** p < 0.001, **** p < 0.0001, Mann–Whitney test. (D) GSEA enrichment plots (left) of the OXPHOS pathway and heat maps (right) of the corresponding proteins. The red represents overexpression, and the blue symbolizes down-regulation. (E) Intracellular ATP levels in CCT3 knockdown and control cells. The values were normalized to protein quantity. Data are represented as mean + SD, * p < 0.05, ** p < 0.01, **** p < 0.0001. Two-tailed Student’s t-test. (F) ATP synthesis-linked respiration used to evaluate mitochondrial function in ATP production evaluated by oxygen consumption rate (OCR). The values were normalized to protein quantity. Data are represented as mean + SEM; ns, not significant, two-tailed Student’s t-test. (G) Extracellular acidification rate (ECAR) in CCT3 knockdown and control cells measured by Seahorse analysis (glycolysis stress test). Before the experiment, the culture medium was replaced with XF assay medium supplemented with 4 mM glutamine. Discontinued lines symbolize the injections of components. The final concentrations of compounds were: 10 mM glucose, 4 μM oligomycin and 50 mM 2-deoxy-D-glucose (2-DG). (H,I) Function in basal glycolysis (H) and glycolytic capacity (I) of the cells evaluated by ECAR. Data were normalized to protein quantity and are shown as mean + SEM; * p < 0.05, ** p < 0.01, *** p < 0.001, **** p < 0.0001, two-tailed Student’s t-test.
Figure 5
Figure 5
The global translation was reduced in CCT3-knockdown LUAD cells. (A) Pathway enrichment analysis of down-regulated proteins in CCT3-knockdown LUAD cells analyzed with Metascape. (B) Representative WB images of SUnSET assays in H1299 and A549 cells with the indicated treatments. Note: 10 μg/mL puromycin was added into the culture medium to label the newly synthesized peptides in cells. (C) GSEA enrichment plots (left) of the translation initiation factor activity pathway, and heat maps (right) of the corresponding down-regulated proteins in indicated groups. The red represents overexpression, and the blue symbolizes down-regulation. (D) Representative images of WB showing that EIF3G was decreased in CCT3 knockdown cells. (E) Relative mRNA levels of EIF3G in H1299 and A549 cells treated with siRNAs targeting CCT3 or a control. The values were normalized to the mRNA level of GAPDH. Three independent experiments were performed. Data are shown as mean + SD; ns, not significant, two-tailed Student’s t-test. (F) Representative WB images of the interaction between CCT3 and EIF3G detected by co-IP assays. (G) The physical interaction between CCT3 and EIF3G was validated by pull-down assays.
Figure 6
Figure 6
Knockdown of EIF3G alone inhibits the growth of LUAD cells. (A) Representative WB images of SUnSET assays in H1299 and A549 cells treated with siRNAs targeting EIF3G or a control. Note: 10 μg/mL puromycin was added into culture medium to label the newly synthesized peptides in cells. (B) Cell proliferation (n = 5/group) in indicated cells measured with CCK8 assays. (C) Colony formation (n = 3/group) in EIF3G knockdown cells and corresponding control cells. Representative images of colony formation assay (left), relative colony number (right). Data are shown as mean + SD, ** p < 0.01, *** p < 0.001, **** p < 0.0001, two-tailed Student’s t-test.

Similar articles

Cited by

References

    1. Thai A.A., Solomon B.J., Sequist L.V., Gainor J.F., Heist R.S. Lung cancer. Lancet. 2021;398:535–554. doi: 10.1016/S0140-6736(21)00312-3. - DOI - PubMed
    1. Wang M., Herbst R.S., Boshoff C. Toward personalized treatment approaches for non-small-cell lung cancer. Nat. Med. 2021;27:1345–1356. doi: 10.1038/s41591-021-01450-2. - DOI - PubMed
    1. Birbo B., Madu E.E., Madu C.O., Jain A., Lu Y. Role of HSP90 in Cancer. Int. J. Mol. Sci. 2021;22:10317. doi: 10.3390/ijms221910317. - DOI - PMC - PubMed
    1. Robichaud N., Sonenberg N., Ruggero D., Schneider R.J. Translational Control in Cancer. Cold Spring Harb. Perspect. Biol. 2019;11 doi: 10.1101/cshperspect.a032896. - DOI - PMC - PubMed
    1. Wu J., Liu T., Rios Z., Mei Q., Lin X., Cao S. Heat Shock Proteins and Cancer. Trends Pharm. Sci. 2017;38:226–256. doi: 10.1016/j.tips.2016.11.009. - DOI - PubMed

MeSH terms

Substances